| Param | Original file | Final file |
|---|---|---|
| Filename | modeM0/AS1G07_022T01_9000001322_09337cztM0_level2.evt | modeM0/AS1G07_022T01_9000001322_09337cztM0_level2_quad_clean.evt |
| Size (bytes) | 486,714,240 | 88,637,760 |
| Size | 464.2 MB | 84.5 MB |
| Events in quadrant A | 3,641,661 | 574,697 |
| Events in quadrant B | 3,069,681 | 589,407 |
| Events in quadrant C | 3,484,648 | 572,919 |
| Events in quadrant D | 4,126,201 | 517,331 |
| Mode M0 | |||
|---|---|---|---|
| Quadrant | BADHDUFLAG | Total packets | Discarded packets |
| A | 0 | 15700 | 799 |
| B | 0 | 13723 | 483 |
| C | 0 | 15217 | 550 |
| D | 0 | 17328 | 608 |
| Mode SS | |||
|---|---|---|---|
| Quadrant | BADHDUFLAG | Total packets | Discarded packets |
| A | 0 | 130 | 8 |
| B | 0 | 130 | 4 |
| C | 0 | 130 | 4 |
| D | 0 | 130 | 4 |
| Mode M9 | |||
|---|---|---|---|
| Quadrant | BADHDUFLAG | Total packets | Discarded packets |
| A | 0 | 26 | 0 |
| B | 0 | 26 | 0 |
| C | 0 | 26 | 0 |
| D | 0 | 26 | 1 |
| Quadrant | Total seconds | Saturated seconds | Saturation percentage |
|---|---|---|---|
| A | 6117 | 43 | 0.702959% |
| B | 6170 | 33 | 0.534846% |
| C | 6173 | 125 | 2.024947% |
| D | 6175 | 496 | 8.032389% |
Noise dominated data is calculated using 1-second bins in cleaned event files. If a bin has >2000 counts, and if more than 50% of those come from <1% of pixels, then it is considered to be noise-dominated and hence unusable.
| Quadrant | # 1 sec bins | Bins with >0 counts | Bins with >2000 counts | High rate bins dominated by noise | Noise dominated (total time) | Noise dominated (detector-on time) | Marked lightcurve |
|---|---|---|---|---|---|---|---|
| A | 8898 | 6309 | 8 | 8 | 0.09% | 0.13% |  |
| B | 8891 | 6332 | 2 | 2 | 0.02% | 0.03% |  |
| C | 8899 | 6337 | 73 | 73 | 0.82% | 1.15% |  |
| D | 8899 | 6344 | 368 | 368 | 4.14% | 5.80% |  |
Top three noisy pixels from each quadrant. If the there are fewer than three noisy pixels in the level2.evt file, extra rows are filled as -1
| Pixel properties | Quadrant properties | ||||||
|---|---|---|---|---|---|---|---|
| Quadrant | DetID | PixID | Counts | Sigma | Mean | Median | Sigma |
| A | 8 | 5 | 679089 | 4635.1 | 721 | 707 | 146.4 |
| A | 13 | 251 | 83846 | 568.05 | 721 | 707 | 146.4 |
| A | 5 | 16 | 33157 | 221.72 | 721 | 707 | 146.4 |
| B | 0 | 219 | 79228 | 561.34 | 737 | 719 | 139.9 |
| B | 0 | 214 | 59097 | 417.4 | 737 | 719 | 139.9 |
| B | 0 | 187 | 22774 | 157.69 | 737 | 719 | 139.9 |
| C | 4 | 254 | 735085 | 4558.99 | 699 | 702 | 161.1 |
| C | 9 | 68 | 9765 | 56.26 | 699 | 702 | 161.1 |
| C | 13 | 61 | 5263 | 28.31 | 699 | 702 | 161.1 |
| D | 1 | 52 | 1143446 | 6598.61 | 655 | 639 | 173.2 |
| D | 12 | 233 | 286196 | 1648.82 | 655 | 639 | 173.2 |
| D | 7 | 71 | 84506 | 484.25 | 655 | 639 | 173.2 |
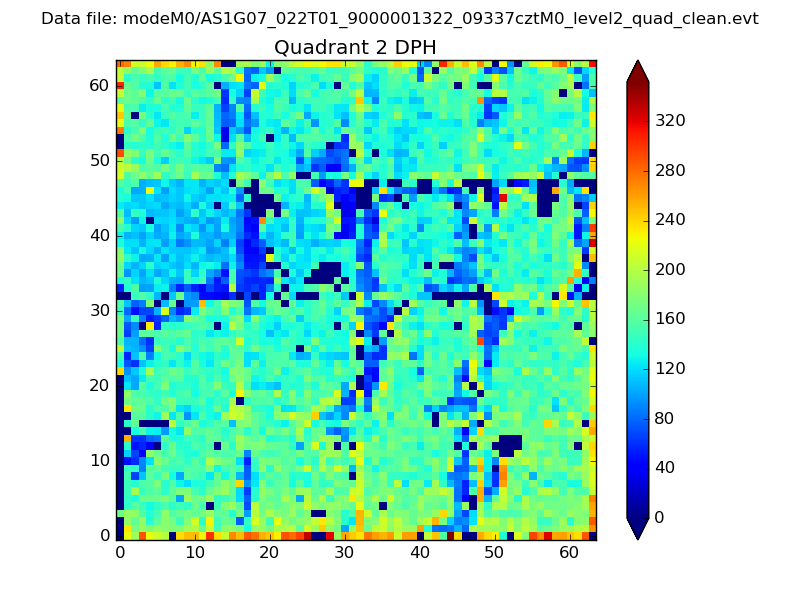
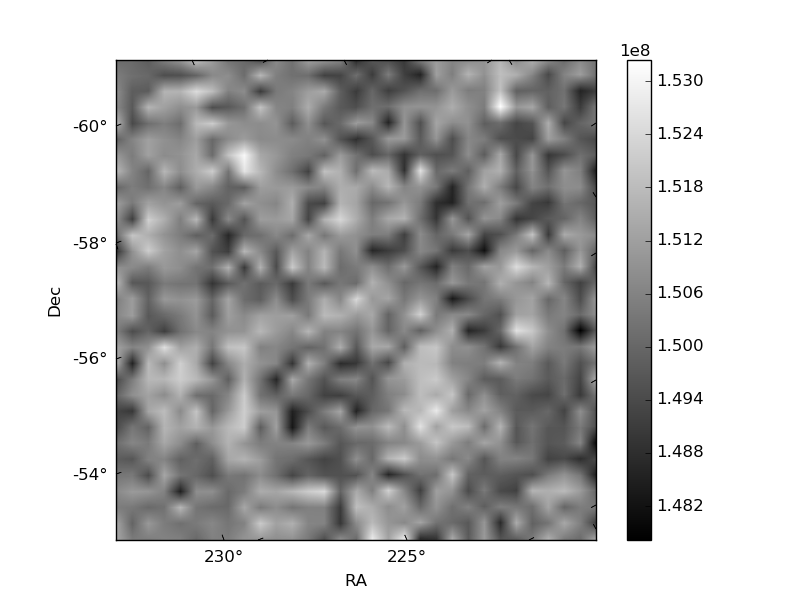
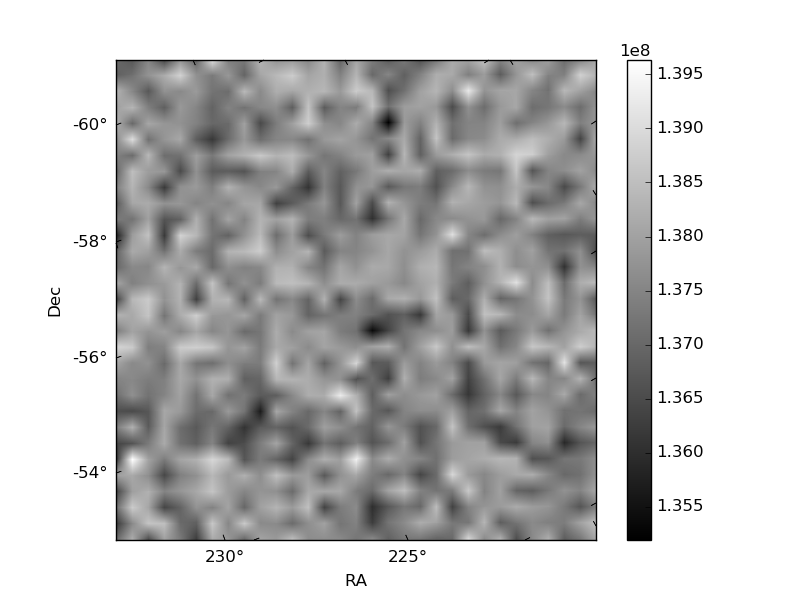
Histogram calculated using DETX and DETY for each event in the final _common_clean file
| Quadrant A | 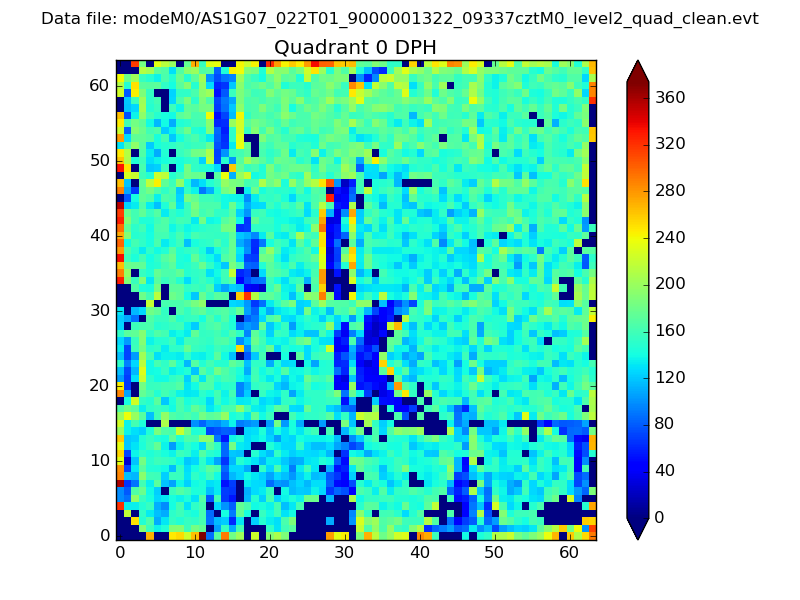 |
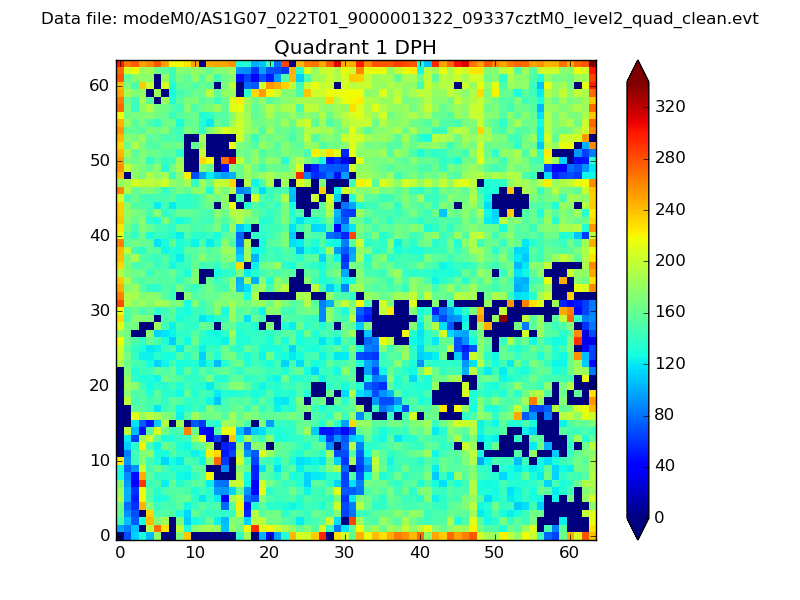 |
Quadrant B |
|---|---|---|---|
| Quadrant D | 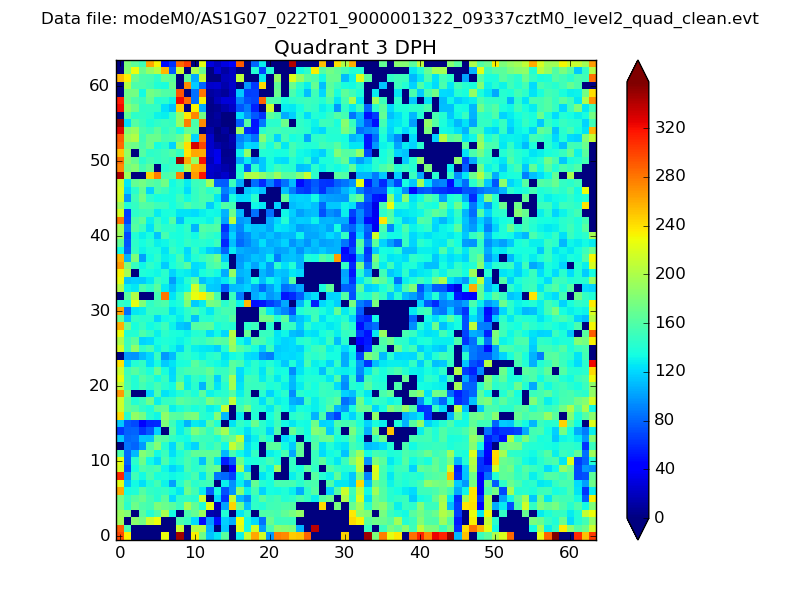 |
 |
Quadrant C |
| Plot type | Count rate plots | Images |
|---|---|---|
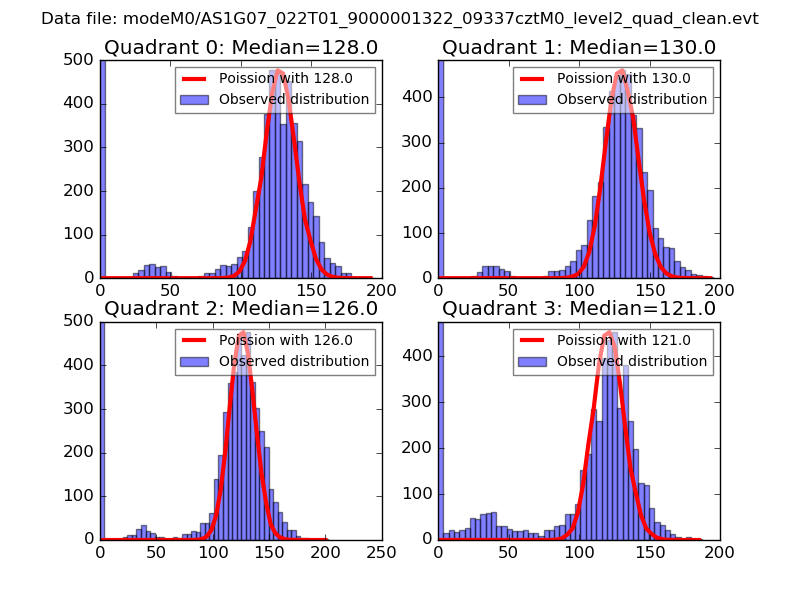
| Comparison with Poisson distribution Blue bars denote a histogram of data divided into 1 sec bins. Red curve is a Poisson curve with rate = median count rate of data. |
 |
 |
| Quadrant-wise count rates Data is divided into 100 sec bins |
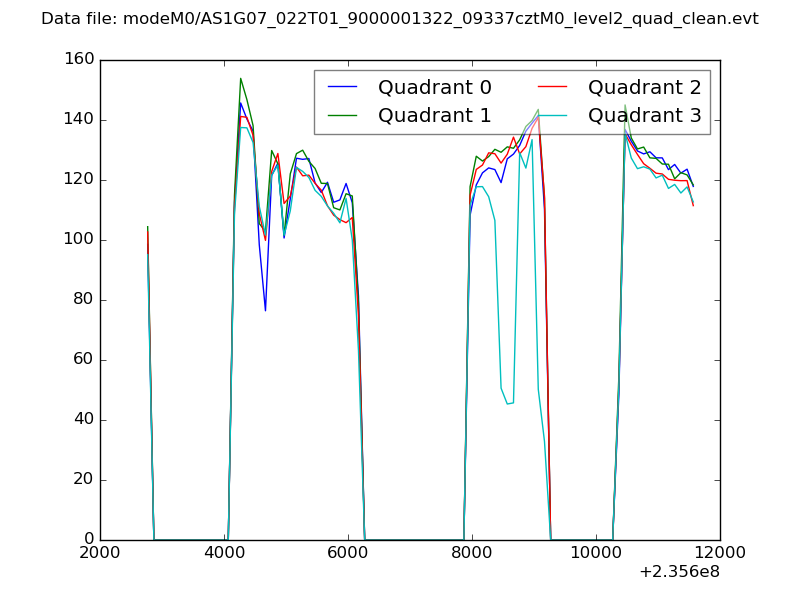 |
|
| Module-wise count rates for Quadrant A Data is divided into 100 sec bins |
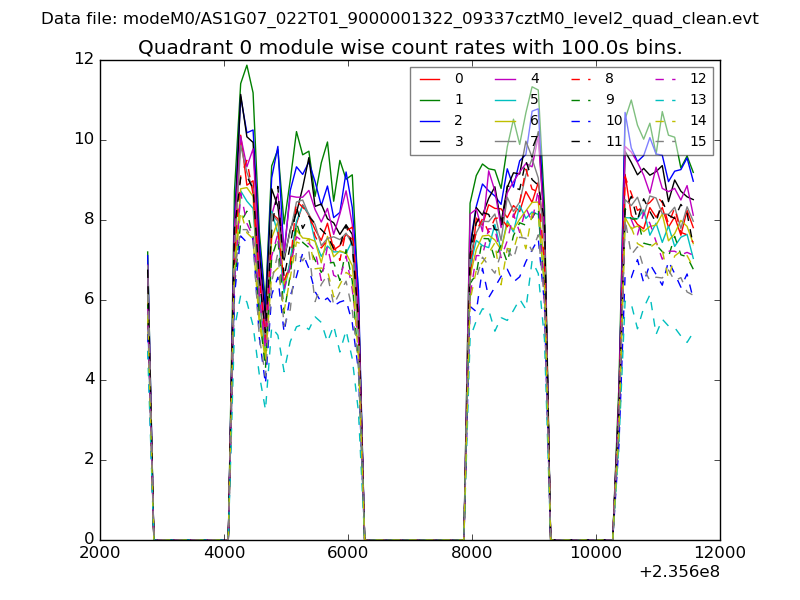 |
 |
| Module-wise count rates for Quadrant B Data is divided into 100 sec bins |
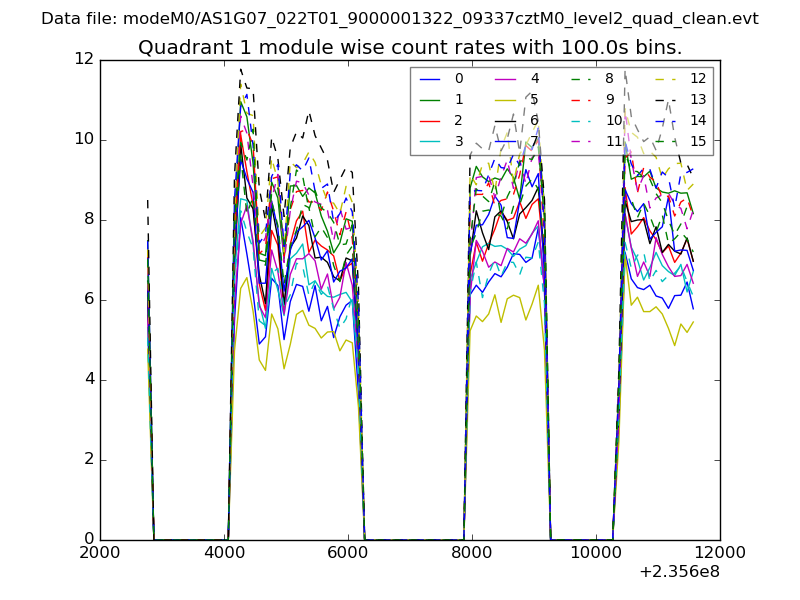 |
 |
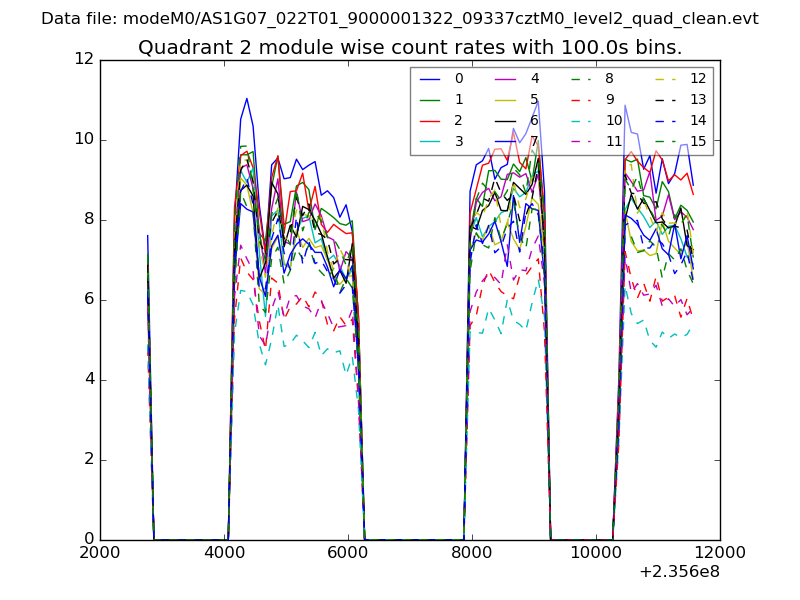
| Module-wise count rates for Quadrant C Data is divided into 100 sec bins |
 |
 |
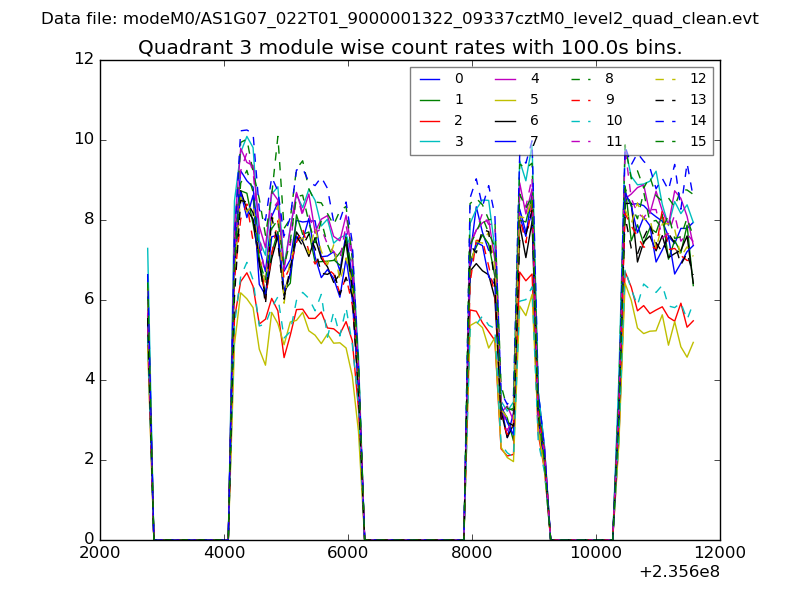
| Module-wise count rates for Quadrant D Data is divided into 100 sec bins |
 |
 |
| Parameter | Plot |
|---|---|
| CZT HV Monitor | 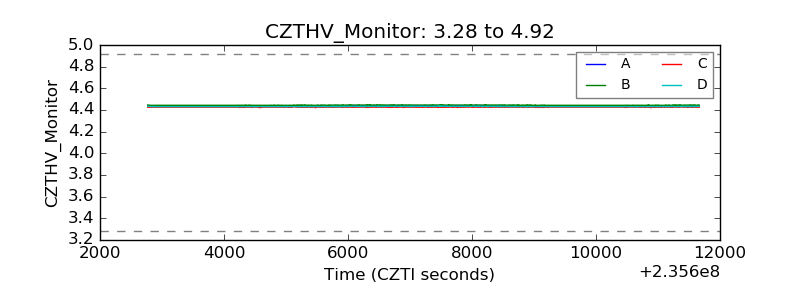 |
| D_VDD | 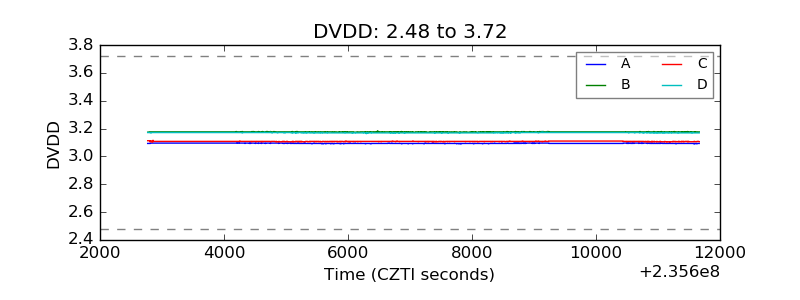 |
| Temperature 1 | 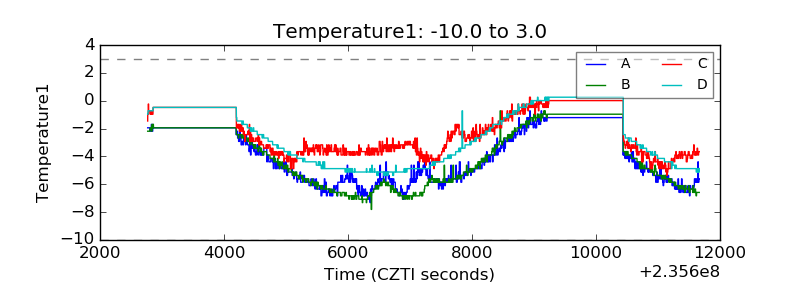 |
| Veto HV Monitor |  |
| Veto LLD | 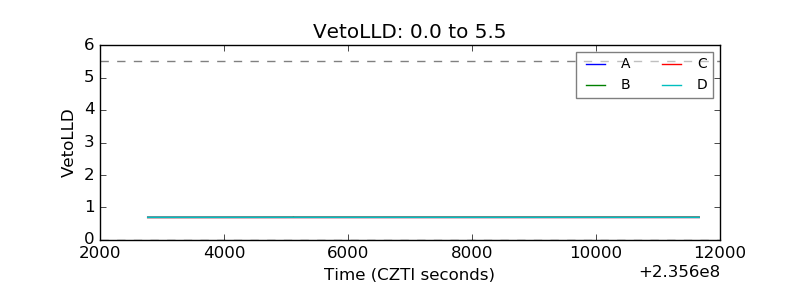 |
| Alpha Counter | 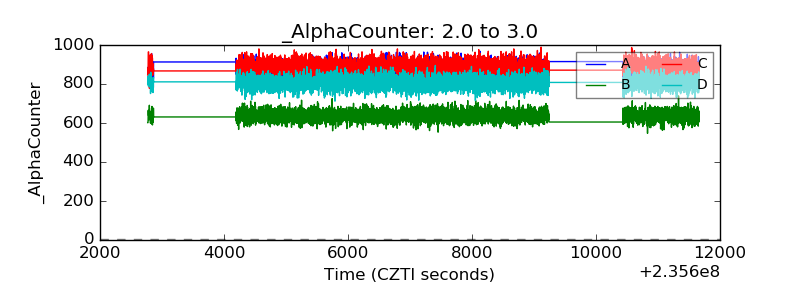 |
| _CPM_Rate | 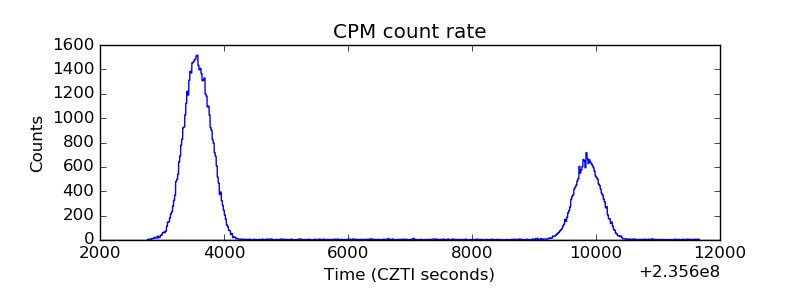 |
| CZT Counter | 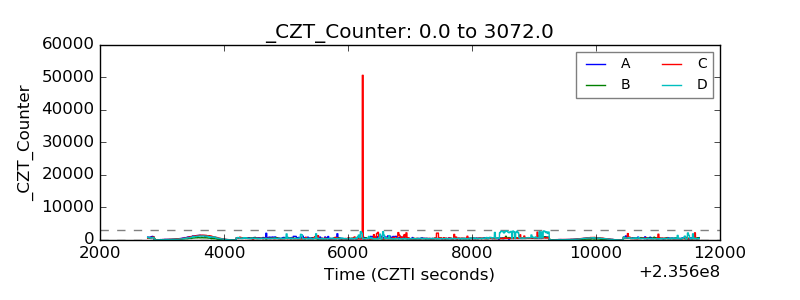 |
| +2.5 Volts monitor | 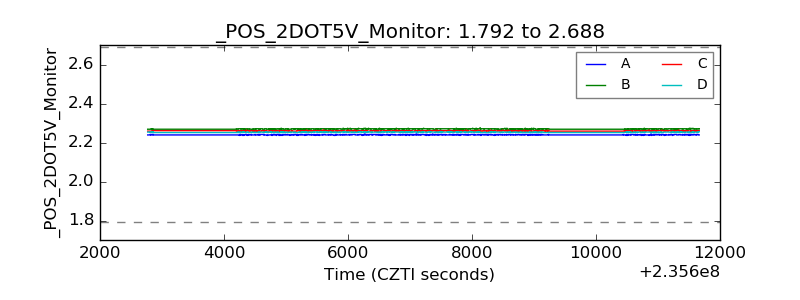 |
| +5 Volts monitor |  |
| _ROLL_ROT | 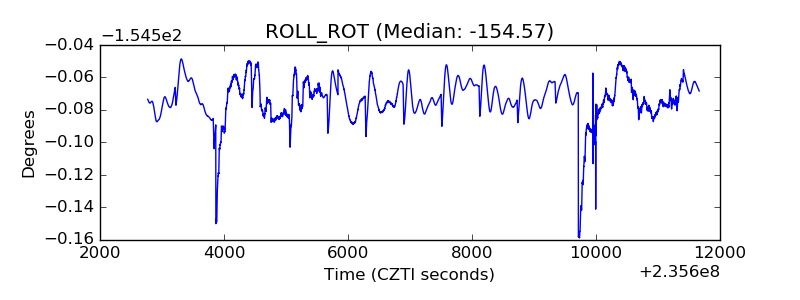 |
| _Roll_DEC | 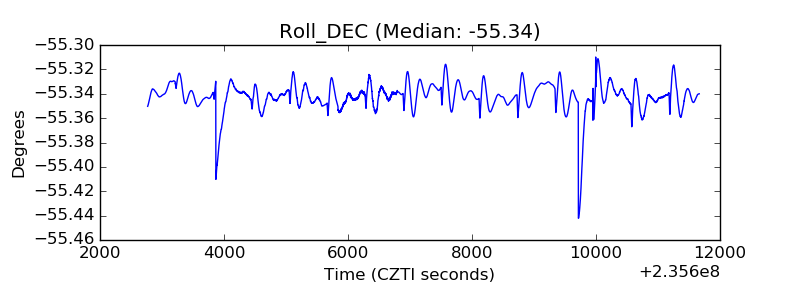 |
| _Roll_RA | 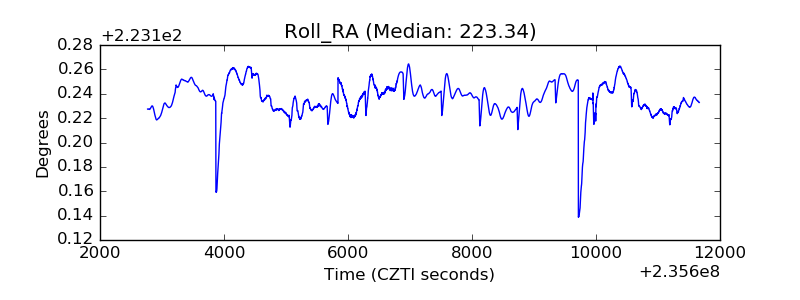 |
| Veto Counter | 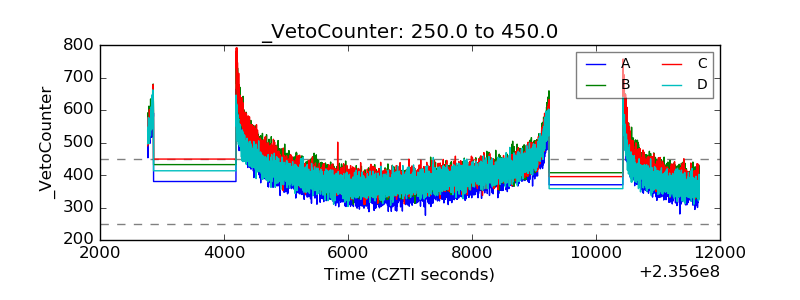 |