| Param | Original file | Final file |
|---|---|---|
| Filename | modeM0/AS1G07_022T01_9000001322_09338cztM0_level2.evt | modeM0/AS1G07_022T01_9000001322_09338cztM0_level2_quad_clean.evt |
| Size (bytes) | 1,391,198,400 | 265,104,000 |
| Size | 1.3 GB | 252.8 MB |
| Events in quadrant A | 11,229,925 | 1,684,198 |
| Events in quadrant B | 9,032,391 | 1,698,818 |
| Events in quadrant C | 10,887,089 | 1,764,965 |
| Events in quadrant D | 9,730,734 | 1,603,860 |
| Mode M0 | |||
|---|---|---|---|
| Quadrant | BADHDUFLAG | Total packets | Discarded packets |
| A | 0 | 46966 | 1075 |
| B | 0 | 40170 | 973 |
| C | 0 | 46781 | 1453 |
| D | 0 | 43850 | 1876 |
| Mode SS | |||
|---|---|---|---|
| Quadrant | BADHDUFLAG | Total packets | Discarded packets |
| A | 0 | 384 | 2 |
| B | 0 | 384 | 8 |
| C | 0 | 384 | 10 |
| D | 0 | 384 | 10 |
| Mode M9 | |||
|---|---|---|---|
| Quadrant | BADHDUFLAG | Total packets | Discarded packets |
| A | 0 | 48 | 0 |
| B | 0 | 48 | 2 |
| C | 0 | 48 | 0 |
| D | 0 | 48 | 1 |
| Quadrant | Total seconds | Saturated seconds | Saturation percentage |
|---|---|---|---|
| A | 18551 | 177 | 0.954126% |
| B | 18574 | 124 | 0.667600% |
| C | 18524 | 731 | 3.946232% |
| D | 18516 | 263 | 1.420393% |
Noise dominated data is calculated using 1-second bins in cleaned event files. If a bin has >2000 counts, and if more than 50% of those come from <1% of pixels, then it is considered to be noise-dominated and hence unusable.
| Quadrant | # 1 sec bins | Bins with >0 counts | Bins with >2000 counts | High rate bins dominated by noise | Noise dominated (total time) | Noise dominated (detector-on time) | Marked lightcurve |
|---|---|---|---|---|---|---|---|
| A | 25869 | 18829 | 68 | 68 | 0.26% | 0.36% | 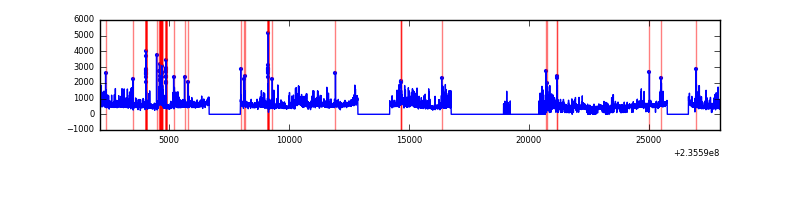 |
| B | 25869 | 18859 | 14 | 14 | 0.05% | 0.07% | 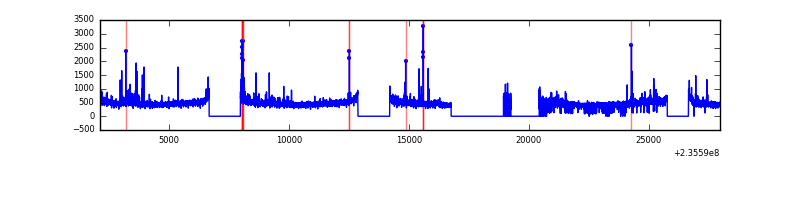 |
| C | 25869 | 18807 | 428 | 428 | 1.65% | 2.28% | 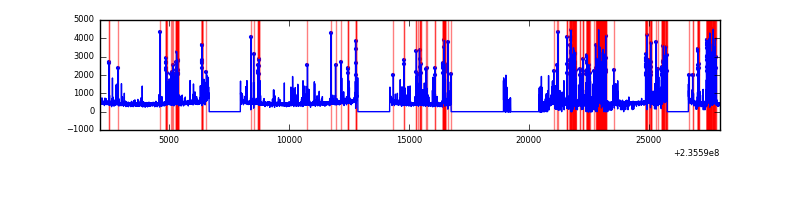 |
| D | 25869 | 18778 | 185 | 185 | 0.72% | 0.99% | 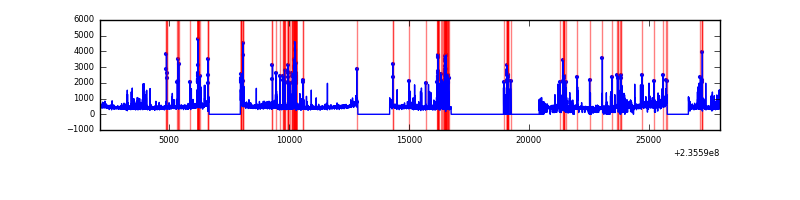 |
Top three noisy pixels from each quadrant. If the there are fewer than three noisy pixels in the level2.evt file, extra rows are filled as -1
| Pixel properties | Quadrant properties | ||||||
|---|---|---|---|---|---|---|---|
| Quadrant | DetID | PixID | Counts | Sigma | Mean | Median | Sigma |
| A | 8 | 5 | 2084406 | 4811.39 | 2163 | 2122 | 432.8 |
| A | 13 | 251 | 334019 | 766.89 | 2163 | 2122 | 432.8 |
| A | 5 | 16 | 158434 | 361.18 | 2163 | 2122 | 432.8 |
| B | 0 | 219 | 154519 | 371.54 | 2190 | 2140 | 410.1 |
| B | 0 | 214 | 139380 | 334.63 | 2190 | 2140 | 410.1 |
| B | 10 | 245 | 65536 | 154.58 | 2190 | 2140 | 410.1 |
| C | 4 | 254 | 2828343 | 6002.37 | 2052 | 2058 | 470.9 |
| C | 13 | 61 | 15487 | 28.52 | 2052 | 2058 | 470.9 |
| C | 4 | 238 | 15414 | 28.37 | 2052 | 2058 | 470.9 |
| D | 12 | 233 | 727709 | 1351.29 | 2056 | 2007 | 537.0 |
| D | 1 | 52 | 291122 | 538.34 | 2056 | 2007 | 537.0 |
| D | 2 | 152 | 238500 | 440.36 | 2056 | 2007 | 537.0 |
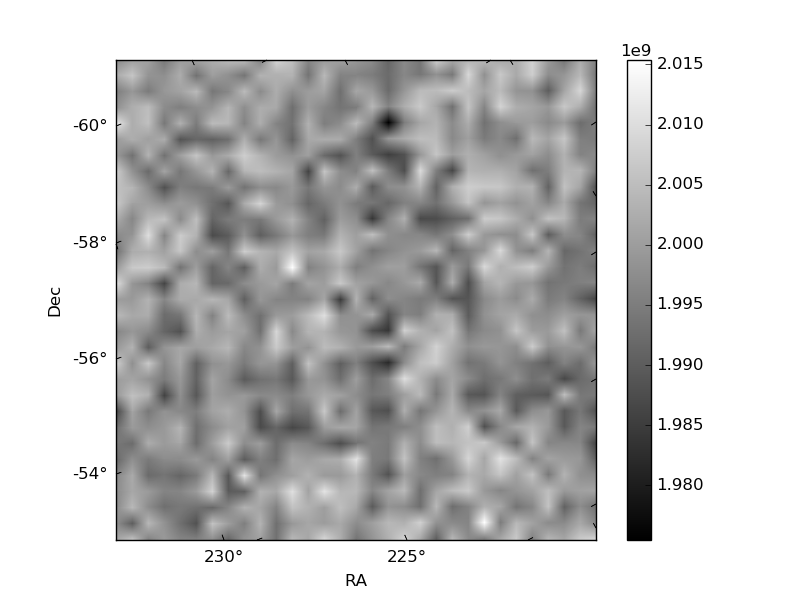
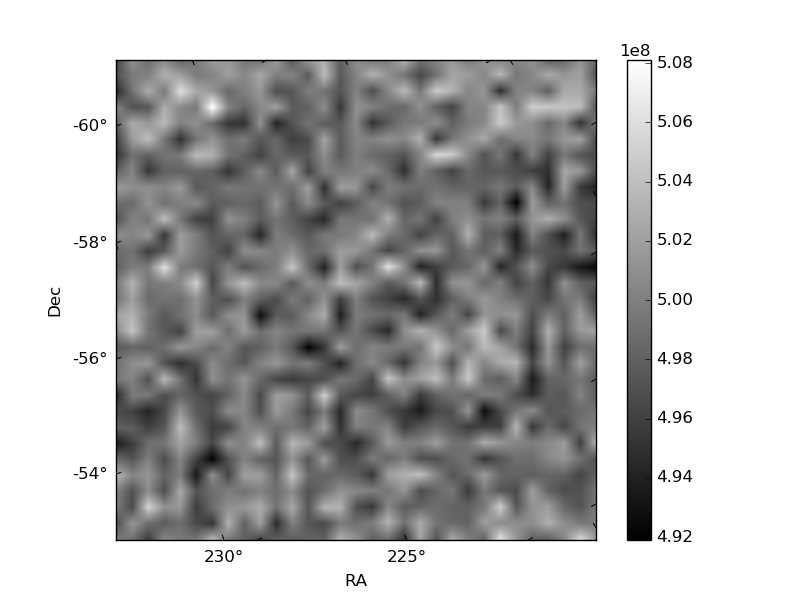
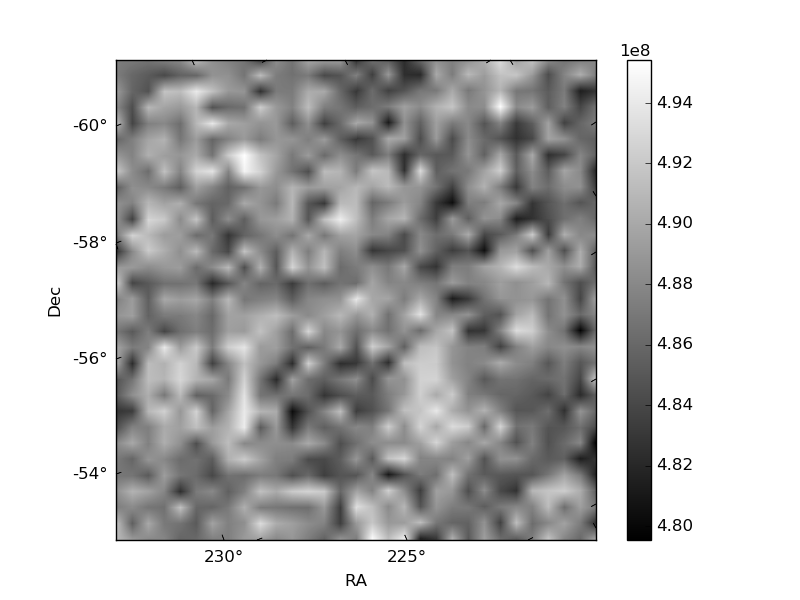
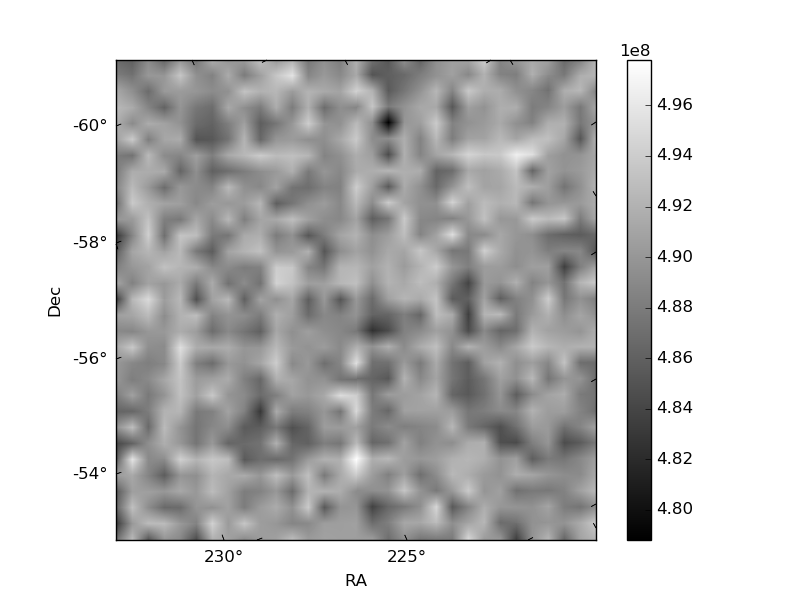
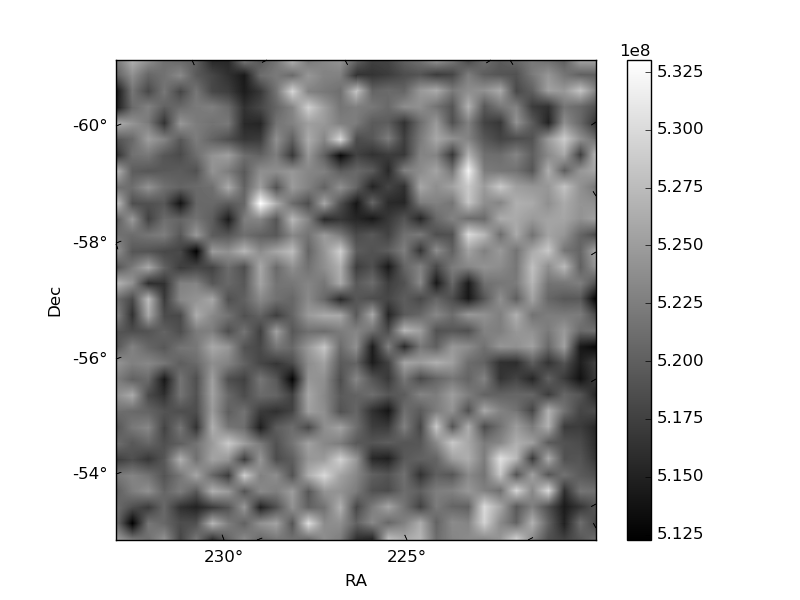
Histogram calculated using DETX and DETY for each event in the final _common_clean file
| Quadrant A | 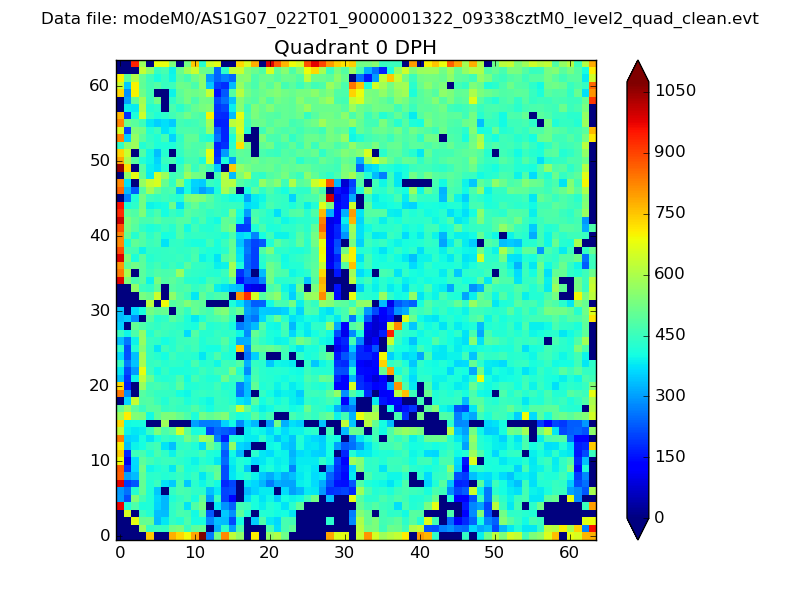 |
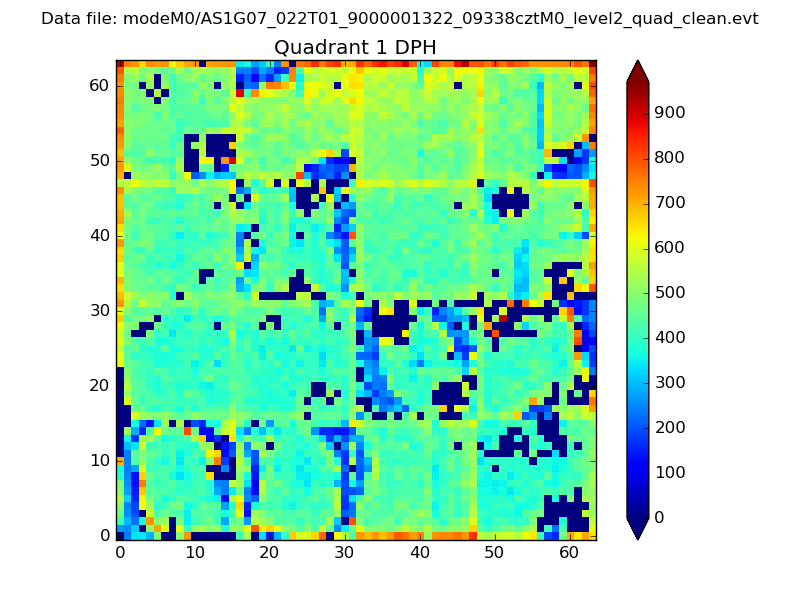 |
Quadrant B |
|---|---|---|---|
| Quadrant D | 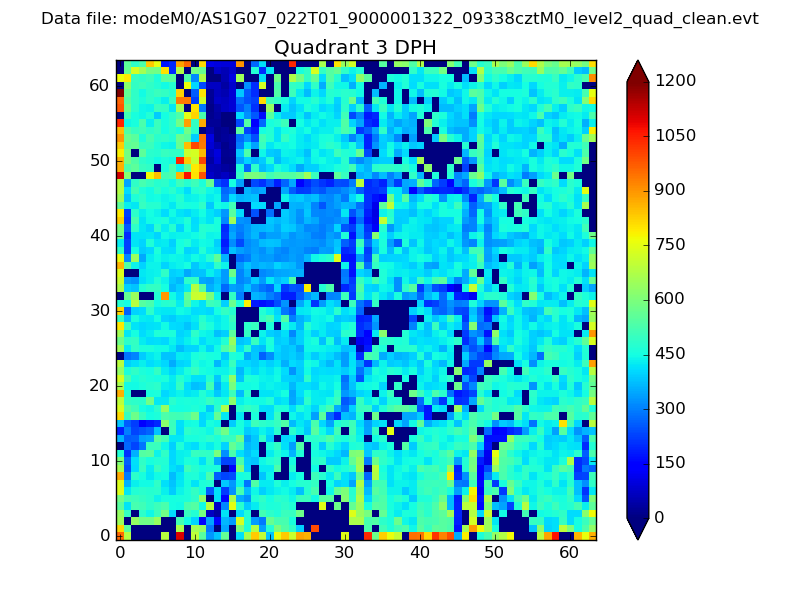 |
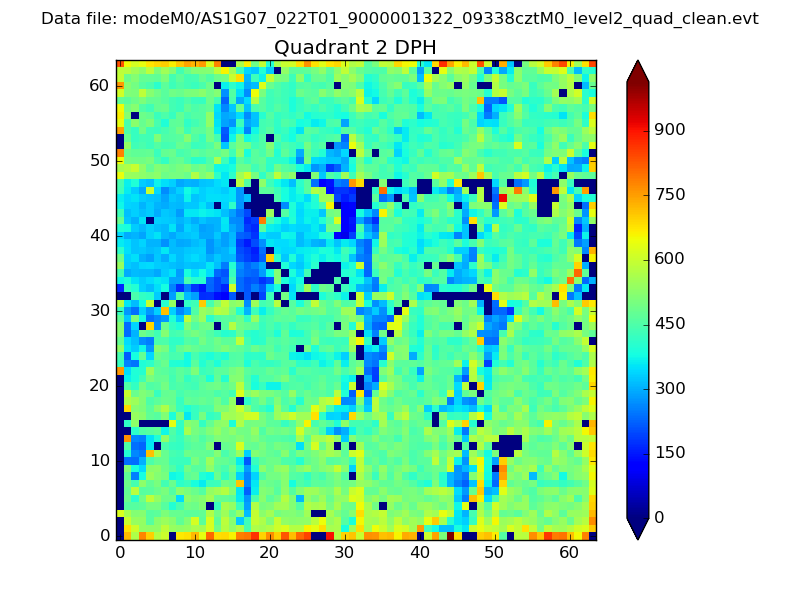 |
Quadrant C |
| Plot type | Count rate plots | Images |
|---|---|---|
| Comparison with Poisson distribution Blue bars denote a histogram of data divided into 1 sec bins. Red curve is a Poisson curve with rate = median count rate of data. |
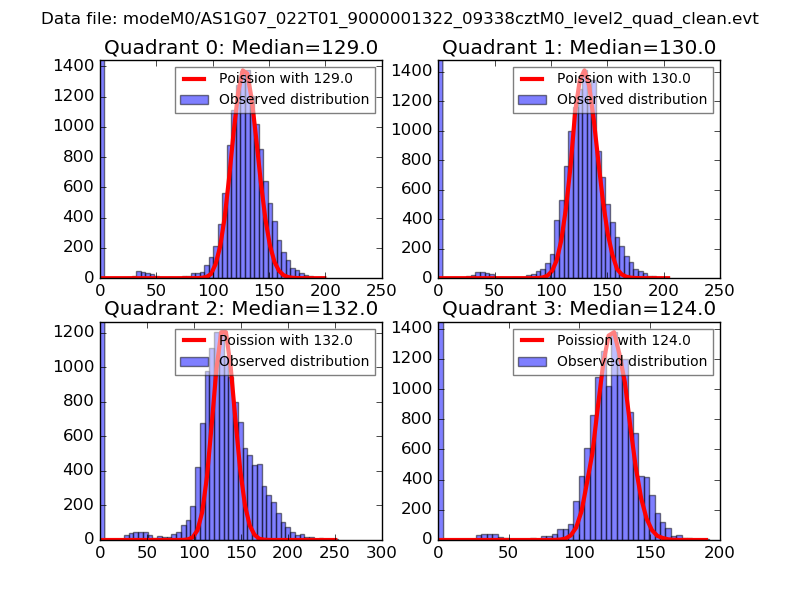 |
 |
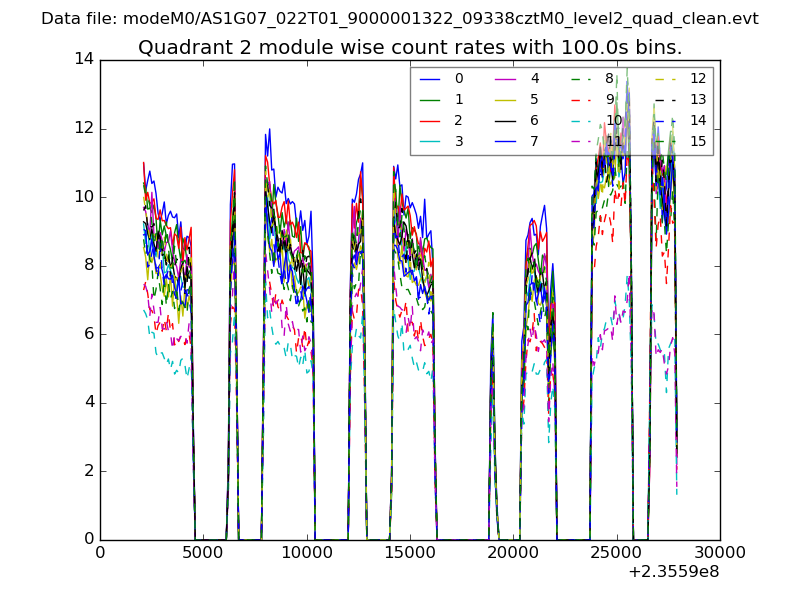
| Quadrant-wise count rates Data is divided into 100 sec bins |
 |
|
| Module-wise count rates for Quadrant A Data is divided into 100 sec bins |
 |
 |
| Module-wise count rates for Quadrant B Data is divided into 100 sec bins |
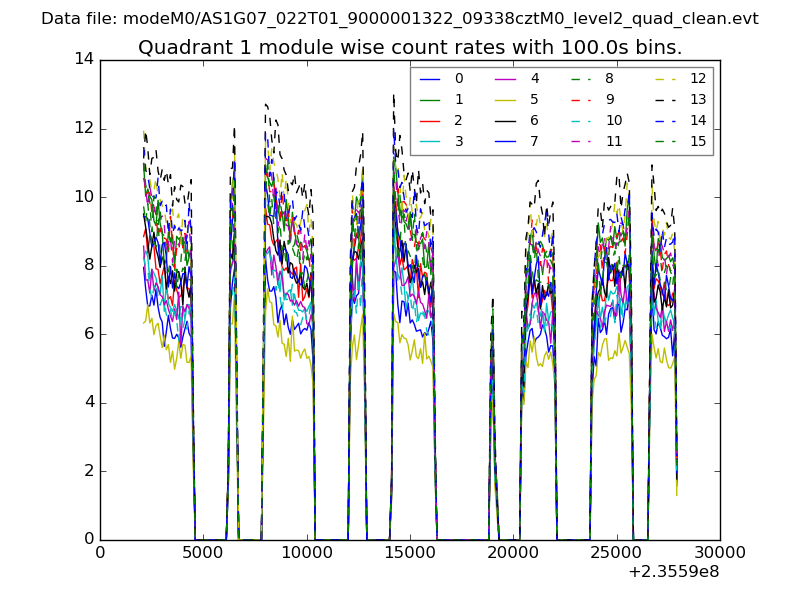 |
 |
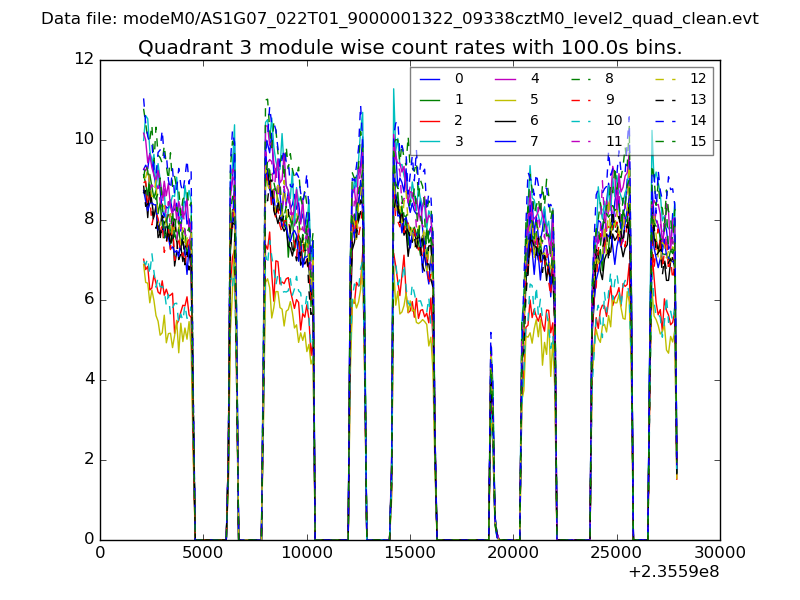
| Module-wise count rates for Quadrant C Data is divided into 100 sec bins |
 |
 |
| Module-wise count rates for Quadrant D Data is divided into 100 sec bins |
 |
 |
| Parameter | Plot |
|---|---|
| CZT HV Monitor | 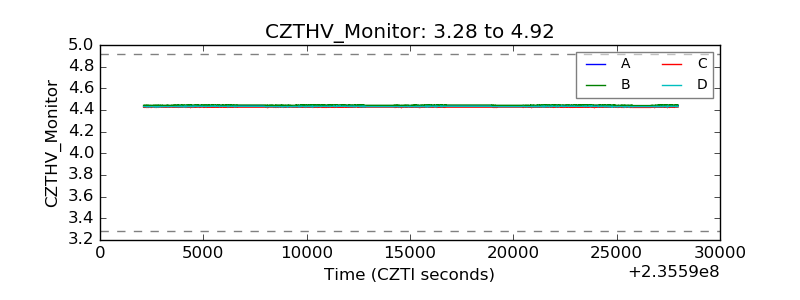 |
| D_VDD | 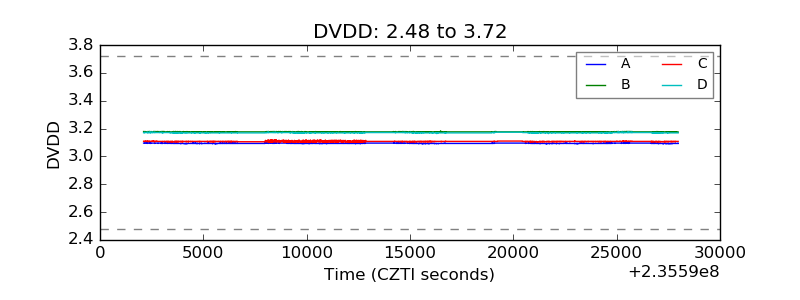 |
| Temperature 1 | 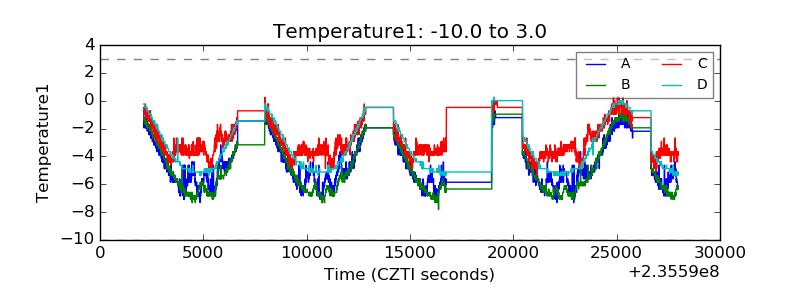 |
| Veto HV Monitor | 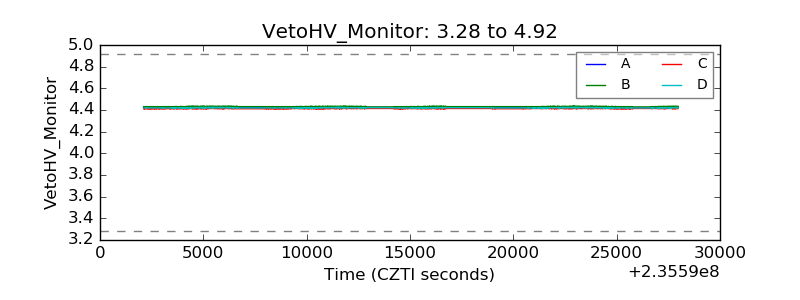 |
| Veto LLD | 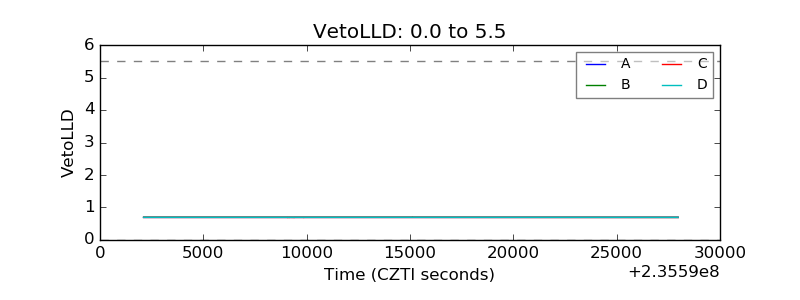 |
| Alpha Counter | 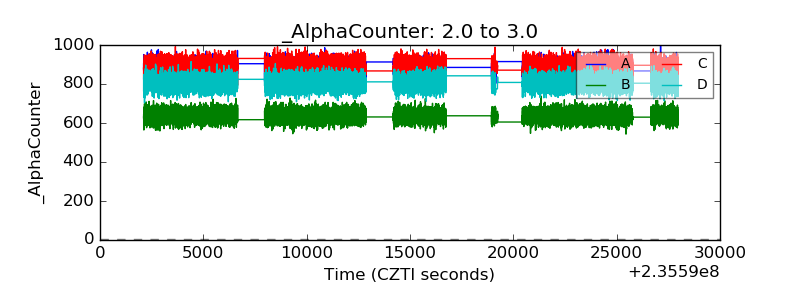 |
| _CPM_Rate | 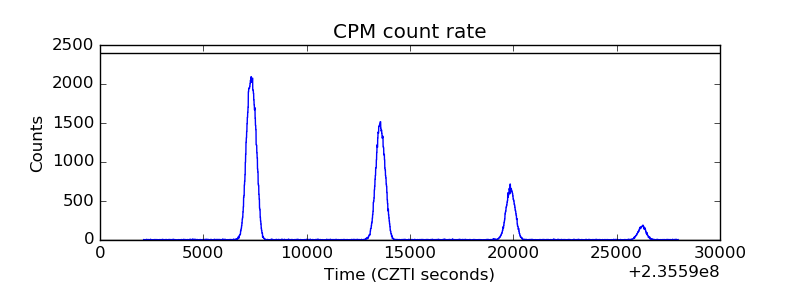 |
| CZT Counter | 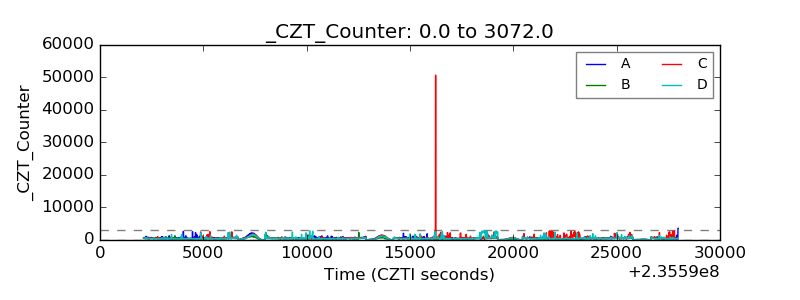 |
| +2.5 Volts monitor |  |
| +5 Volts monitor |  |
| _ROLL_ROT | 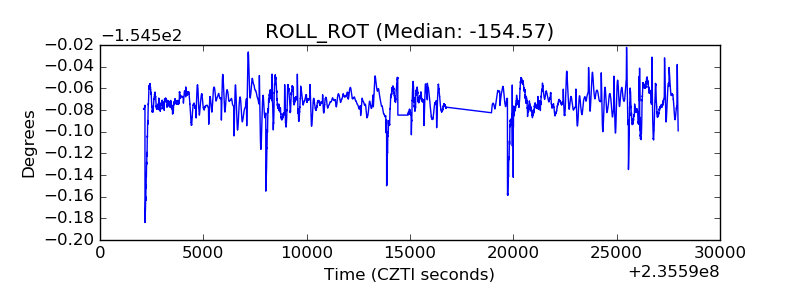 |
| _Roll_DEC | 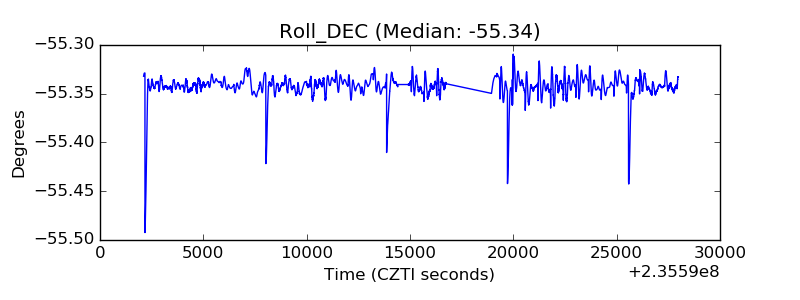 |
| _Roll_RA | 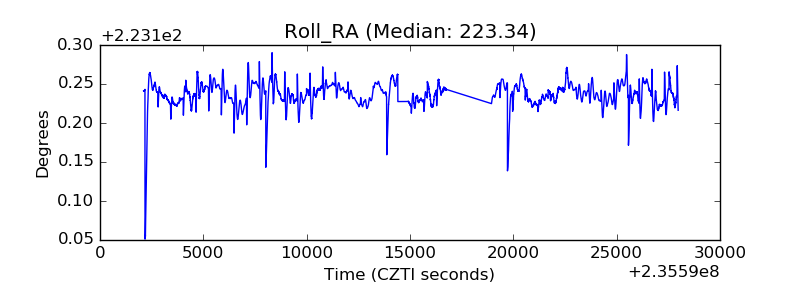 |
| Veto Counter | 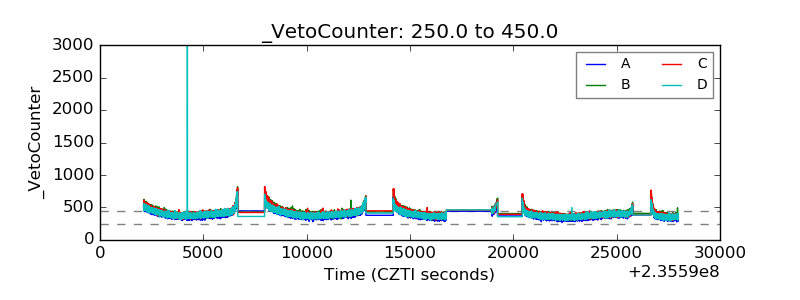 |