| Param | Original file | Final file |
|---|---|---|
| Filename | modeM0/AS1G07_022T01_9000001322_09339cztM0_level2.evt | modeM0/AS1G07_022T01_9000001322_09339cztM0_level2_quad_clean.evt |
| Size (bytes) | 957,951,360 | 166,109,760 |
| Size | 913.6 MB | 158.4 MB |
| Events in quadrant A | 6,971,471 | 1,053,136 |
| Events in quadrant B | 6,042,365 | 1,059,667 |
| Events in quadrant C | 8,675,070 | 1,016,000 |
| Events in quadrant D | 6,457,950 | 1,018,366 |
| Mode M0 | |||
|---|---|---|---|
| Quadrant | BADHDUFLAG | Total packets | Discarded packets |
| A | 0 | 29424 | 82 |
| B | 0 | 26823 | 83 |
| C | 0 | 34868 | 115 |
| D | 0 | 28521 | 84 |
| Mode SS | |||
|---|---|---|---|
| Quadrant | BADHDUFLAG | Total packets | Discarded packets |
| A | 0 | 258 | 0 |
| B | 0 | 258 | 4 |
| C | 0 | 258 | 0 |
| D | 0 | 258 | 0 |
| Mode M9 | |||
|---|---|---|---|
| Quadrant | BADHDUFLAG | Total packets | Discarded packets |
| A | 0 | 15 | 0 |
| B | 0 | 15 | 0 |
| C | 0 | 15 | 0 |
| D | 0 | 16 | 0 |
| Quadrant | Total seconds | Saturated seconds | Saturation percentage |
|---|---|---|---|
| A | 12794 | 120 | 0.937940% |
| B | 12793 | 84 | 0.656609% |
| C | 12788 | 985 | 7.702534% |
| D | 12793 | 162 | 1.266318% |
Noise dominated data is calculated using 1-second bins in cleaned event files. If a bin has >2000 counts, and if more than 50% of those come from <1% of pixels, then it is considered to be noise-dominated and hence unusable.
| Quadrant | # 1 sec bins | Bins with >0 counts | Bins with >2000 counts | High rate bins dominated by noise | Noise dominated (total time) | Noise dominated (detector-on time) | Marked lightcurve |
|---|---|---|---|---|---|---|---|
| A | 14236 | 12828 | 20 | 20 | 0.14% | 0.16% | 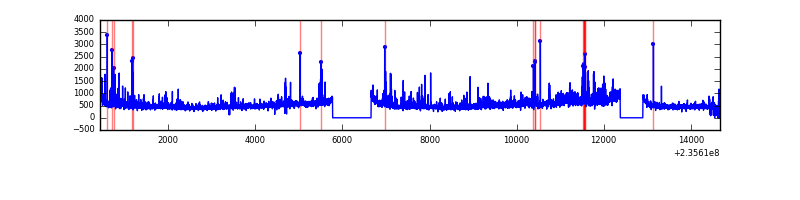 |
| B | 14237 | 12826 | 1 | 1 | 0.01% | 0.01% | 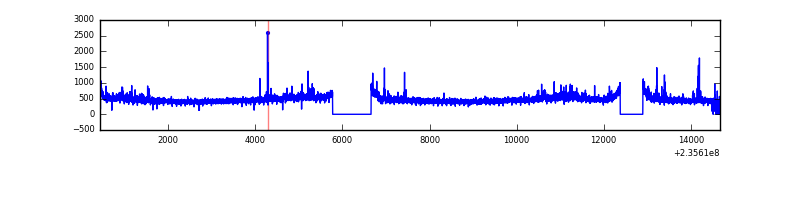 |
| C | 14236 | 12826 | 585 | 585 | 4.11% | 4.56% | 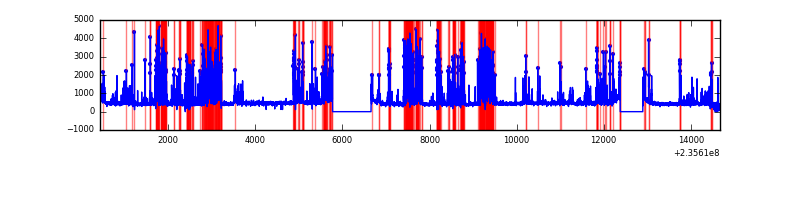 |
| D | 14237 | 12827 | 90 | 90 | 0.63% | 0.70% | 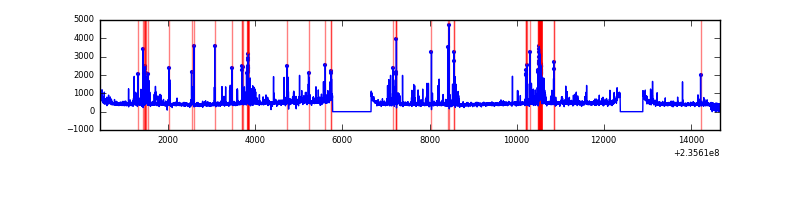 |
Top three noisy pixels from each quadrant. If the there are fewer than three noisy pixels in the level2.evt file, extra rows are filled as -1
| Pixel properties | Quadrant properties | ||||||
|---|---|---|---|---|---|---|---|
| Quadrant | DetID | PixID | Counts | Sigma | Mean | Median | Sigma |
| A | 8 | 5 | 922848 | 3138.58 | 1464 | 1434 | 293.6 |
| A | 13 | 251 | 192924 | 652.27 | 1464 | 1434 | 293.6 |
| A | 1 | 162 | 91582 | 307.07 | 1464 | 1434 | 293.6 |
| B | 0 | 214 | 108685 | 383.26 | 1476 | 1438 | 279.8 |
| B | 0 | 219 | 66599 | 232.86 | 1476 | 1438 | 279.8 |
| B | 12 | 111 | 30040 | 102.21 | 1476 | 1438 | 279.8 |
| C | 4 | 254 | 3246559 | 10236.67 | 1378 | 1382 | 317.0 |
| C | 4 | 238 | 20408 | 60.01 | 1378 | 1382 | 317.0 |
| C | 14 | 234 | 20348 | 59.83 | 1378 | 1382 | 317.0 |
| D | 13 | 104 | 445424 | 1213.45 | 1409 | 1372 | 365.9 |
| D | 2 | 152 | 179873 | 487.78 | 1409 | 1372 | 365.9 |
| D | 7 | 71 | 159232 | 431.38 | 1409 | 1372 | 365.9 |
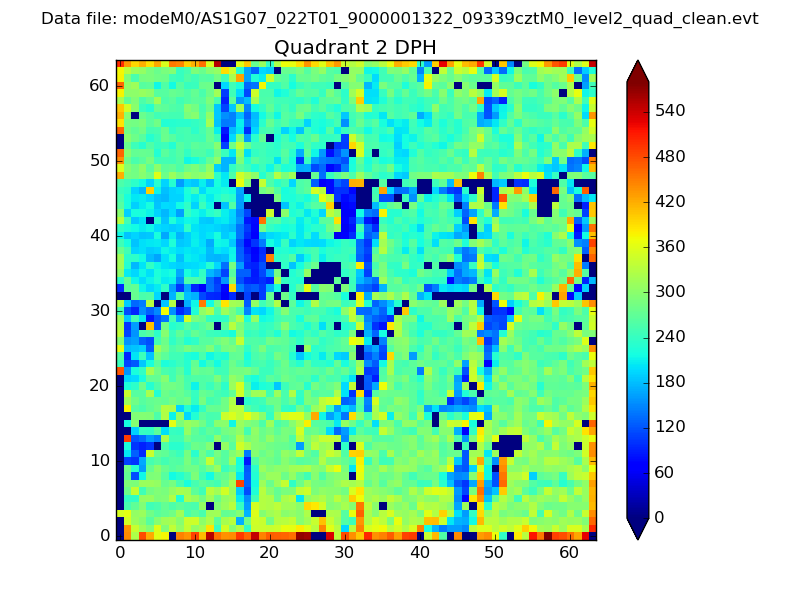
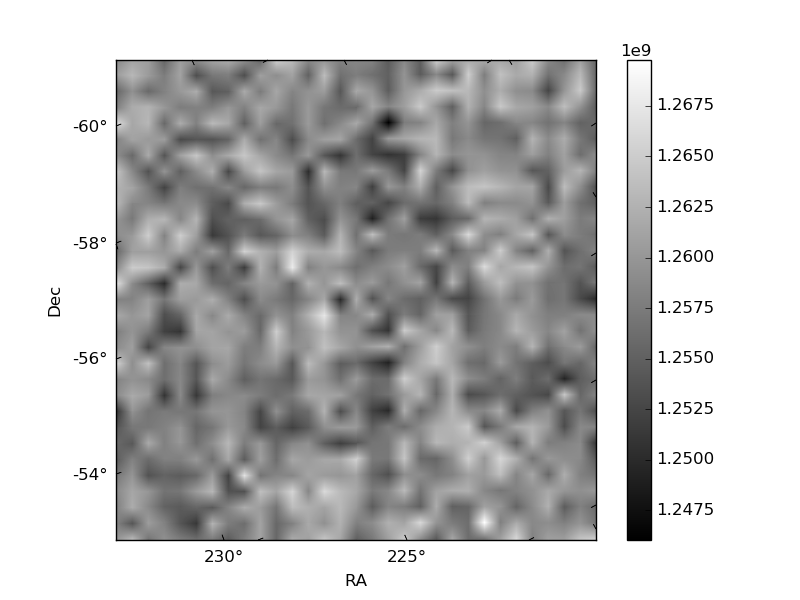
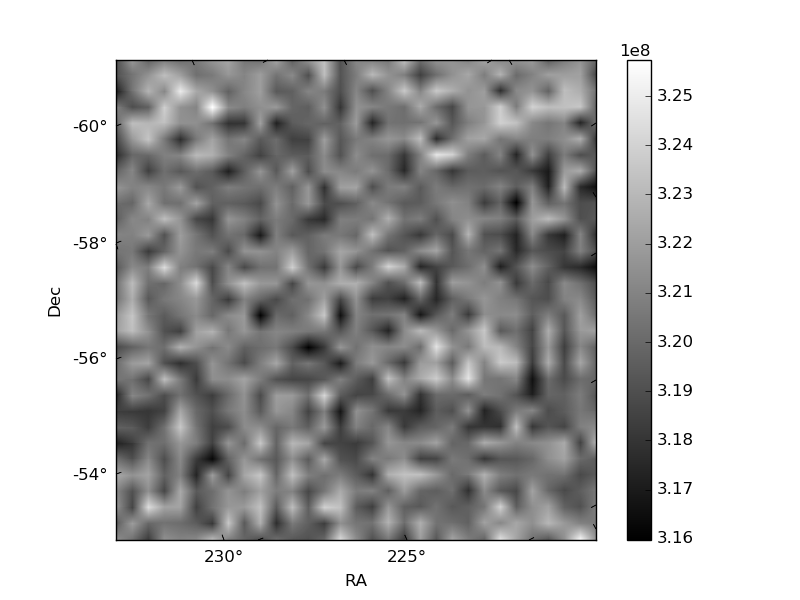
Histogram calculated using DETX and DETY for each event in the final _common_clean file
| Quadrant A | 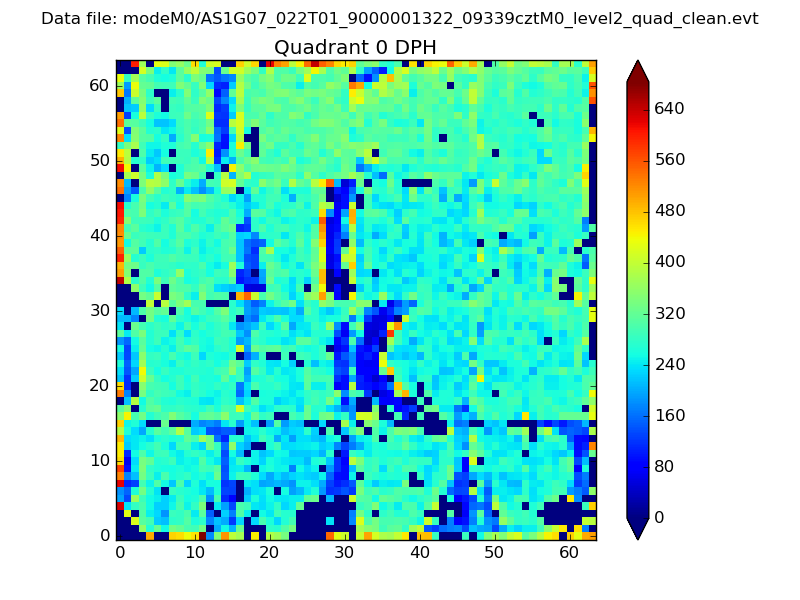 |
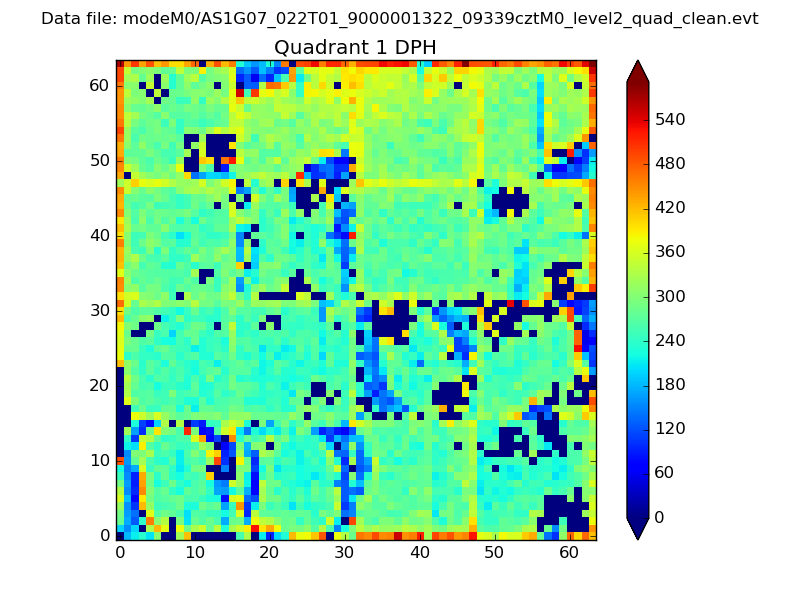 |
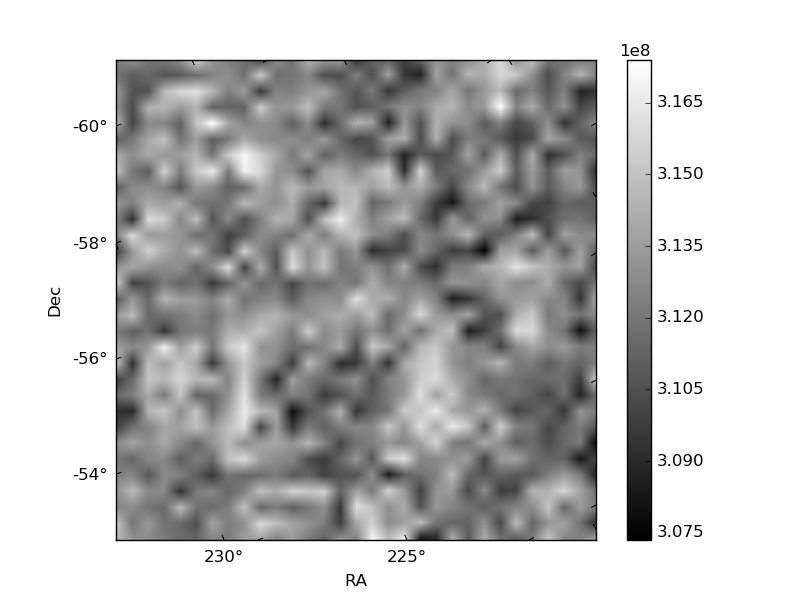
Quadrant B |
|---|---|---|---|
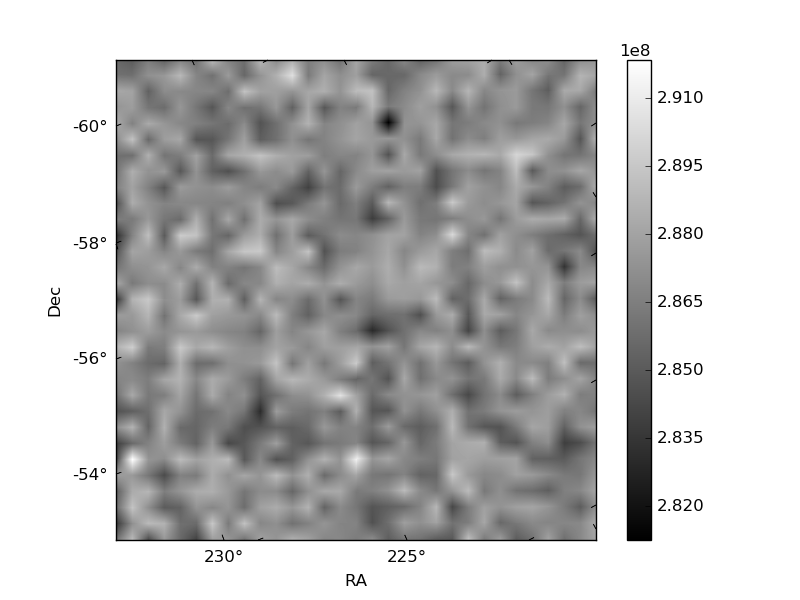
| Quadrant D | 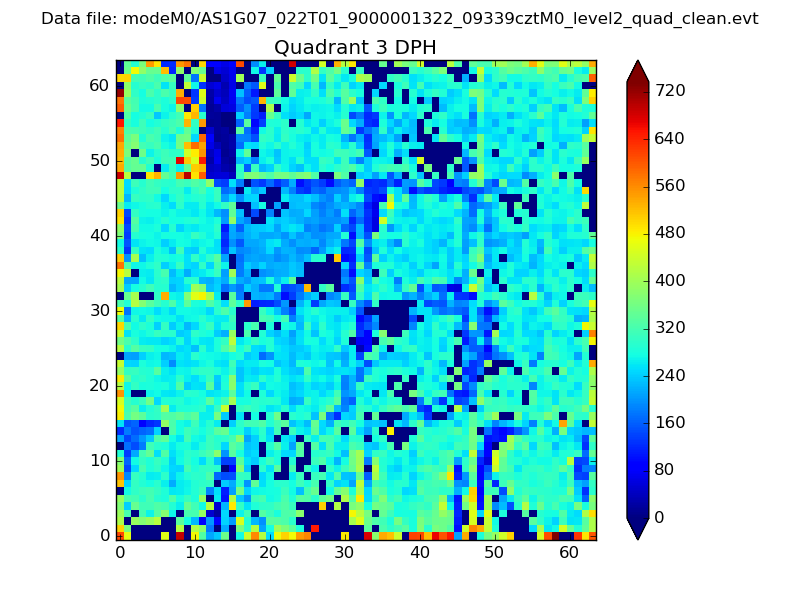 |
 |
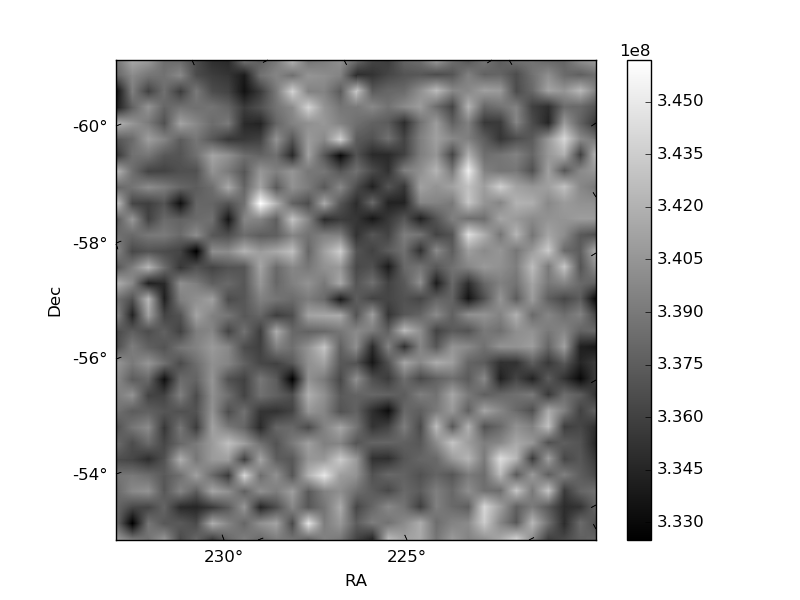
Quadrant C |
| Plot type | Count rate plots | Images |
|---|---|---|
| Comparison with Poisson distribution Blue bars denote a histogram of data divided into 1 sec bins. Red curve is a Poisson curve with rate = median count rate of data. |
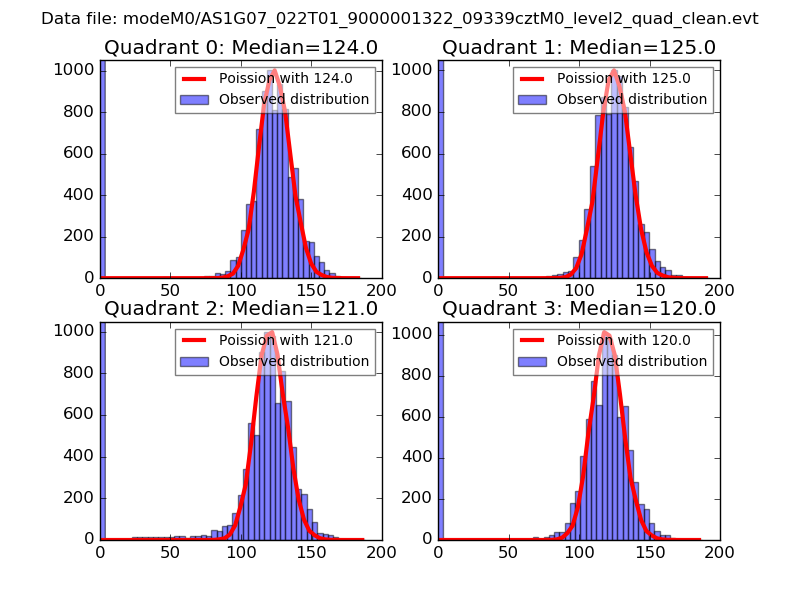 |
 |
| Quadrant-wise count rates Data is divided into 100 sec bins |
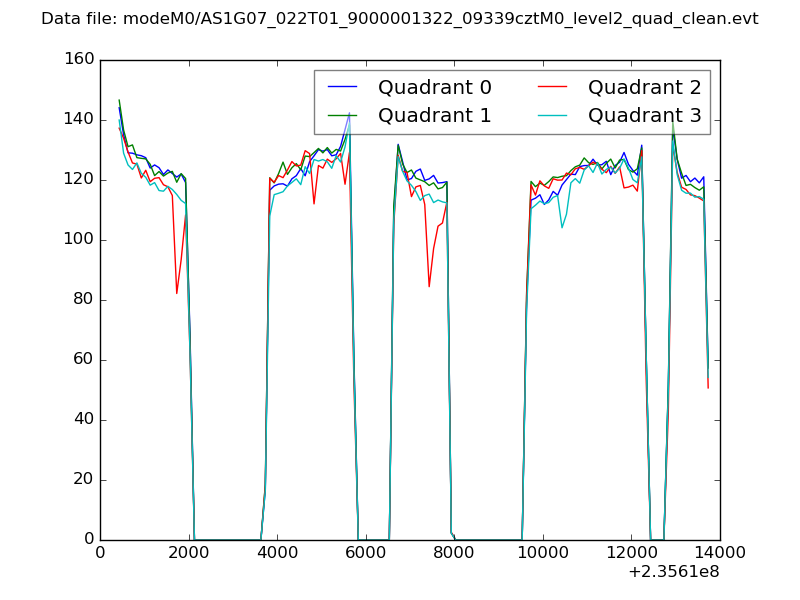 |
|
| Module-wise count rates for Quadrant A Data is divided into 100 sec bins |
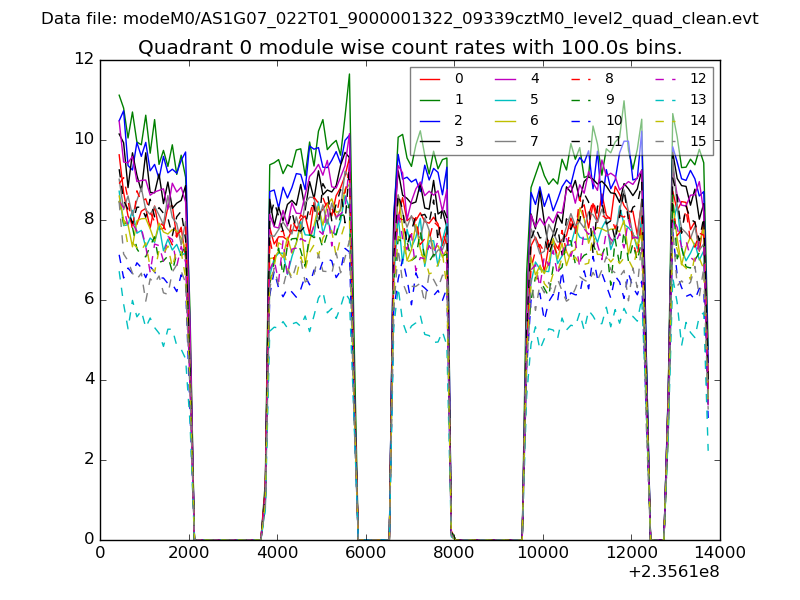 |
 |
| Module-wise count rates for Quadrant B Data is divided into 100 sec bins |
 |
 |
| Module-wise count rates for Quadrant C Data is divided into 100 sec bins |
 |
 |
| Module-wise count rates for Quadrant D Data is divided into 100 sec bins |
 |
 |
| Parameter | Plot |
|---|---|
| CZT HV Monitor | 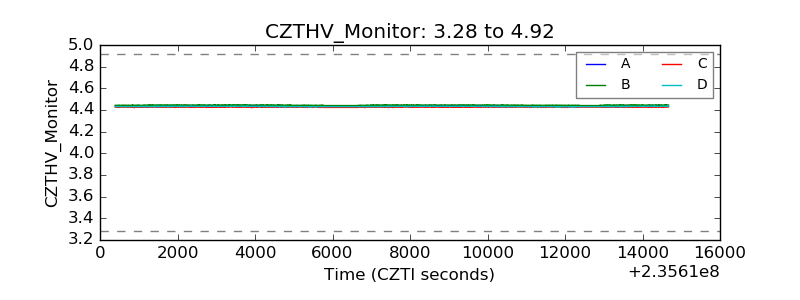 |
| D_VDD | 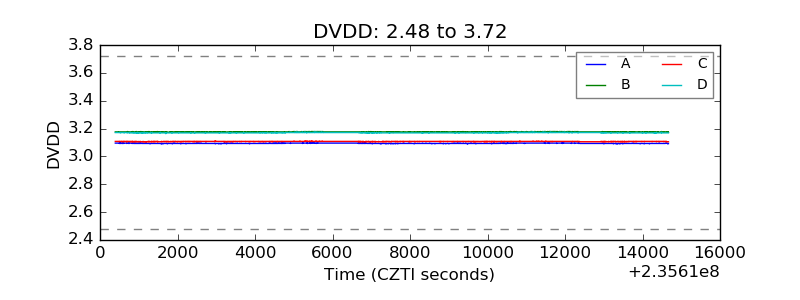 |
| Temperature 1 | 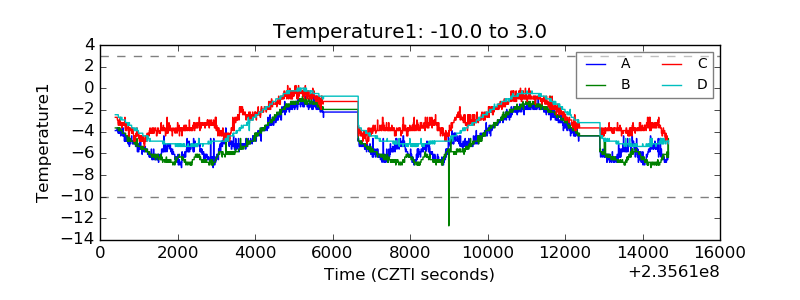 |
| Veto HV Monitor | 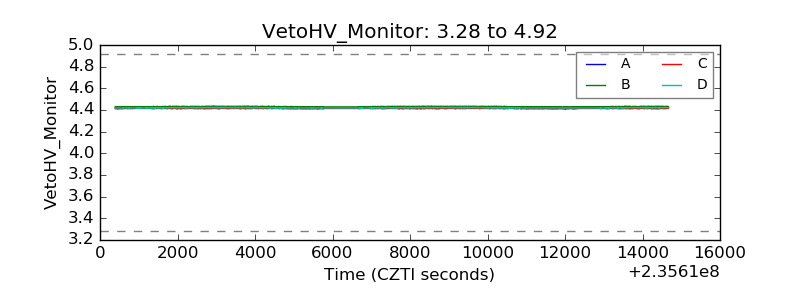 |
| Veto LLD | 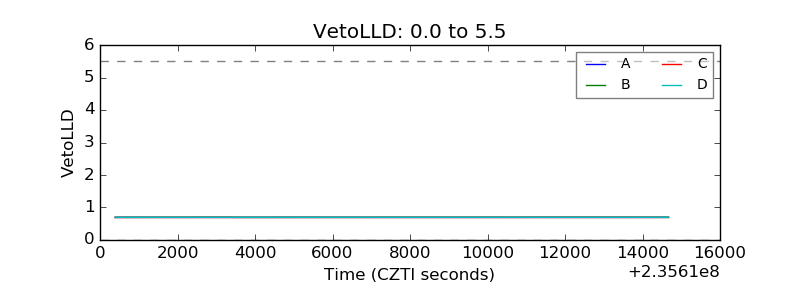 |
| Alpha Counter | 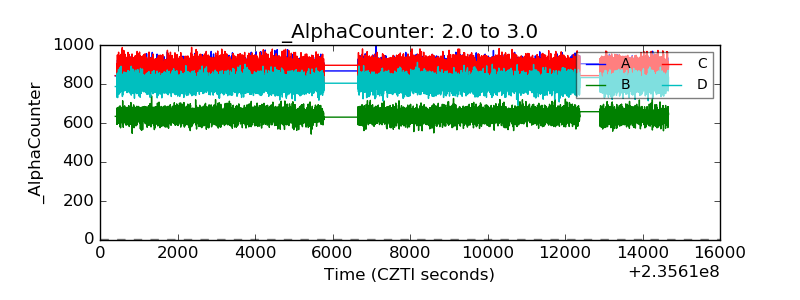 |
| _CPM_Rate | 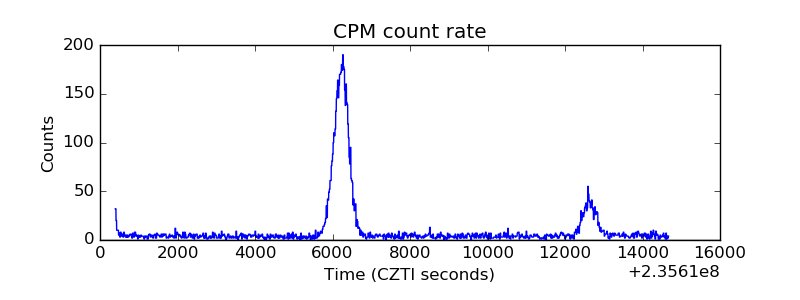 |
| CZT Counter | 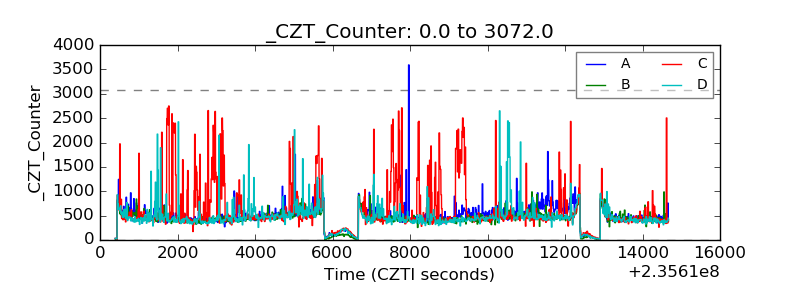 |
| +2.5 Volts monitor | 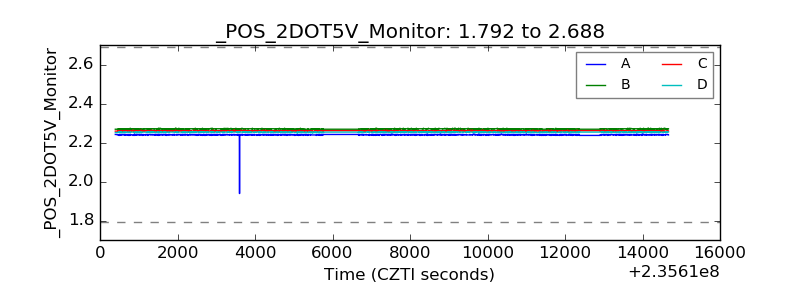 |
| +5 Volts monitor |  |
| _ROLL_ROT |  |
| _Roll_DEC |  |
| _Roll_RA | 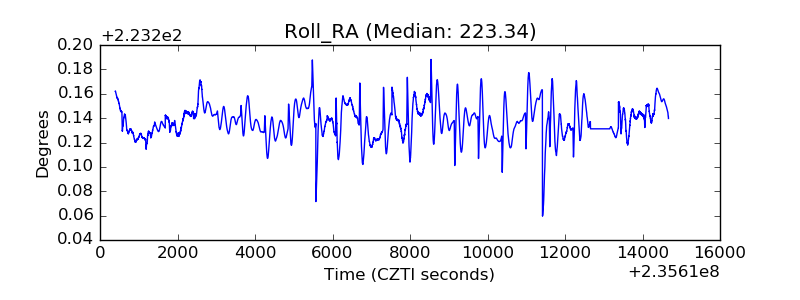 |
| Veto Counter | 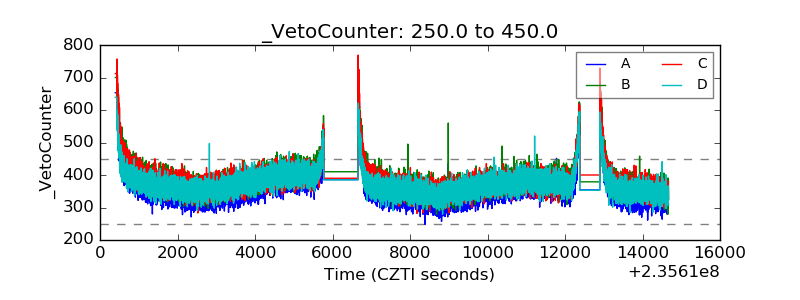 |