| Param | Original file | Final file |
|---|---|---|
| Filename | modeM0/AS1G07_022T01_9000001322_09340cztM0_level2.evt | modeM0/AS1G07_022T01_9000001322_09340cztM0_level2_quad_clean.evt |
| Size (bytes) | 619,223,040 | 108,953,280 |
| Size | 590.5 MB | 103.9 MB |
| Events in quadrant A | 5,030,871 | 687,369 |
| Events in quadrant B | 4,245,813 | 687,136 |
| Events in quadrant C | 4,742,733 | 664,950 |
| Events in quadrant D | 4,158,473 | 670,670 |
| Mode M0 | |||
|---|---|---|---|
| Quadrant | BADHDUFLAG | Total packets | Discarded packets |
| A | 0 | 20675 | 219 |
| B | 0 | 18608 | 221 |
| C | 0 | 20459 | 293 |
| D | 0 | 18748 | 152 |
| Mode SS | |||
|---|---|---|---|
| Quadrant | BADHDUFLAG | Total packets | Discarded packets |
| A | 0 | 174 | 0 |
| B | 0 | 174 | 6 |
| C | 0 | 174 | 4 |
| D | 0 | 174 | 2 |
| Mode M9 | |||
|---|---|---|---|
| Quadrant | BADHDUFLAG | Total packets | Discarded packets |
| A | 0 | 8 | 0 |
| B | 0 | 8 | 0 |
| C | 0 | 8 | 0 |
| D | 0 | 8 | 0 |
| Quadrant | Total seconds | Saturated seconds | Saturation percentage |
|---|---|---|---|
| A | 8488 | 207 | 2.438737% |
| B | 8488 | 198 | 2.332705% |
| C | 8480 | 360 | 4.245283% |
| D | 8507 | 186 | 2.186435% |
Noise dominated data is calculated using 1-second bins in cleaned event files. If a bin has >2000 counts, and if more than 50% of those come from <1% of pixels, then it is considered to be noise-dominated and hence unusable.
| Quadrant | # 1 sec bins | Bins with >0 counts | Bins with >2000 counts | High rate bins dominated by noise | Noise dominated (total time) | Noise dominated (detector-on time) | Marked lightcurve |
|---|---|---|---|---|---|---|---|
| A | 9371 | 8570 | 41 | 41 | 0.44% | 0.48% | 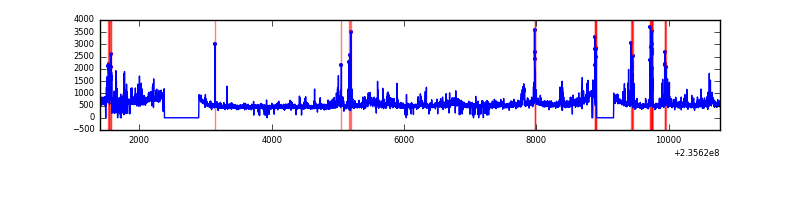 |
| B | 9371 | 8572 | 20 | 20 | 0.21% | 0.23% | 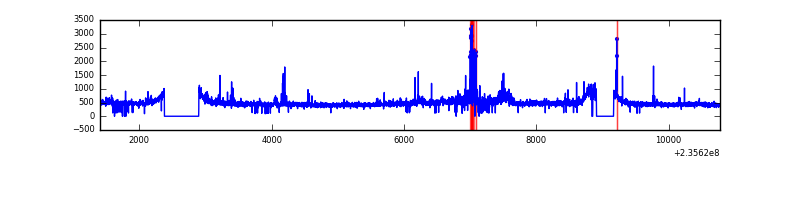 |
| C | 9371 | 8566 | 138 | 138 | 1.47% | 1.61% | 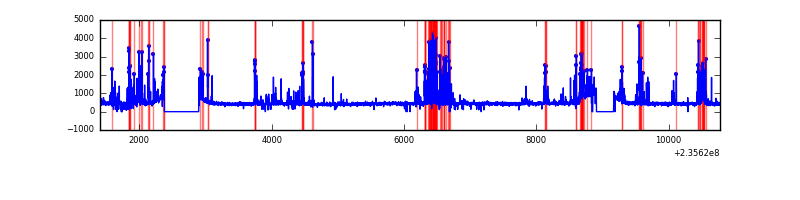 |
| D | 9371 | 8575 | 71 | 71 | 0.76% | 0.83% | 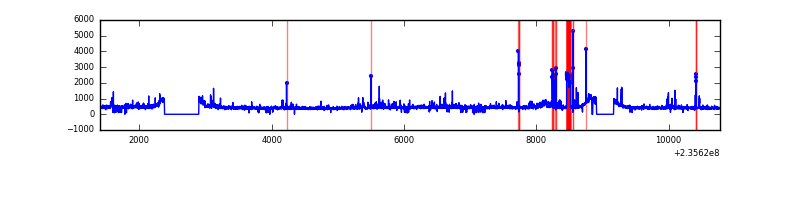 |
Top three noisy pixels from each quadrant. If the there are fewer than three noisy pixels in the level2.evt file, extra rows are filled as -1
| Pixel properties | Quadrant properties | ||||||
|---|---|---|---|---|---|---|---|
| Quadrant | DetID | PixID | Counts | Sigma | Mean | Median | Sigma |
| A | 8 | 5 | 952588 | 4729.27 | 988 | 965 | 201.2 |
| A | 13 | 251 | 94477 | 464.73 | 988 | 965 | 201.2 |
| A | 5 | 16 | 83436 | 409.86 | 988 | 965 | 201.2 |
| B | 10 | 245 | 124465 | 643.83 | 995 | 969 | 191.8 |
| B | 0 | 214 | 66318 | 340.69 | 995 | 969 | 191.8 |
| B | 0 | 230 | 66107 | 339.59 | 995 | 969 | 191.8 |
| C | 4 | 254 | 1000803 | 4552.04 | 949 | 950 | 219.6 |
| C | 10 | 22 | 17078 | 73.43 | 949 | 950 | 219.6 |
| C | 14 | 67 | 10029 | 41.33 | 949 | 950 | 219.6 |
| D | 7 | 71 | 203556 | 812.63 | 960 | 934 | 249.3 |
| D | 8 | 195 | 80851 | 320.51 | 960 | 934 | 249.3 |
| D | 1 | 52 | 74815 | 296.3 | 960 | 934 | 249.3 |
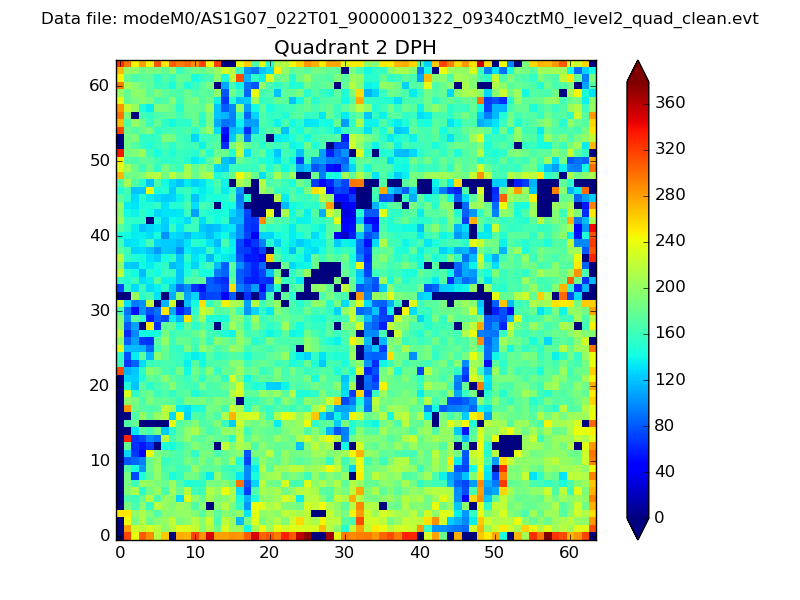
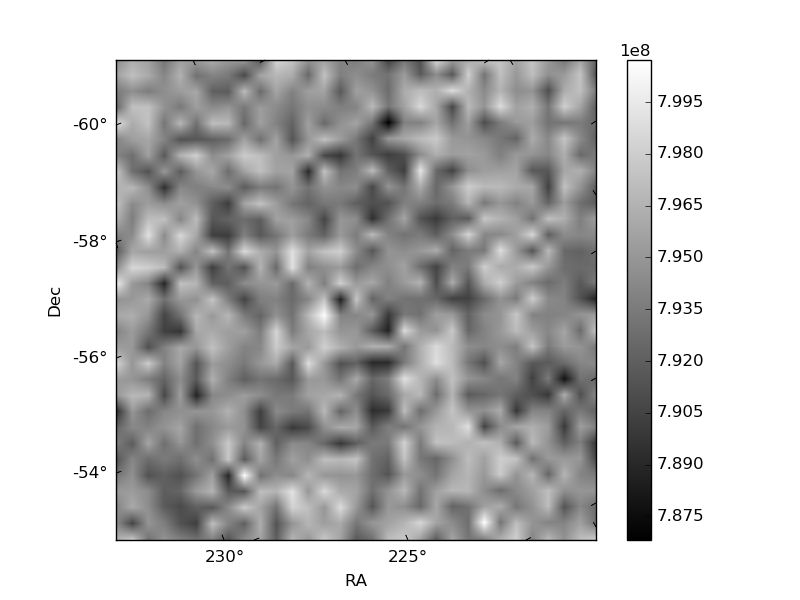
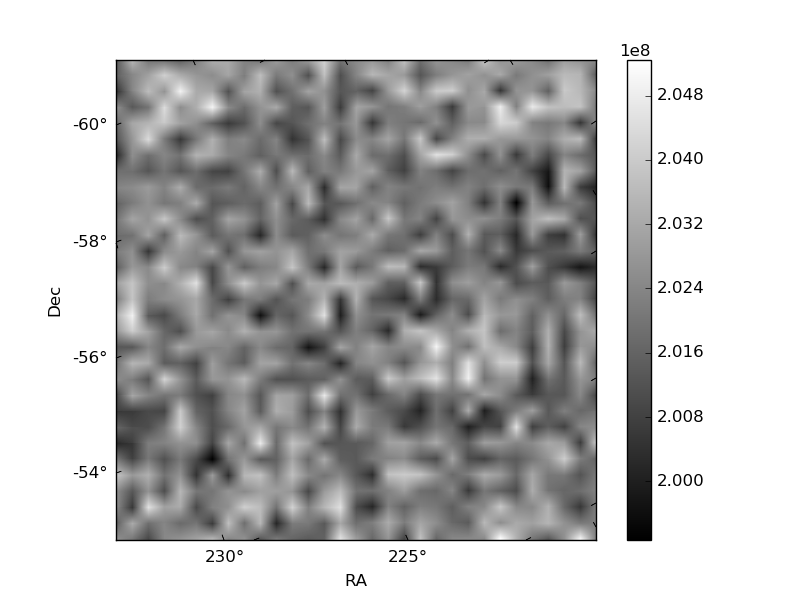
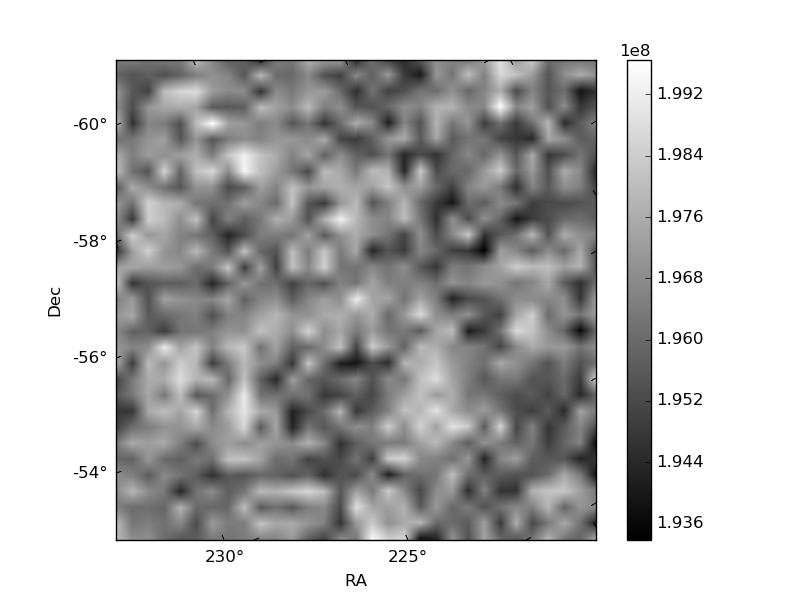
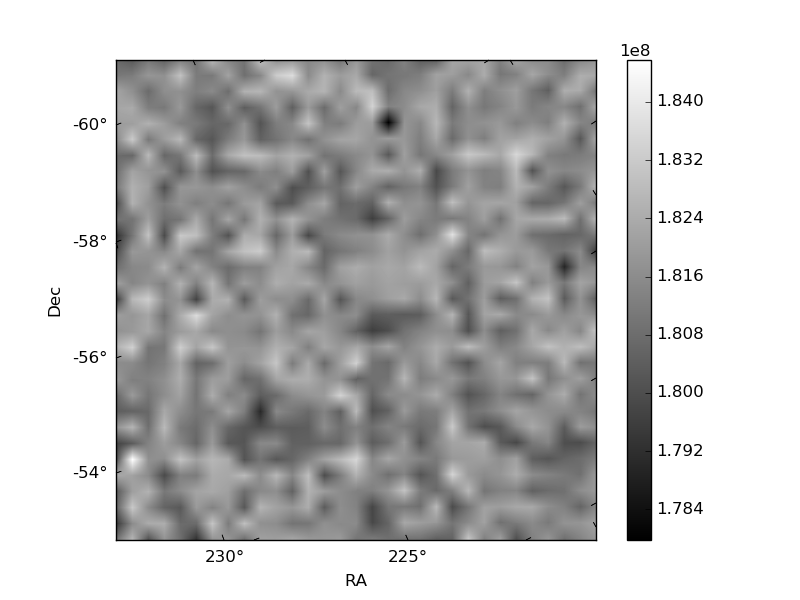
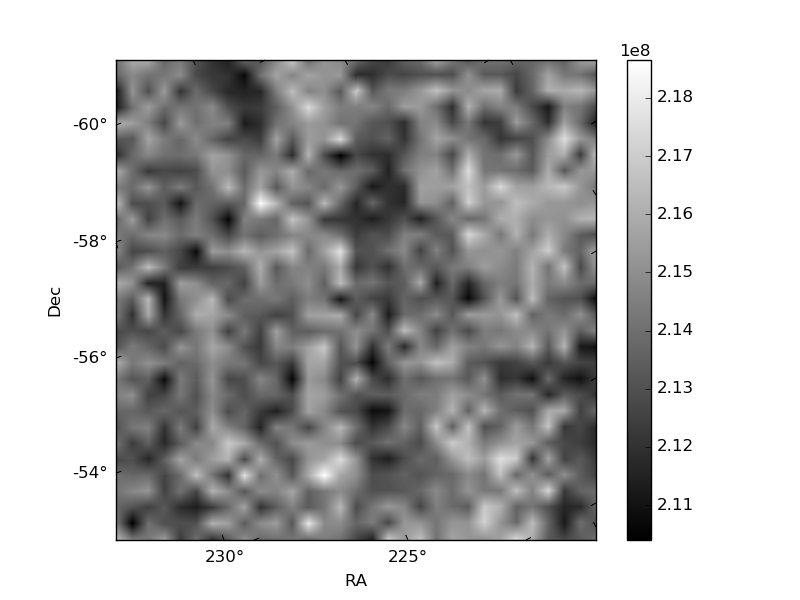
Histogram calculated using DETX and DETY for each event in the final _common_clean file
| Quadrant A | 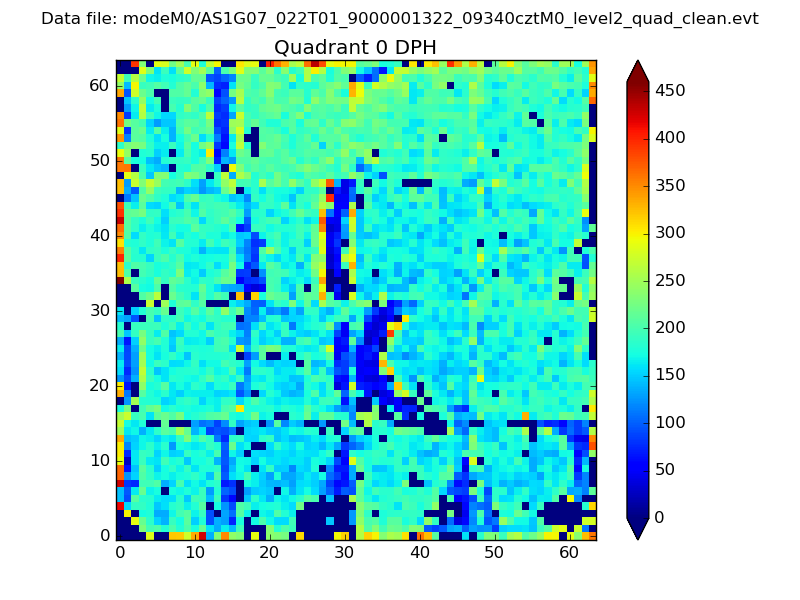 |
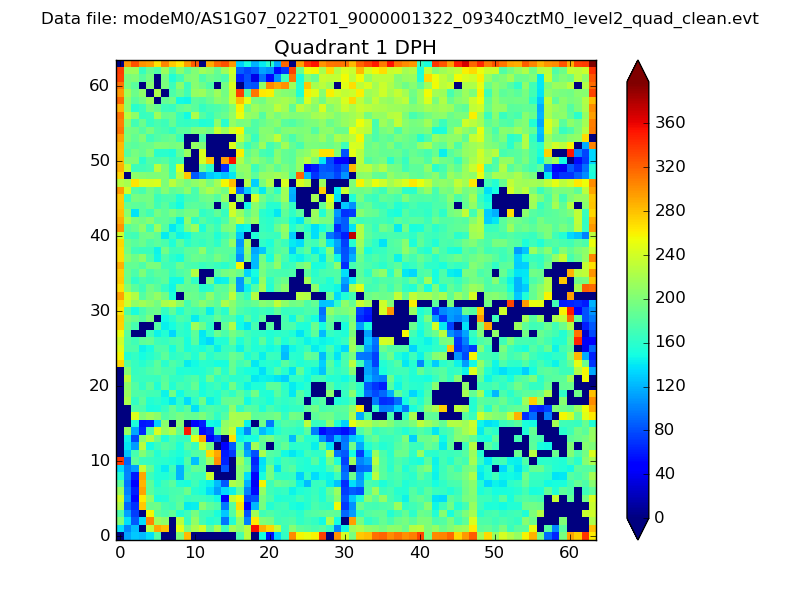 |
Quadrant B |
|---|---|---|---|
| Quadrant D | 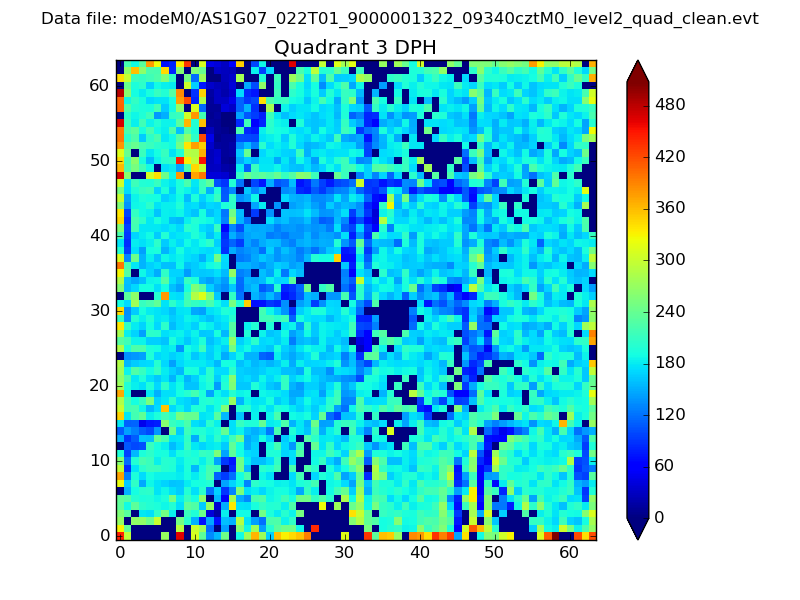 |
 |
Quadrant C |
| Plot type | Count rate plots | Images |
|---|---|---|
| Comparison with Poisson distribution Blue bars denote a histogram of data divided into 1 sec bins. Red curve is a Poisson curve with rate = median count rate of data. |
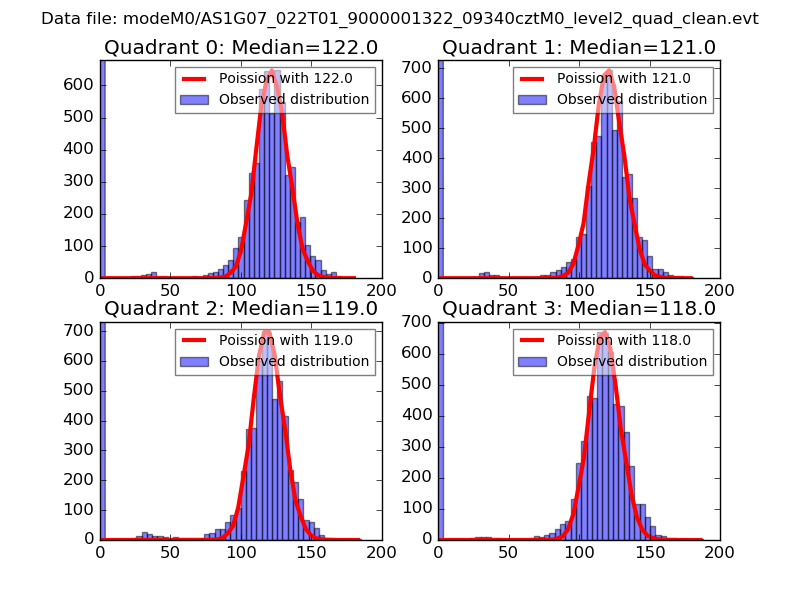 |
 |
| Quadrant-wise count rates Data is divided into 100 sec bins |
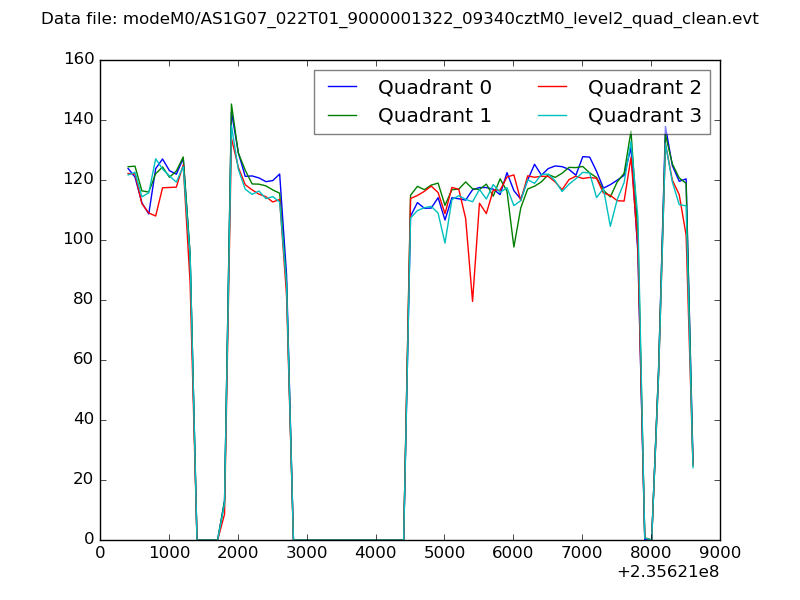 |
|
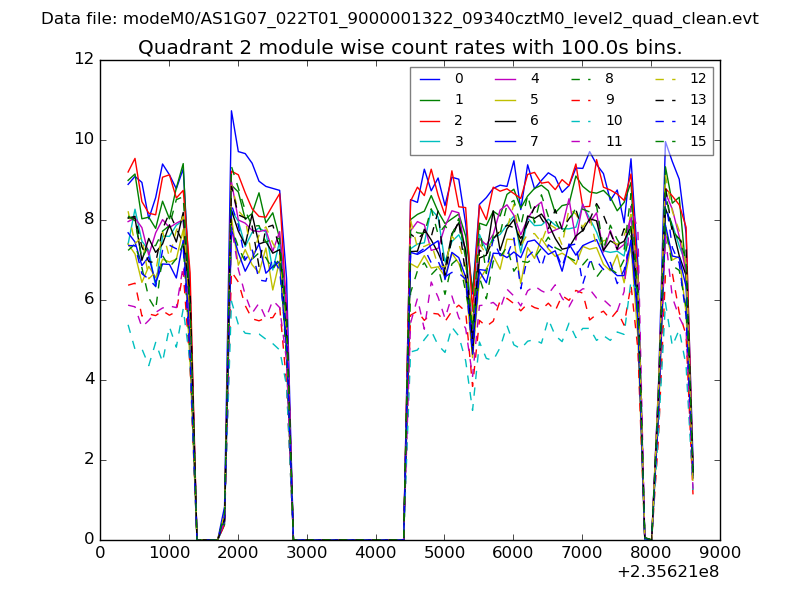
| Module-wise count rates for Quadrant A Data is divided into 100 sec bins |
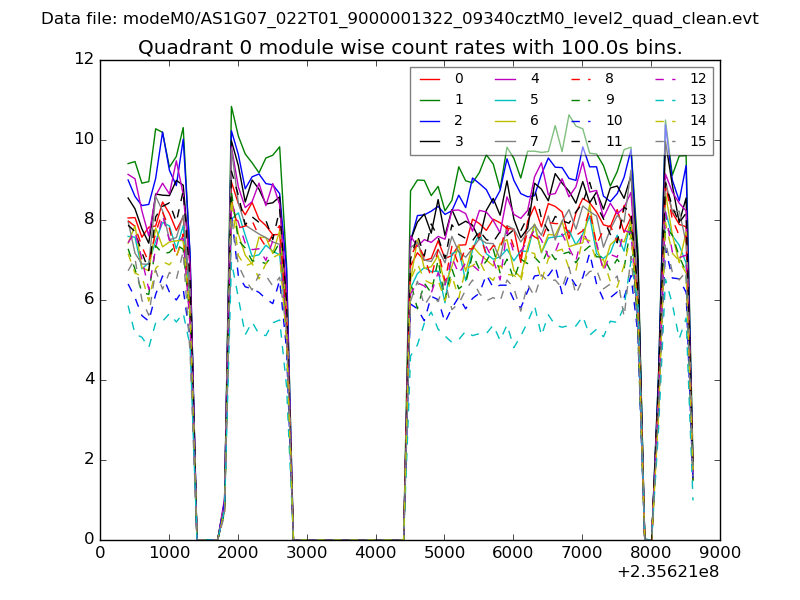 |
 |
| Module-wise count rates for Quadrant B Data is divided into 100 sec bins |
 |
 |
| Module-wise count rates for Quadrant C Data is divided into 100 sec bins |
 |
 |
| Module-wise count rates for Quadrant D Data is divided into 100 sec bins |
 |
 |
| Parameter | Plot |
|---|---|
| CZT HV Monitor | 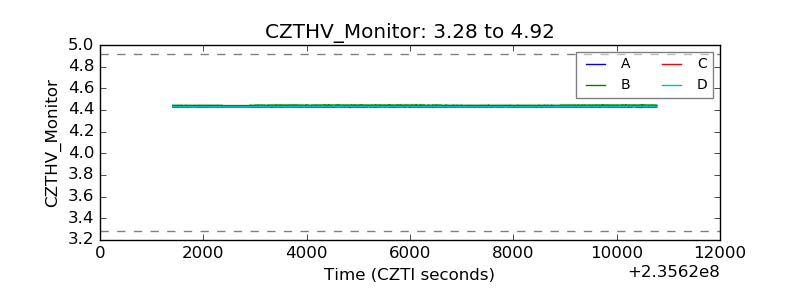 |
| D_VDD | 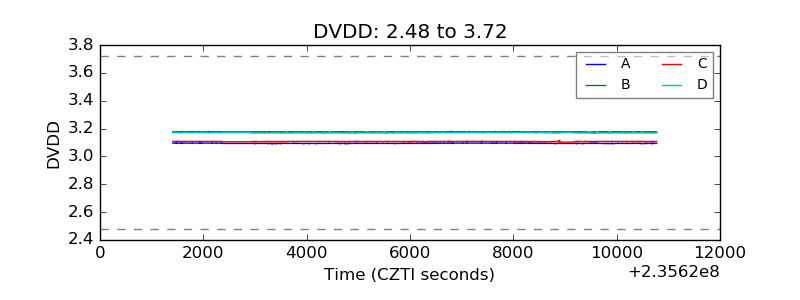 |
| Temperature 1 | 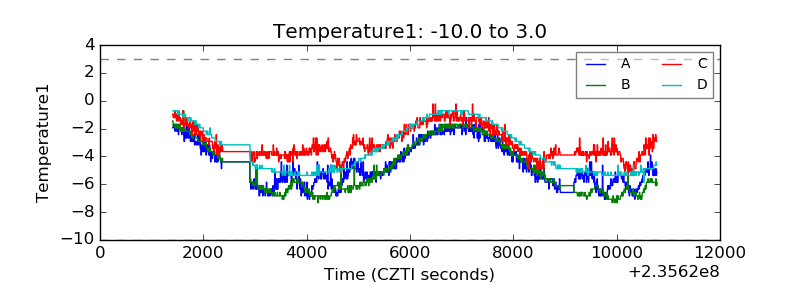 |
| Veto HV Monitor | 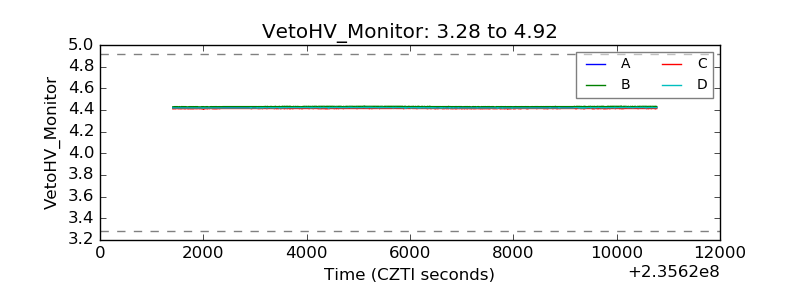 |
| Veto LLD | 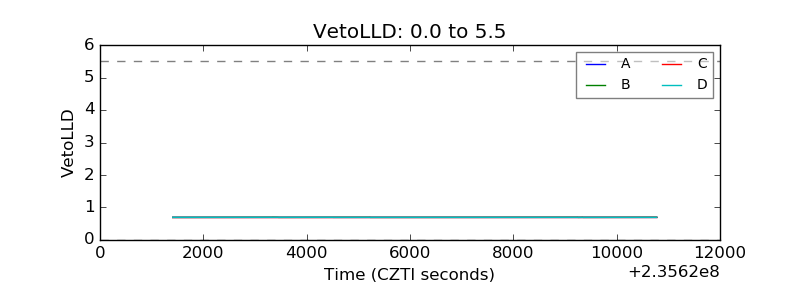 |
| Alpha Counter | 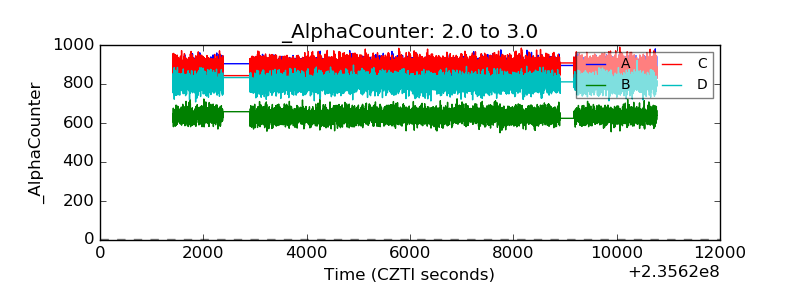 |
| _CPM_Rate | 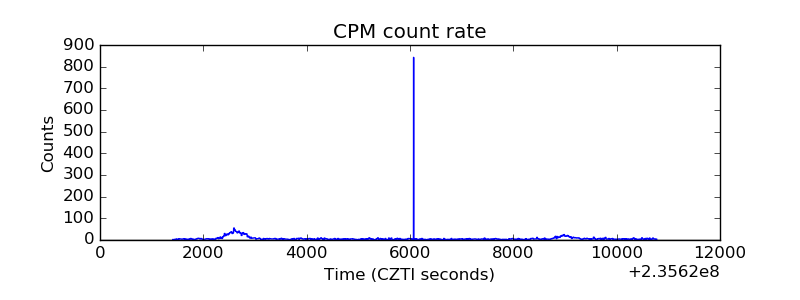 |
| CZT Counter | 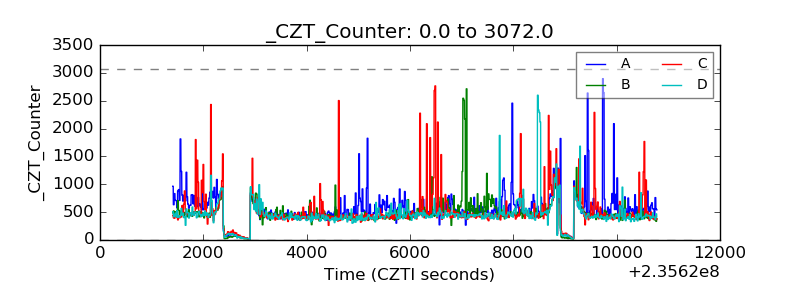 |
| +2.5 Volts monitor |  |
| +5 Volts monitor |  |
| _ROLL_ROT | 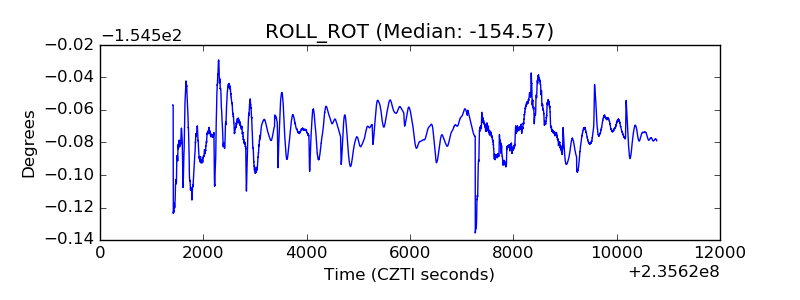 |
| _Roll_DEC | 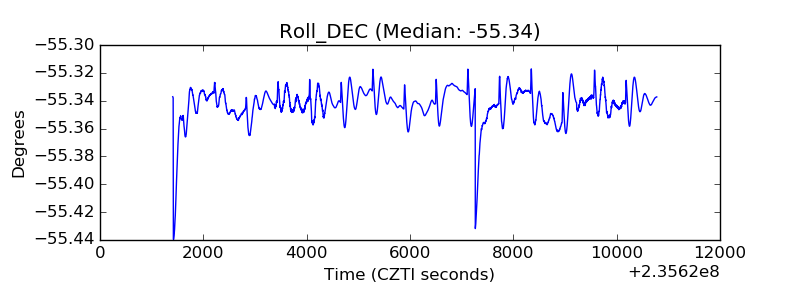 |
| _Roll_RA | 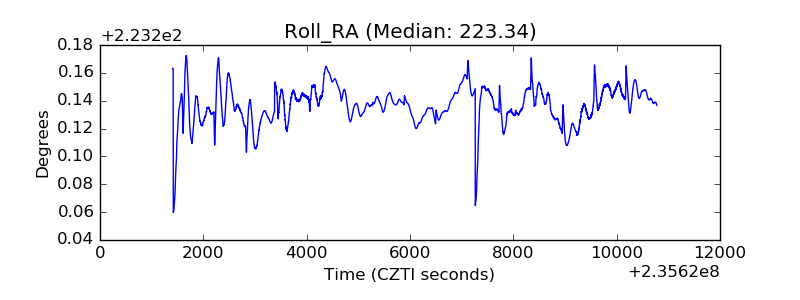 |
| Veto Counter | 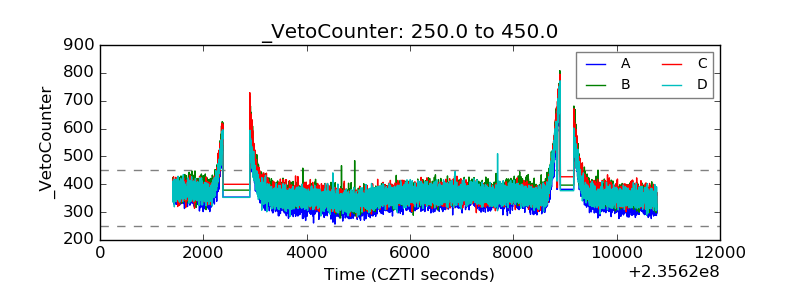 |