| Param | Original file | Final file |
|---|---|---|
| Filename | modeM0/AS1G07_022T01_9000001322_09341cztM0_level2.evt | modeM0/AS1G07_022T01_9000001322_09341cztM0_level2_quad_clean.evt |
| Size (bytes) | 356,823,360 | 53,196,480 |
| Size | 340.3 MB | 50.7 MB |
| Events in quadrant A | 2,754,626 | 317,772 |
| Events in quadrant B | 2,339,952 | 340,711 |
| Events in quadrant C | 2,846,480 | 311,043 |
| Events in quadrant D | 2,554,717 | 321,203 |
| Mode M0 | |||
|---|---|---|---|
| Quadrant | BADHDUFLAG | Total packets | Discarded packets |
| A | 0 | 21156 | 10177 |
| B | 0 | 17738 | 7765 |
| C | 0 | 22805 | 11298 |
| D | 0 | 19787 | 8987 |
| Mode SS | |||
|---|---|---|---|
| Quadrant | BADHDUFLAG | Total packets | Discarded packets |
| A | 0 | 174 | 68 |
| B | 0 | 172 | 78 |
| C | 0 | 175 | 65 |
| D | 0 | 175 | 77 |
| Mode M9 | |||
|---|---|---|---|
| Quadrant | BADHDUFLAG | Total packets | Discarded packets |
| A | 0 | 5 | 0 |
| B | 0 | 5 | 0 |
| C | 0 | 5 | 0 |
| D | 0 | 5 | 0 |
| Quadrant | Total seconds | Saturated seconds | Saturation percentage |
|---|---|---|---|
| A | 4408 | 193 | 4.378403% |
| B | 4642 | 197 | 4.243860% |
| C | 4365 | 433 | 9.919817% |
| D | 4563 | 200 | 4.383081% |
Noise dominated data is calculated using 1-second bins in cleaned event files. If a bin has >2000 counts, and if more than 50% of those come from <1% of pixels, then it is considered to be noise-dominated and hence unusable.
| Quadrant | # 1 sec bins | Bins with >0 counts | Bins with >2000 counts | High rate bins dominated by noise | Noise dominated (total time) | Noise dominated (detector-on time) | Marked lightcurve |
|---|---|---|---|---|---|---|---|
| A | 9047 | 5485 | 23 | 23 | 0.25% | 0.42% | 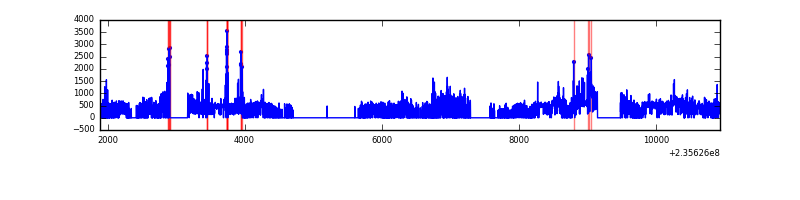 |
| B | 9044 | 5712 | 2 | 2 | 0.02% | 0.04% | 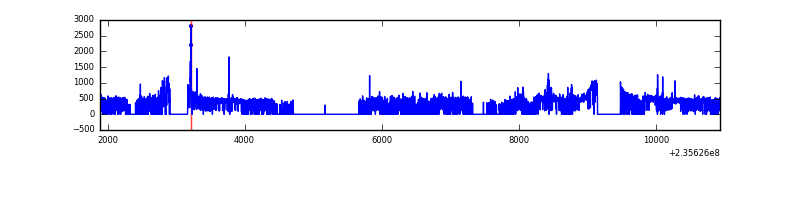 |
| C | 9045 | 5454 | 130 | 130 | 1.44% | 2.38% | 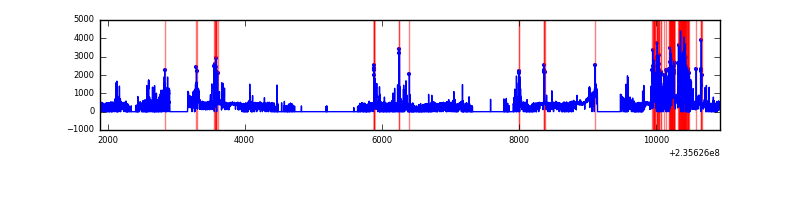 |
| D | 9045 | 5665 | 20 | 20 | 0.22% | 0.35% | 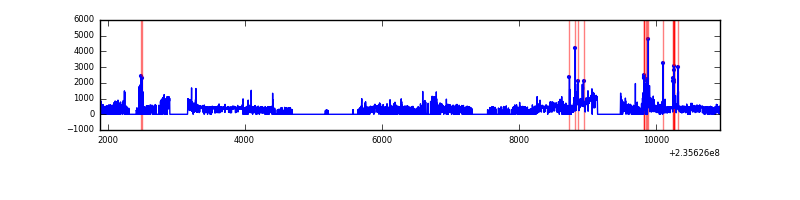 |
Top three noisy pixels from each quadrant. If the there are fewer than three noisy pixels in the level2.evt file, extra rows are filled as -1
| Pixel properties | Quadrant properties | ||||||
|---|---|---|---|---|---|---|---|
| Quadrant | DetID | PixID | Counts | Sigma | Mean | Median | Sigma |
| A | 8 | 5 | 568529 | 5180.19 | 528 | 516 | 109.7 |
| A | 5 | 16 | 66086 | 597.99 | 528 | 516 | 109.7 |
| A | 13 | 251 | 28487 | 255.09 | 528 | 516 | 109.7 |
| B | 0 | 214 | 36971 | 329.84 | 564 | 549 | 110.4 |
| B | 0 | 219 | 32402 | 288.46 | 564 | 549 | 110.4 |
| B | 10 | 245 | 18676 | 164.16 | 564 | 549 | 110.4 |
| C | 4 | 254 | 870129 | 7365.56 | 499 | 500 | 118.1 |
| C | 10 | 22 | 10912 | 88.19 | 499 | 500 | 118.1 |
| C | 4 | 238 | 7420 | 58.61 | 499 | 500 | 118.1 |
| D | 8 | 195 | 174659 | 1214.36 | 533 | 519 | 143.4 |
| D | 1 | 52 | 162090 | 1126.71 | 533 | 519 | 143.4 |
| D | 7 | 71 | 63089 | 436.33 | 533 | 519 | 143.4 |
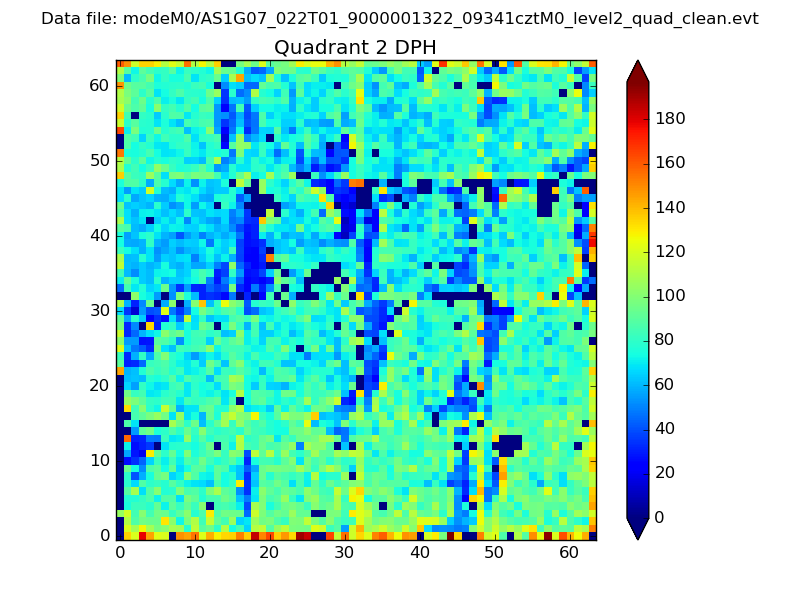
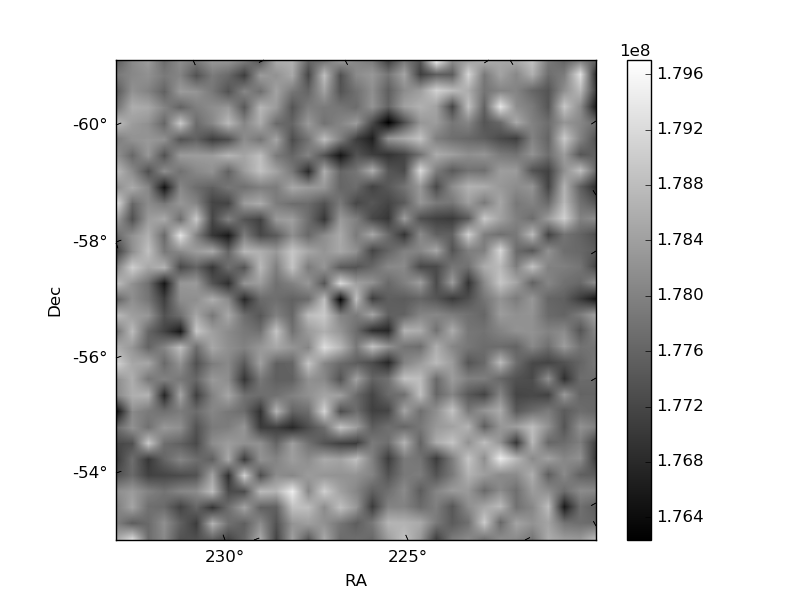
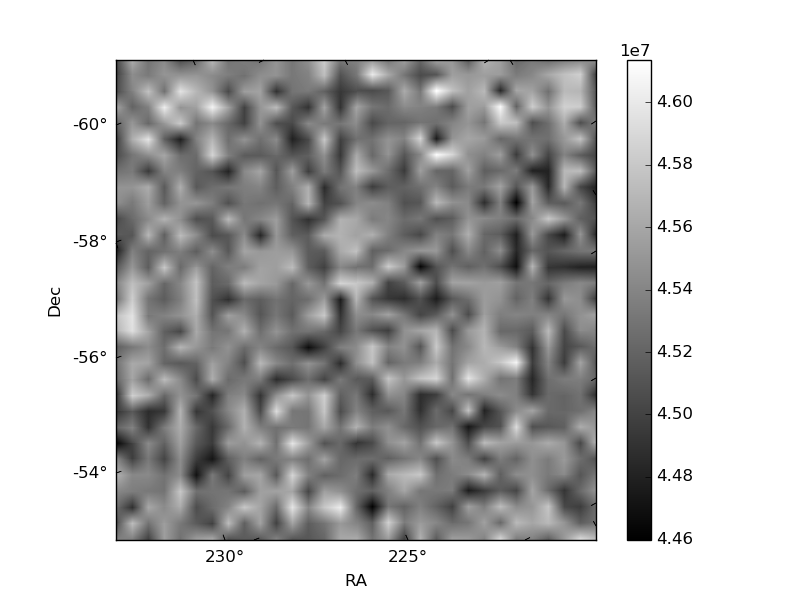
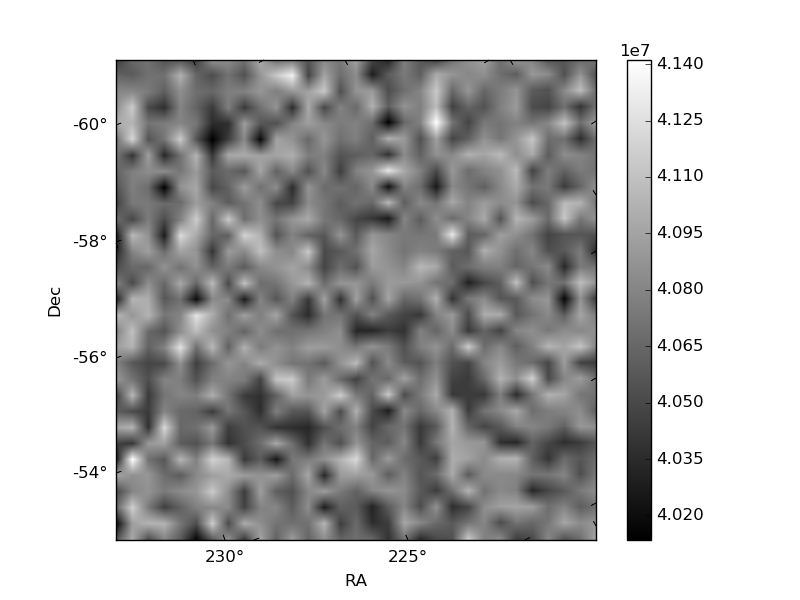
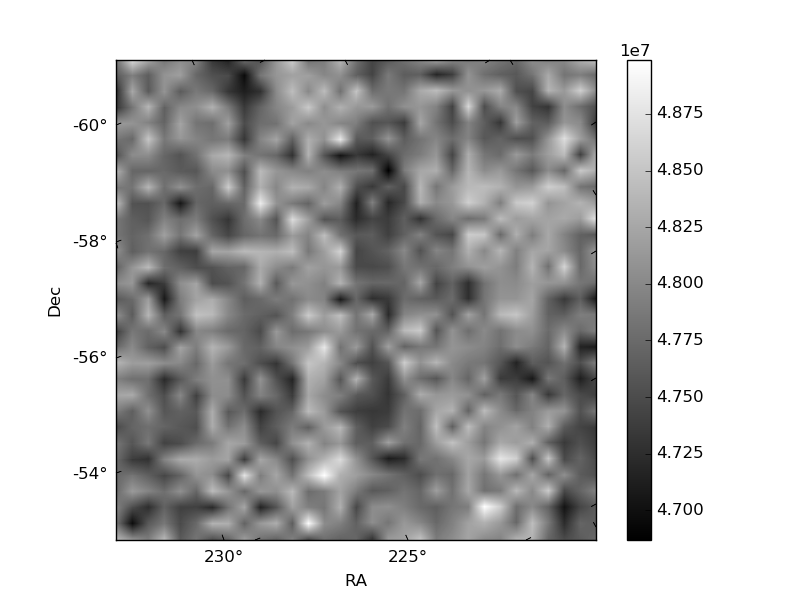
Histogram calculated using DETX and DETY for each event in the final _common_clean file
| Quadrant A | 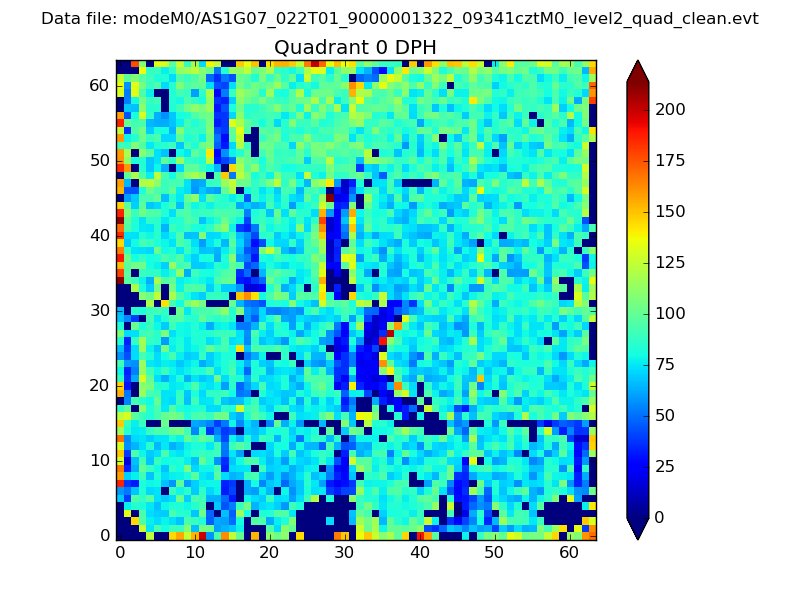 |
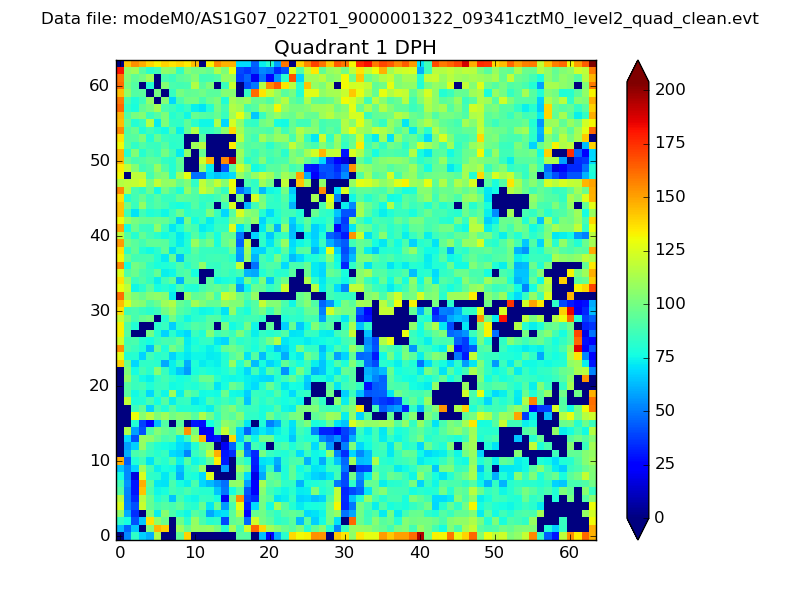 |
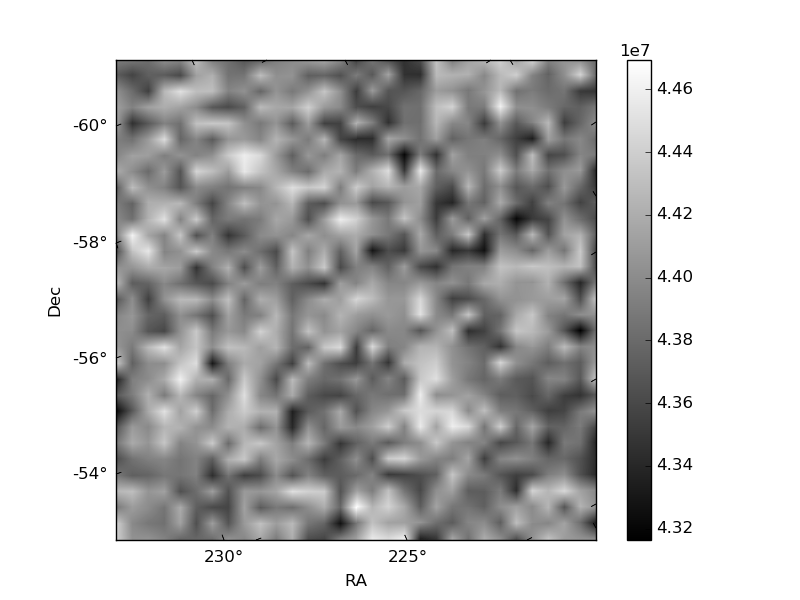
Quadrant B |
|---|---|---|---|
| Quadrant D | 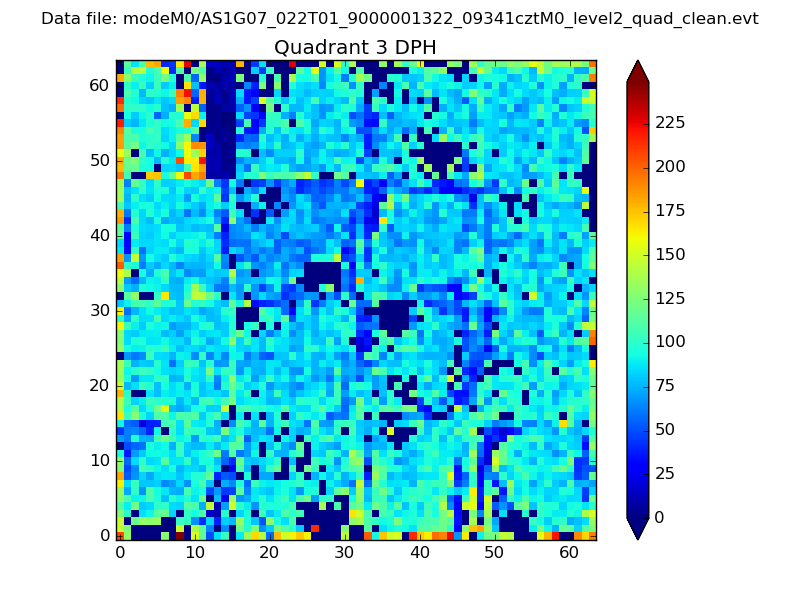 |
 |
Quadrant C |
| Plot type | Count rate plots | Images |
|---|---|---|
| Comparison with Poisson distribution Blue bars denote a histogram of data divided into 1 sec bins. Red curve is a Poisson curve with rate = median count rate of data. |
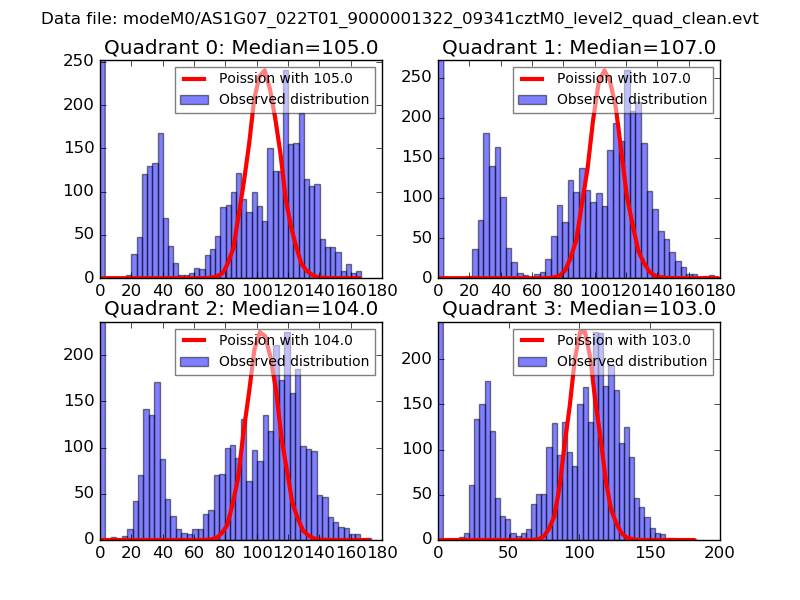 |
 |
| Quadrant-wise count rates Data is divided into 100 sec bins |
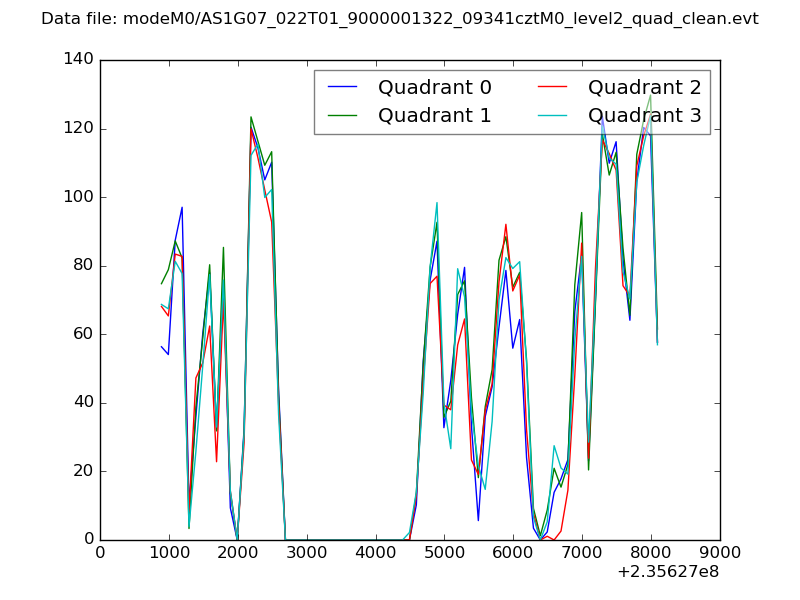 |
|
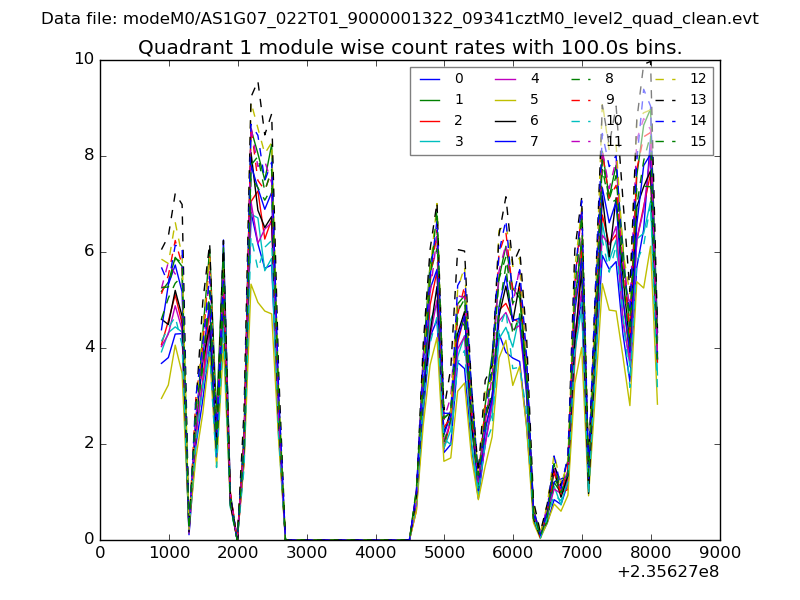
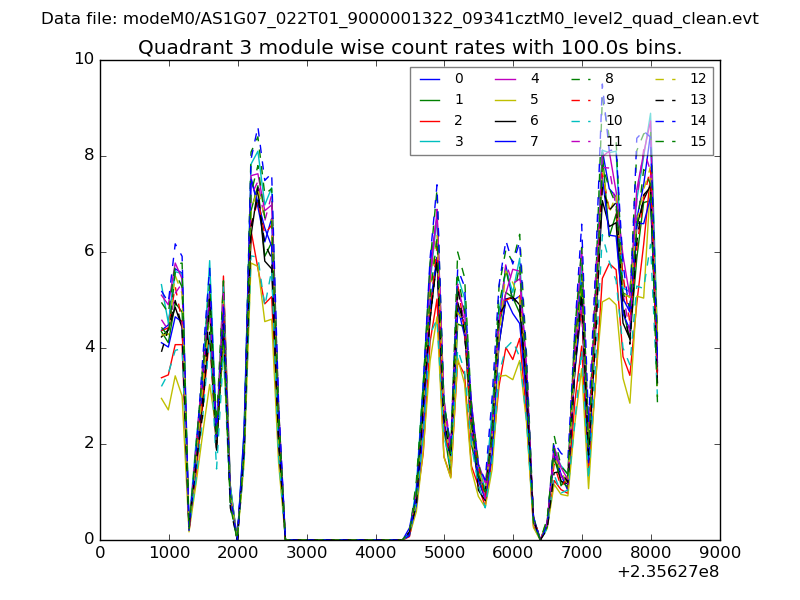
| Module-wise count rates for Quadrant A Data is divided into 100 sec bins |
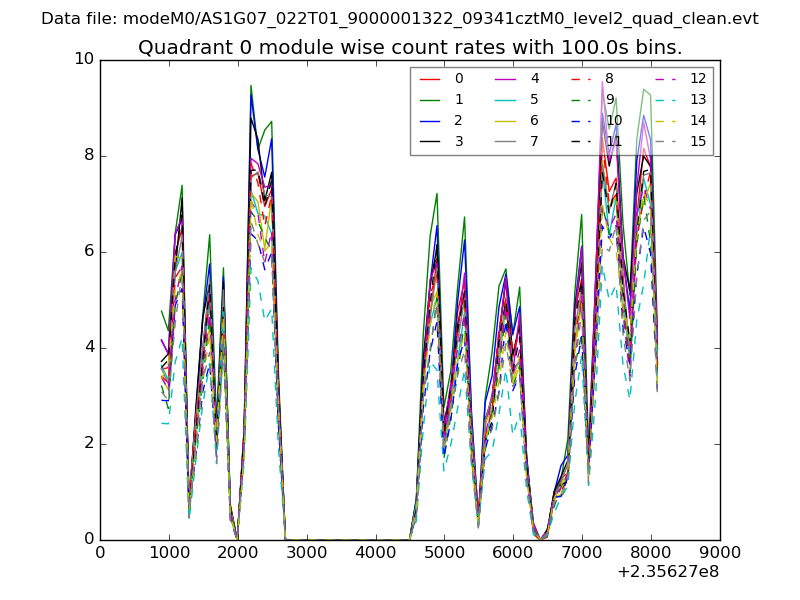 |
 |
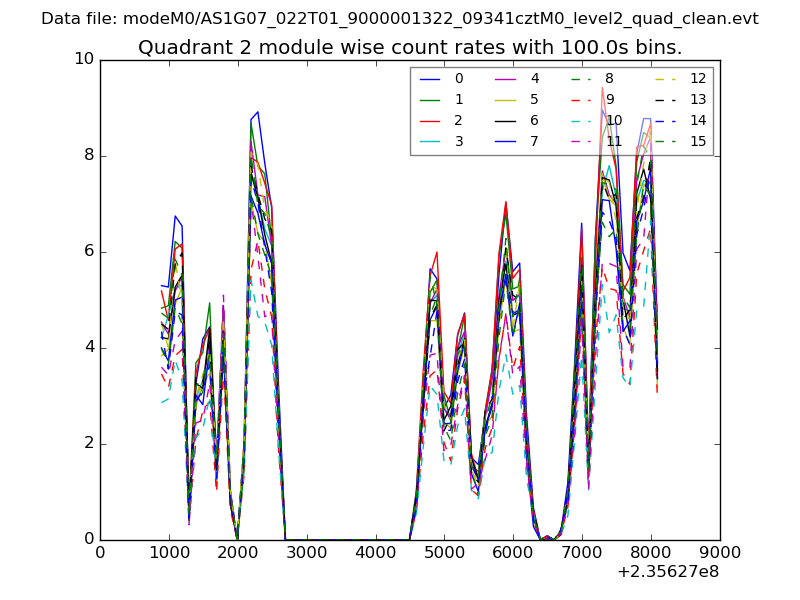
| Module-wise count rates for Quadrant B Data is divided into 100 sec bins |
 |
 |
| Module-wise count rates for Quadrant C Data is divided into 100 sec bins |
 |
 |
| Module-wise count rates for Quadrant D Data is divided into 100 sec bins |
 |
 |
| Parameter | Plot |
|---|---|
| CZT HV Monitor | 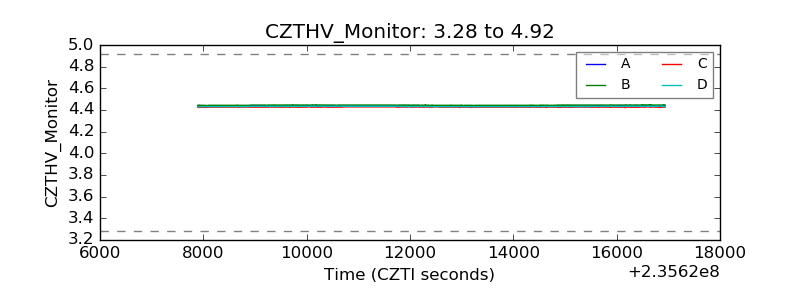 |
| D_VDD | 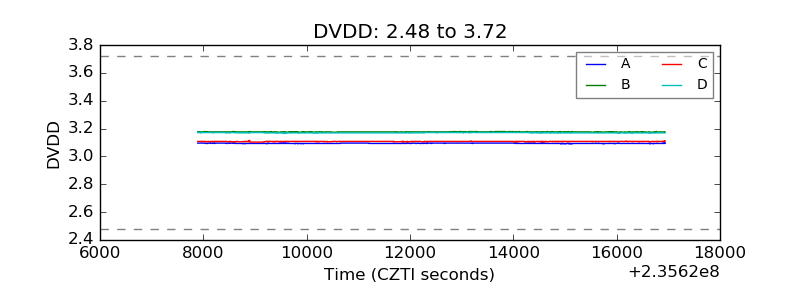 |
| Temperature 1 | 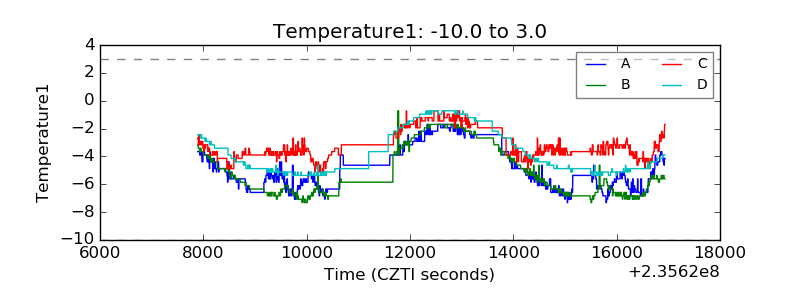 |
| Veto HV Monitor | 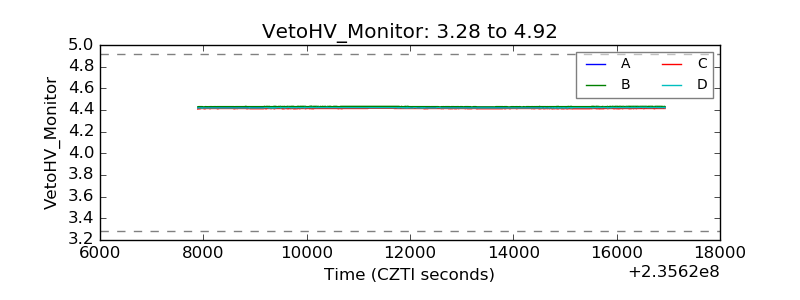 |
| Veto LLD | 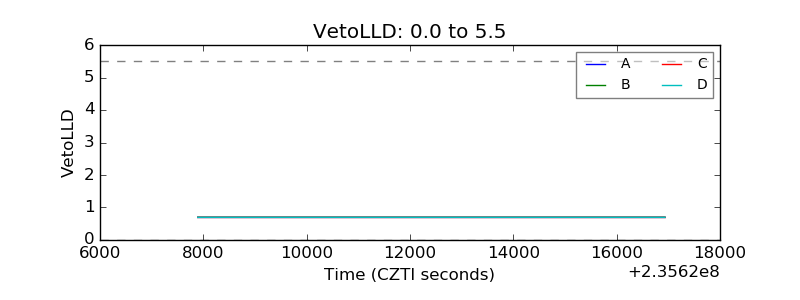 |
| Alpha Counter | 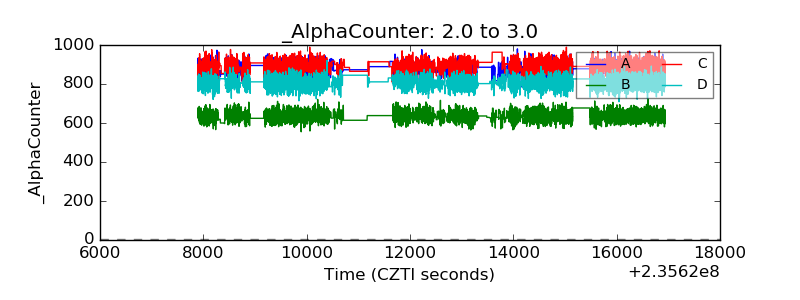 |
| _CPM_Rate | 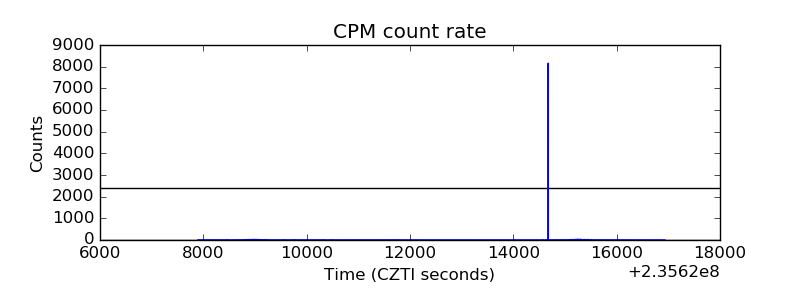 |
| CZT Counter | 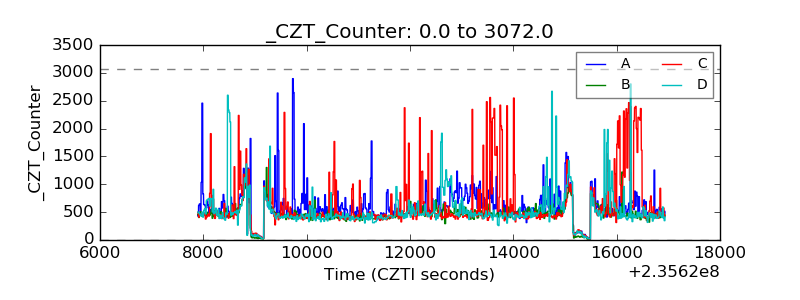 |
| +2.5 Volts monitor |  |
| +5 Volts monitor |  |
| _ROLL_ROT | 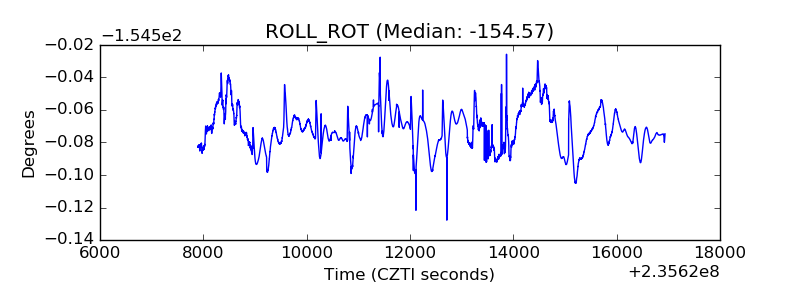 |
| _Roll_DEC | 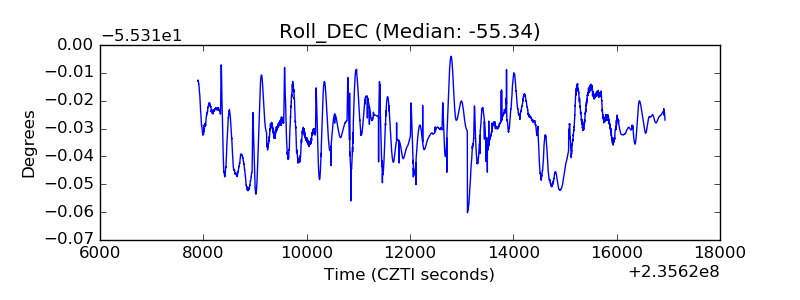 |
| _Roll_RA | 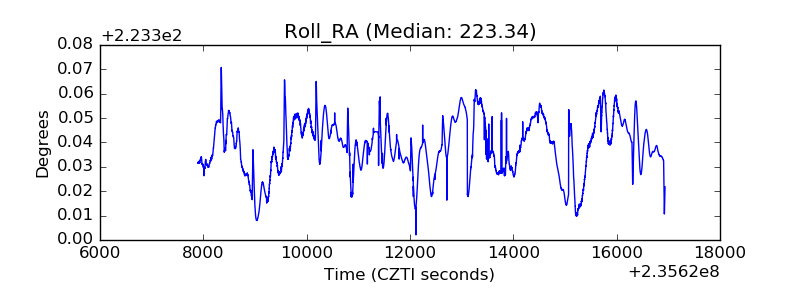 |
| Veto Counter | 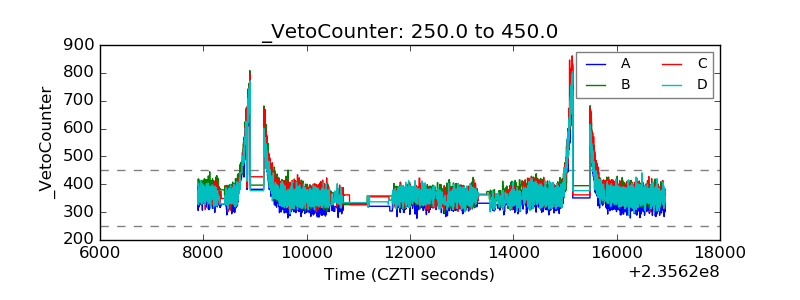 |