| Param | Original file | Final file |
|---|---|---|
| Filename | modeM0/AS1G07_022T01_9000001322_09345cztM0_level2.evt | modeM0/AS1G07_022T01_9000001322_09345cztM0_level2_quad_clean.evt |
| Size (bytes) | 436,921,920 | 68,420,160 |
| Size | 416.7 MB | 65.3 MB |
| Events in quadrant A | 3,563,550 | 420,077 |
| Events in quadrant B | 2,787,469 | 425,936 |
| Events in quadrant C | 3,404,373 | 408,174 |
| Events in quadrant D | 3,086,365 | 416,312 |
| Mode M0 | |||
|---|---|---|---|
| Quadrant | BADHDUFLAG | Total packets | Discarded packets |
| A | 0 | 16497 | 2235 |
| B | 0 | 14148 | 2059 |
| C | 0 | 17058 | 2890 |
| D | 0 | 15648 | 2335 |
| Mode SS | |||
|---|---|---|---|
| Quadrant | BADHDUFLAG | Total packets | Discarded packets |
| A | 0 | 136 | 16 |
| B | 0 | 139 | 15 |
| C | 0 | 138 | 18 |
| D | 0 | 138 | 22 |
| Mode M9 | |||
|---|---|---|---|
| Quadrant | BADHDUFLAG | Total packets | Discarded packets |
| A | 0 | 3 | 0 |
| B | 0 | 3 | 0 |
| C | 0 | 3 | 0 |
| D | 0 | 4 | 1 |
| Quadrant | Total seconds | Saturated seconds | Saturation percentage |
|---|---|---|---|
| A | 5708 | 143 | 2.505256% |
| B | 5740 | 114 | 1.986063% |
| C | 5679 | 320 | 5.634795% |
| D | 5753 | 144 | 2.503042% |
Noise dominated data is calculated using 1-second bins in cleaned event files. If a bin has >2000 counts, and if more than 50% of those come from <1% of pixels, then it is considered to be noise-dominated and hence unusable.
| Quadrant | # 1 sec bins | Bins with >0 counts | Bins with >2000 counts | High rate bins dominated by noise | Noise dominated (total time) | Noise dominated (detector-on time) | Marked lightcurve |
|---|---|---|---|---|---|---|---|
| A | 6423 | 5998 | 25 | 25 | 0.39% | 0.42% | 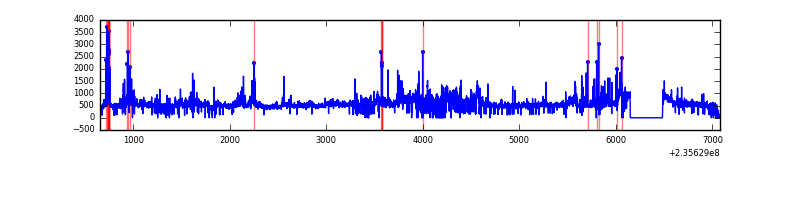 |
| B | 6406 | 6036 | 2 | 2 | 0.03% | 0.03% | 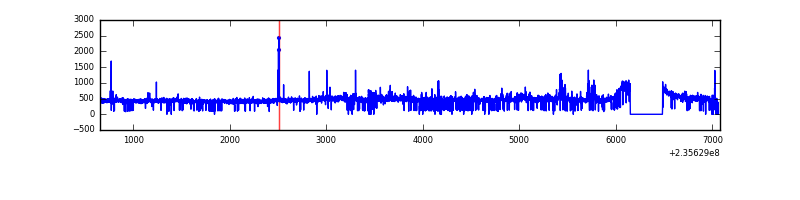 |
| C | 6380 | 5978 | 144 | 144 | 2.26% | 2.41% | 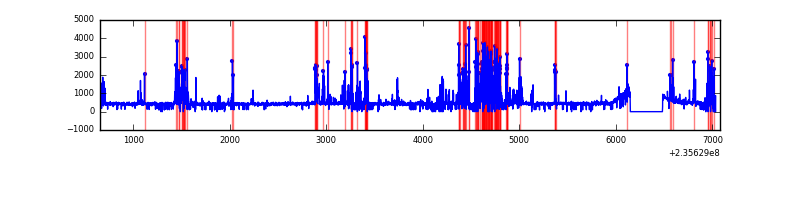 |
| D | 6412 | 6033 | 42 | 42 | 0.66% | 0.70% | 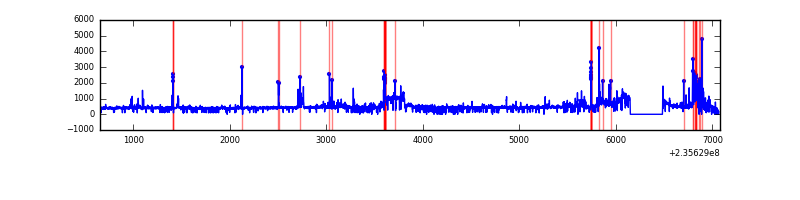 |
Top three noisy pixels from each quadrant. If the there are fewer than three noisy pixels in the level2.evt file, extra rows are filled as -1
| Pixel properties | Quadrant properties | ||||||
|---|---|---|---|---|---|---|---|
| Quadrant | DetID | PixID | Counts | Sigma | Mean | Median | Sigma |
| A | 8 | 5 | 894501 | 6628.96 | 654 | 639 | 134.8 |
| A | 5 | 16 | 60859 | 446.6 | 654 | 639 | 134.8 |
| A | 1 | 162 | 39580 | 288.79 | 654 | 639 | 134.8 |
| B | 0 | 214 | 58497 | 447.77 | 663 | 646 | 129.2 |
| B | 0 | 219 | 38696 | 294.51 | 663 | 646 | 129.2 |
| B | 0 | 187 | 20587 | 154.34 | 663 | 646 | 129.2 |
| C | 4 | 254 | 933025 | 6412.13 | 624 | 625 | 145.4 |
| C | 10 | 22 | 17277 | 114.52 | 624 | 625 | 145.4 |
| C | 4 | 238 | 8832 | 56.44 | 624 | 625 | 145.4 |
| D | 8 | 195 | 252635 | 1499.11 | 639 | 622 | 168.1 |
| D | 1 | 52 | 167295 | 991.46 | 639 | 622 | 168.1 |
| D | 7 | 71 | 50358 | 295.86 | 639 | 622 | 168.1 |
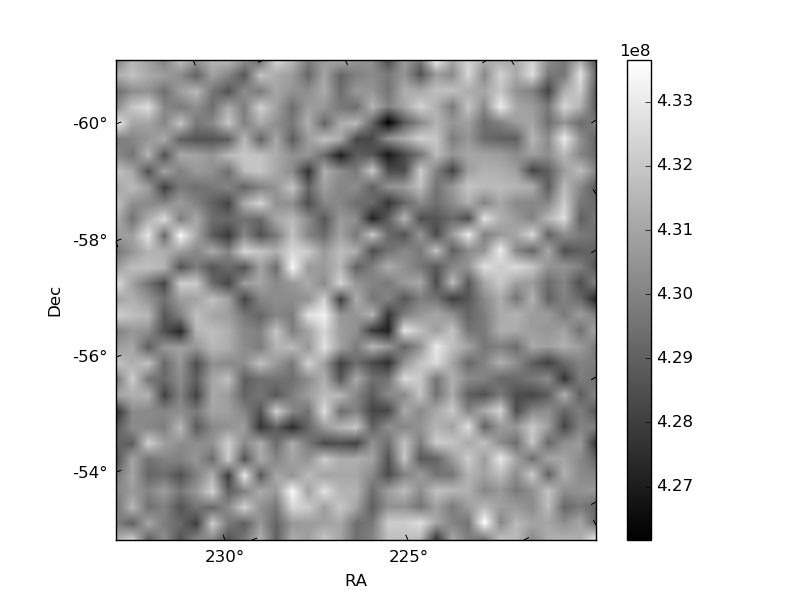
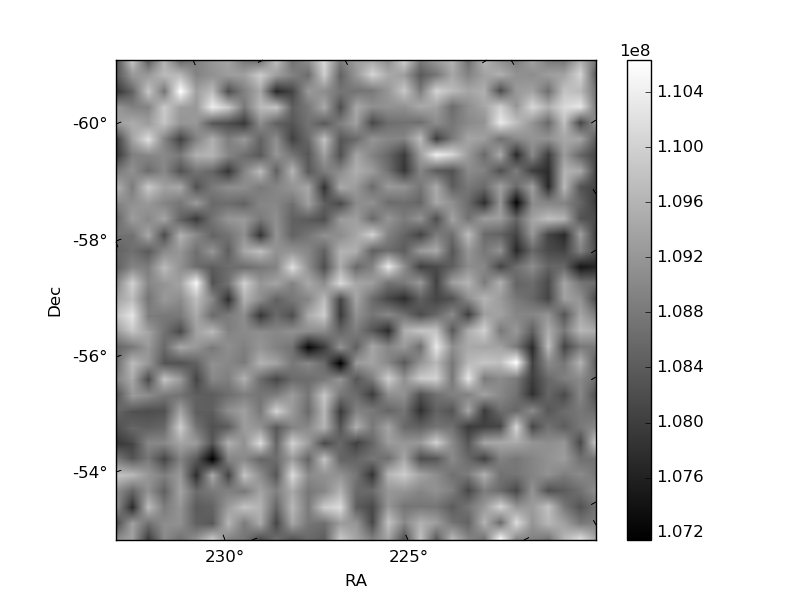
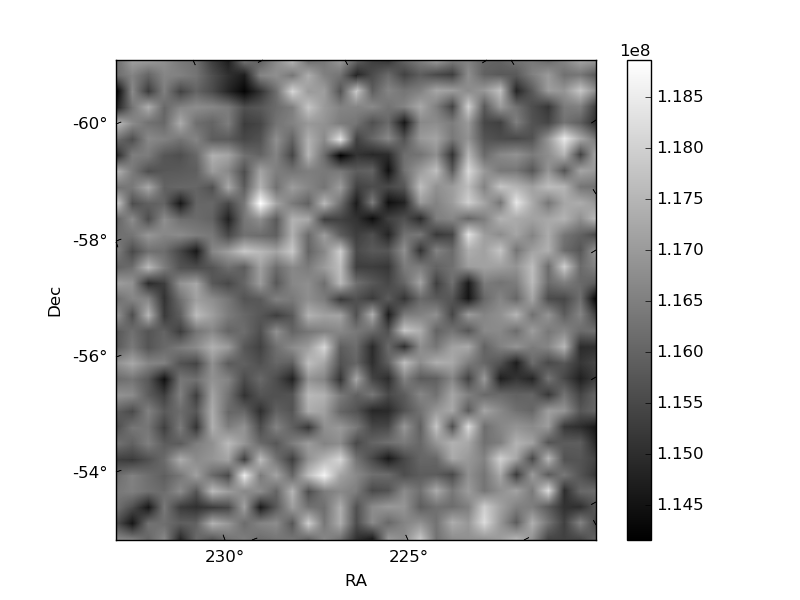
Histogram calculated using DETX and DETY for each event in the final _common_clean file
| Quadrant A | 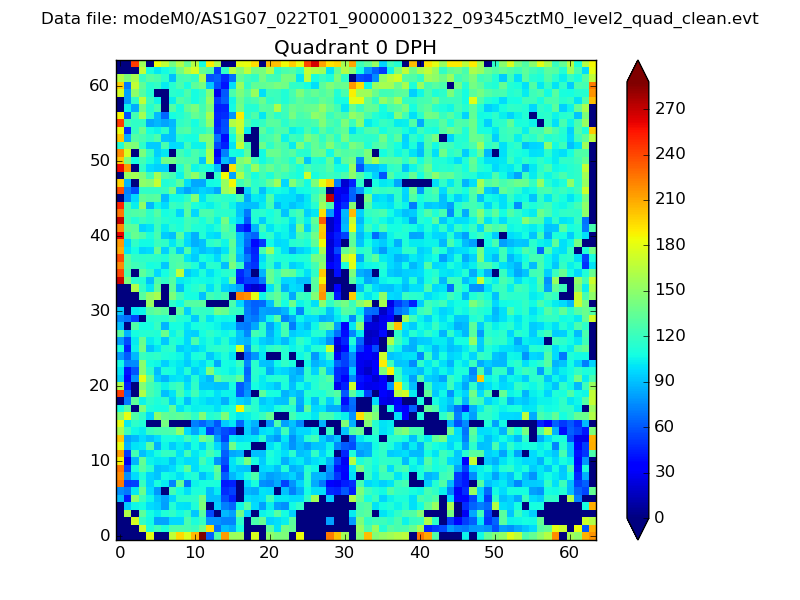 |
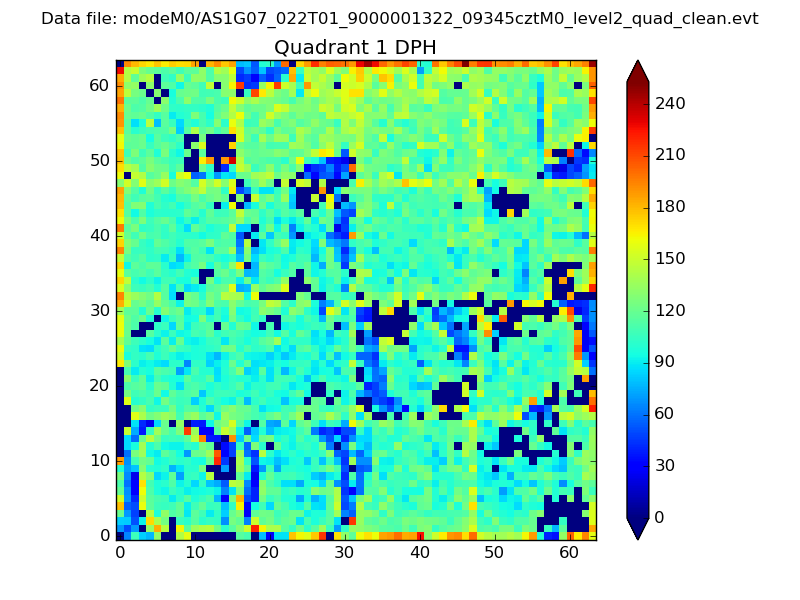 |
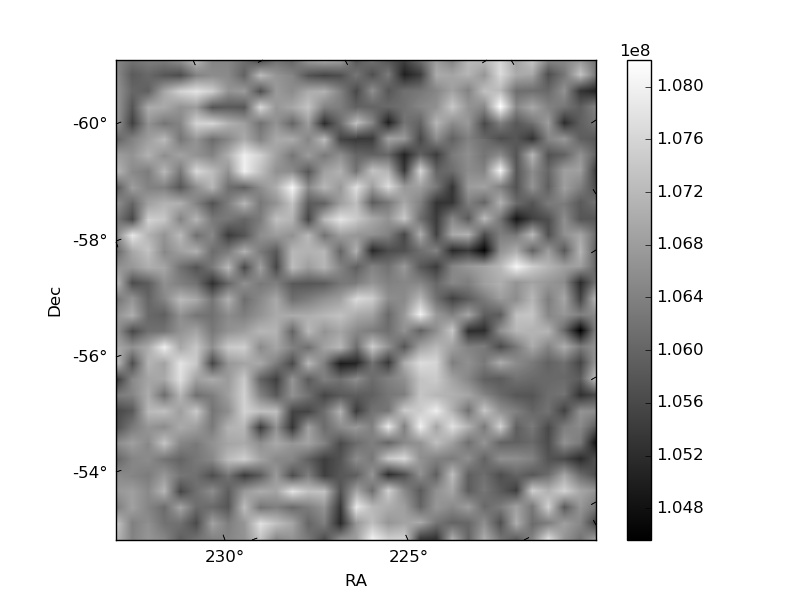
Quadrant B |
|---|---|---|---|
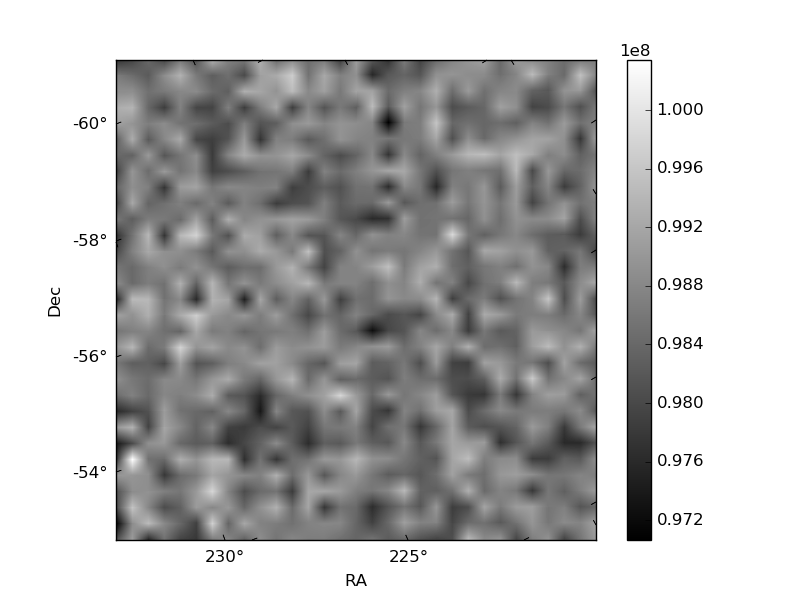
| Quadrant D | 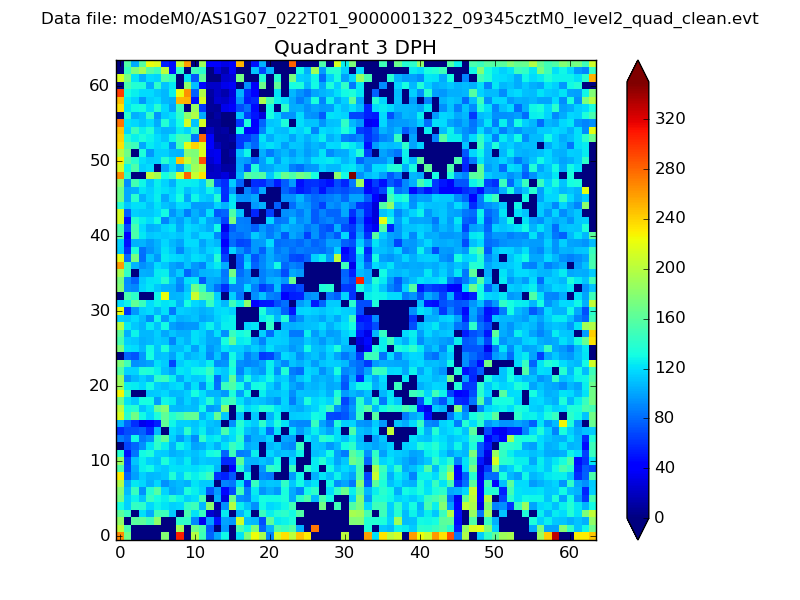 |
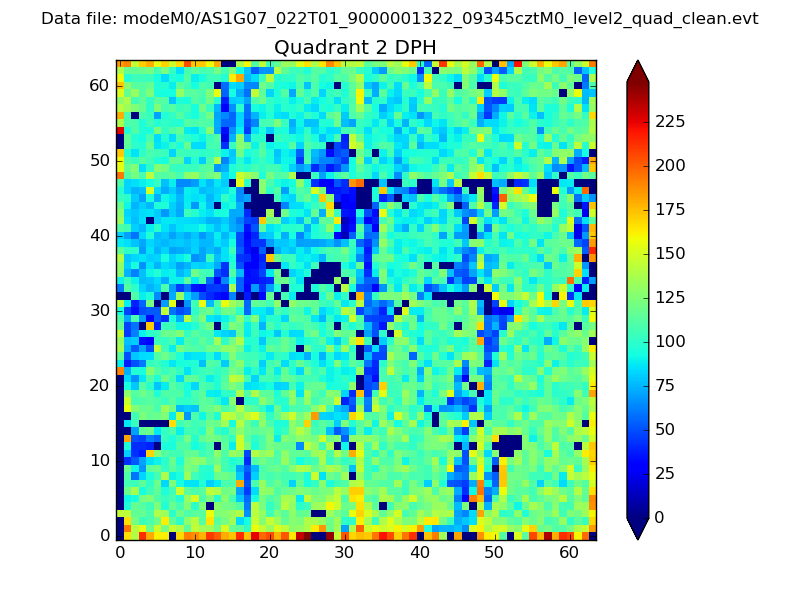 |
Quadrant C |
| Plot type | Count rate plots | Images |
|---|---|---|
| Comparison with Poisson distribution Blue bars denote a histogram of data divided into 1 sec bins. Red curve is a Poisson curve with rate = median count rate of data. |
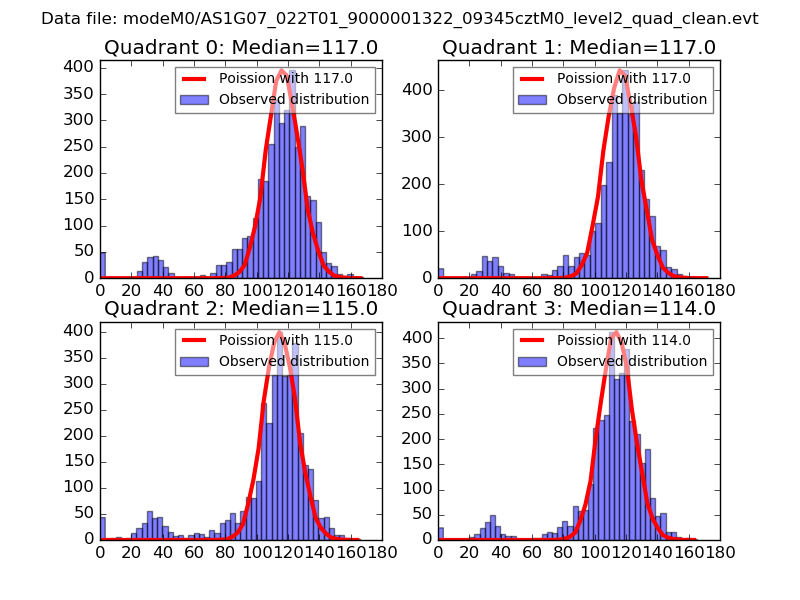 |
 |
| Quadrant-wise count rates Data is divided into 100 sec bins |
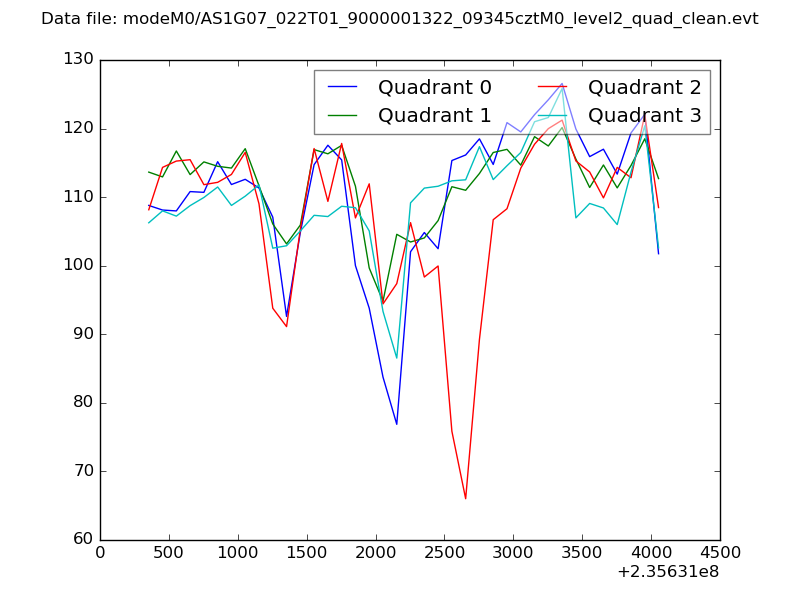 |
|
| Module-wise count rates for Quadrant A Data is divided into 100 sec bins |
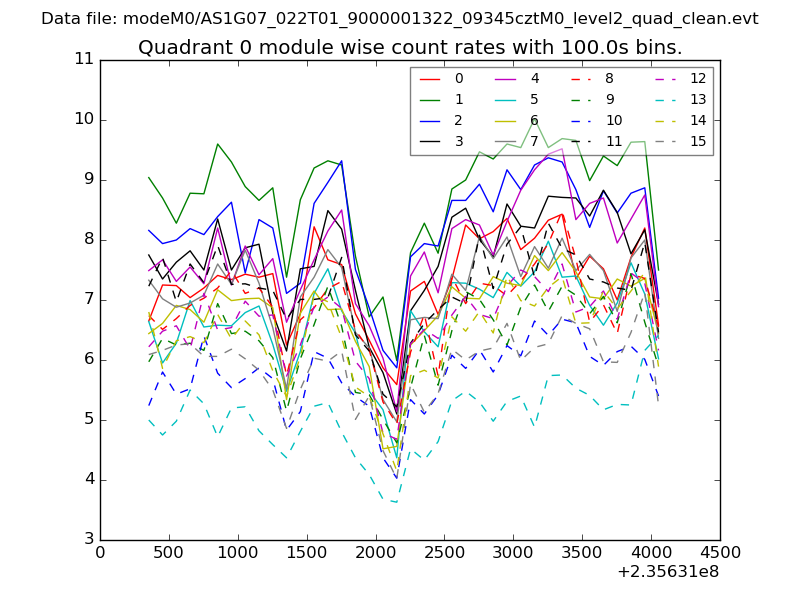 |
 |
| Module-wise count rates for Quadrant B Data is divided into 100 sec bins |
 |
 |
| Module-wise count rates for Quadrant C Data is divided into 100 sec bins |
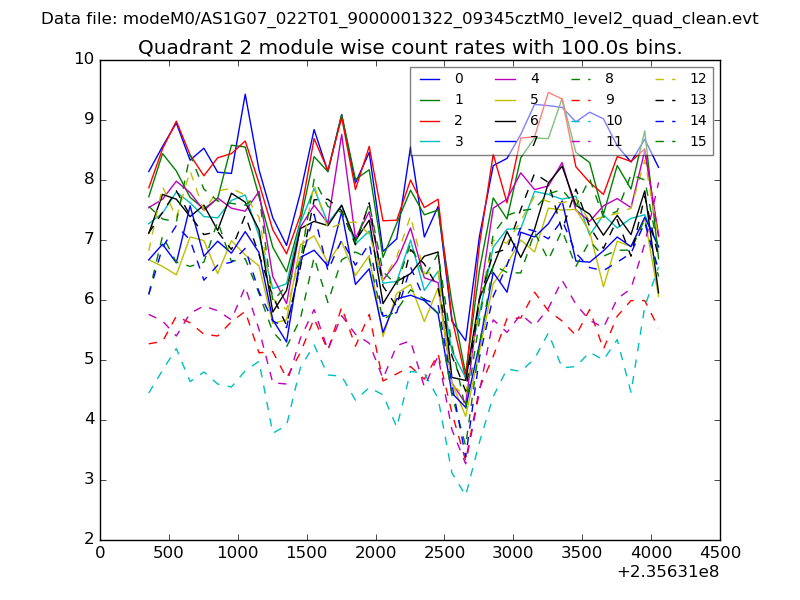 |
 |
| Module-wise count rates for Quadrant D Data is divided into 100 sec bins |
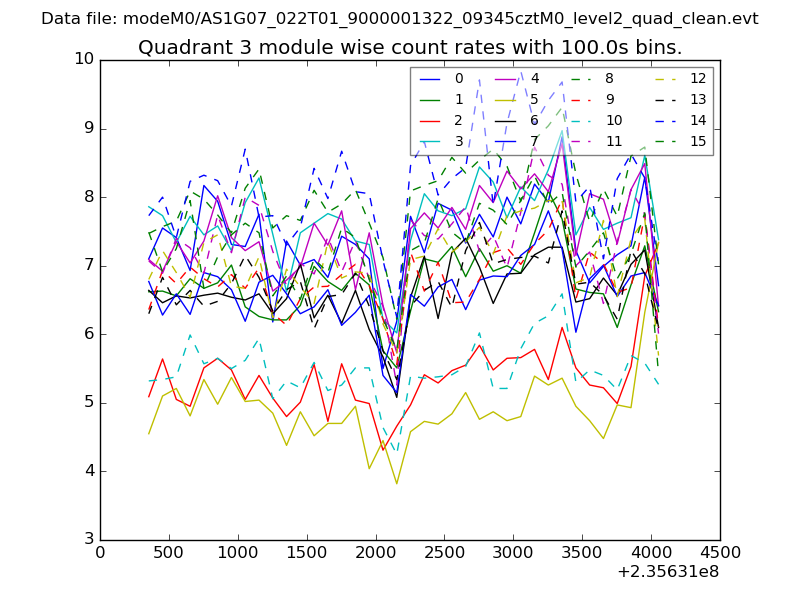 |
 |
| Parameter | Plot |
|---|---|
| CZT HV Monitor | 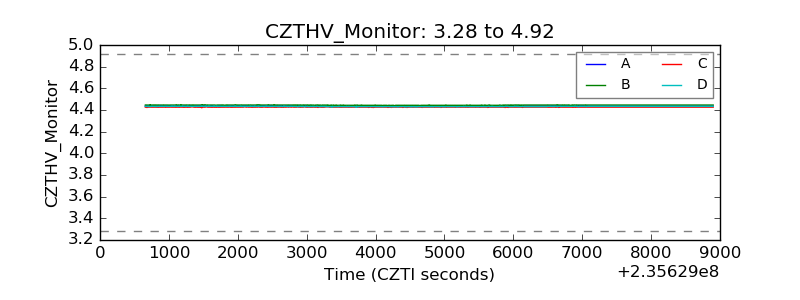 |
| D_VDD | 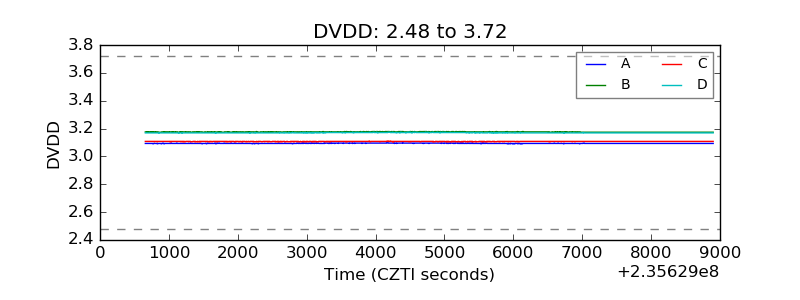 |
| Temperature 1 | 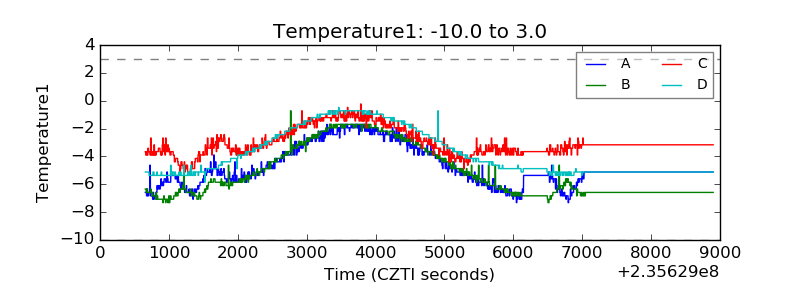 |
| Veto HV Monitor | 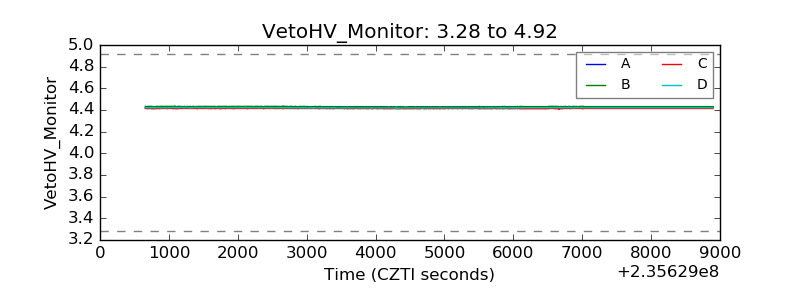 |
| Veto LLD | 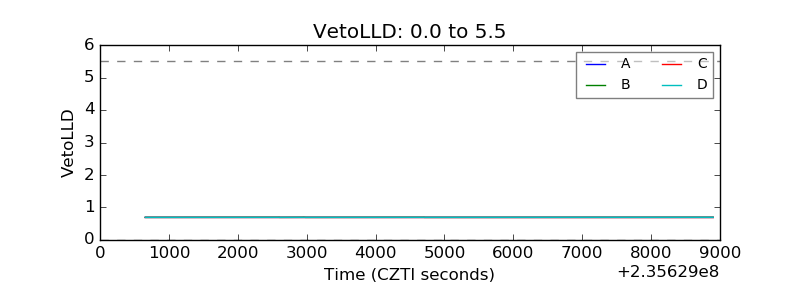 |
| Alpha Counter | 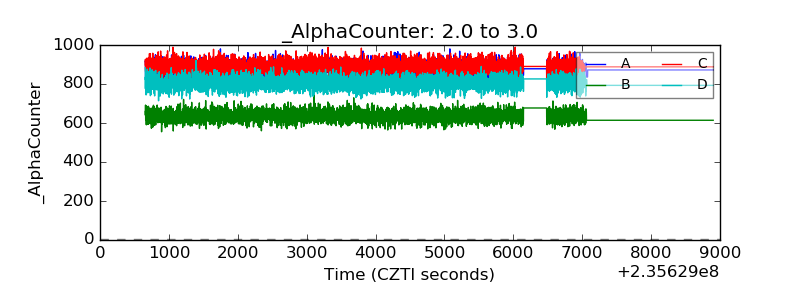 |
| _CPM_Rate | 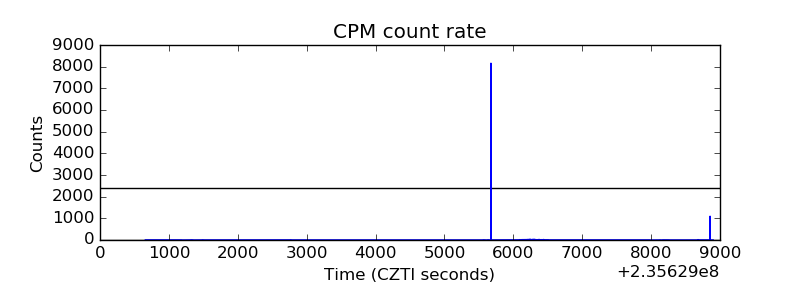 |
| CZT Counter | 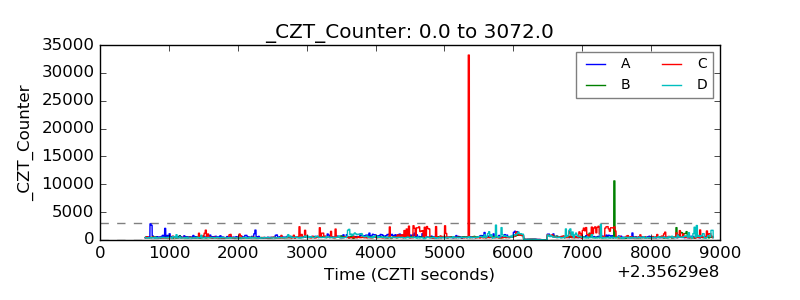 |
| +2.5 Volts monitor |  |
| +5 Volts monitor |  |
| _ROLL_ROT | 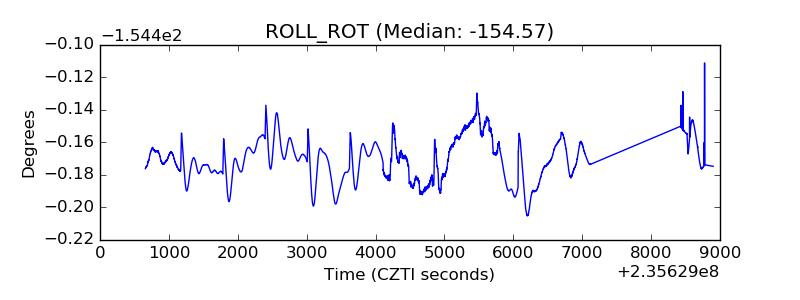 |
| _Roll_DEC | 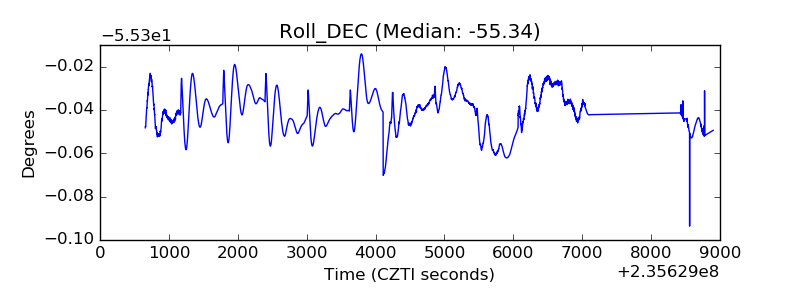 |
| _Roll_RA | 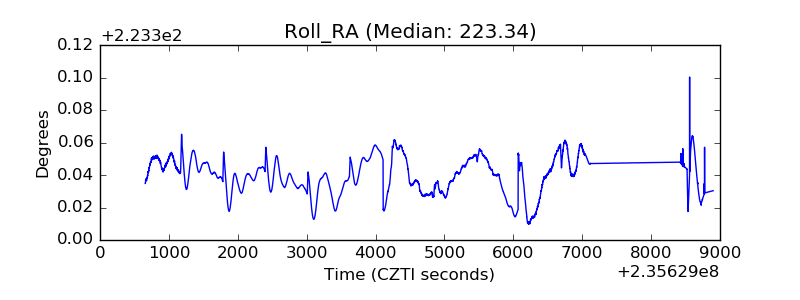 |
| Veto Counter | 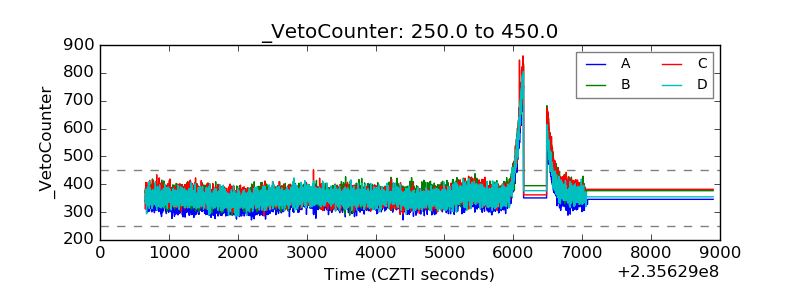 |