| Param | Original file | Final file |
|---|---|---|
| Filename | modeM0/AS1G07_022T01_9000001322_09347cztM0_level2.evt | modeM0/AS1G07_022T01_9000001322_09347cztM0_level2_quad_clean.evt |
| Size (bytes) | 631,031,040 | 106,945,920 |
| Size | 601.8 MB | 102.0 MB |
| Events in quadrant A | 6,129,792 | 654,575 |
| Events in quadrant B | 3,508,169 | 726,999 |
| Events in quadrant C | 3,950,823 | 698,332 |
| Events in quadrant D | 5,064,478 | 687,513 |
| Mode M0 | |||
|---|---|---|---|
| Quadrant | BADHDUFLAG | Total packets | Discarded packets |
| A | 0 | 22776 | 10 |
| B | 0 | 15056 | 5 |
| C | 0 | 16456 | 1 |
| D | 0 | 19655 | 5 |
| Mode SS | |||
|---|---|---|---|
| Quadrant | BADHDUFLAG | Total packets | Discarded packets |
| A | 0 | 136 | 0 |
| B | 0 | 136 | 0 |
| C | 0 | 136 | 0 |
| D | 0 | 136 | 0 |
| Mode M9 | |||
|---|---|---|---|
| Quadrant | BADHDUFLAG | Total packets | Discarded packets |
| A | 0 | 11 | 0 |
| B | 0 | 11 | 0 |
| C | 0 | 11 | 0 |
| D | 0 | 11 | 0 |
| Quadrant | Total seconds | Saturated seconds | Saturation percentage |
|---|---|---|---|
| A | 6760 | 1068 | 15.798817% |
| B | 6761 | 87 | 1.286792% |
| C | 6763 | 289 | 4.273252% |
| D | 6761 | 329 | 4.866144% |
Noise dominated data is calculated using 1-second bins in cleaned event files. If a bin has >2000 counts, and if more than 50% of those come from <1% of pixels, then it is considered to be noise-dominated and hence unusable.
| Quadrant | # 1 sec bins | Bins with >0 counts | Bins with >2000 counts | High rate bins dominated by noise | Noise dominated (total time) | Noise dominated (detector-on time) | Marked lightcurve |
|---|---|---|---|---|---|---|---|
| A | 7838 | 6764 | 748 | 748 | 9.54% | 11.06% | 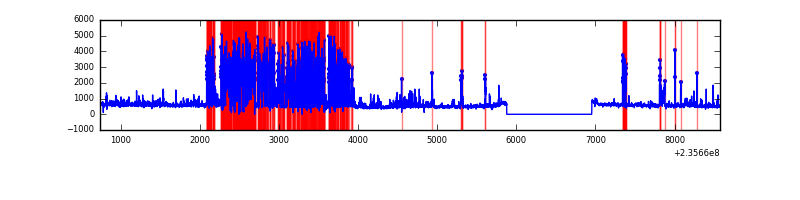 |
| B | 7838 | 6764 | 12 | 12 | 0.15% | 0.18% | 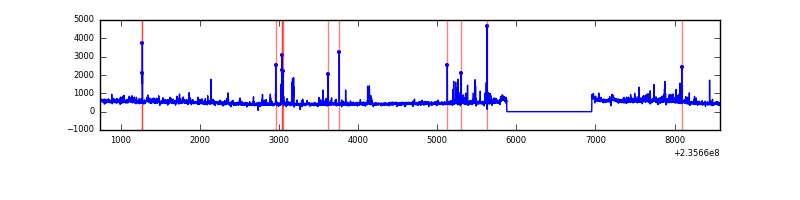 |
| C | 7838 | 6764 | 163 | 163 | 2.08% | 2.41% | 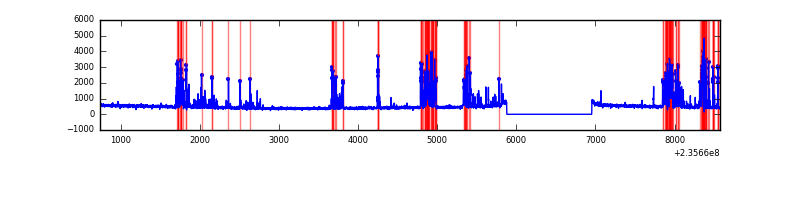 |
| D | 7838 | 6764 | 179 | 179 | 2.28% | 2.65% | 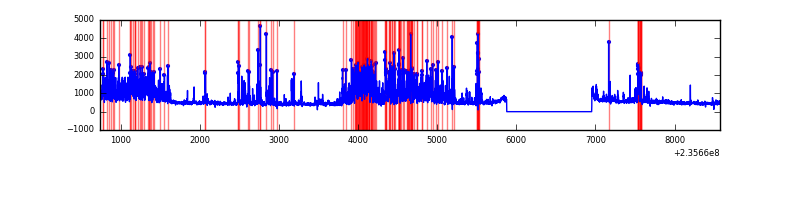 |
Top three noisy pixels from each quadrant. If the there are fewer than three noisy pixels in the level2.evt file, extra rows are filled as -1
| Pixel properties | Quadrant properties | ||||||
|---|---|---|---|---|---|---|---|
| Quadrant | DetID | PixID | Counts | Sigma | Mean | Median | Sigma |
| A | 8 | 5 | 2878574 | 18609.9 | 763 | 749 | 154.6 |
| A | 1 | 162 | 100709 | 646.41 | 763 | 749 | 154.6 |
| A | 15 | 174 | 53102 | 338.55 | 763 | 749 | 154.6 |
| B | 0 | 214 | 120247 | 769.92 | 816 | 798 | 155.1 |
| B | 4 | 80 | 63405 | 403.54 | 816 | 798 | 155.1 |
| B | 0 | 246 | 48991 | 310.63 | 816 | 798 | 155.1 |
| C | 4 | 254 | 922065 | 5215.46 | 768 | 772 | 176.6 |
| C | 12 | 16 | 16606 | 89.64 | 768 | 772 | 176.6 |
| C | 10 | 22 | 6302 | 31.31 | 768 | 772 | 176.6 |
| D | 1 | 52 | 1569413 | 7554.14 | 777 | 759 | 207.7 |
| D | 13 | 104 | 252083 | 1210.3 | 777 | 759 | 207.7 |
| D | 8 | 195 | 53654 | 254.73 | 777 | 759 | 207.7 |
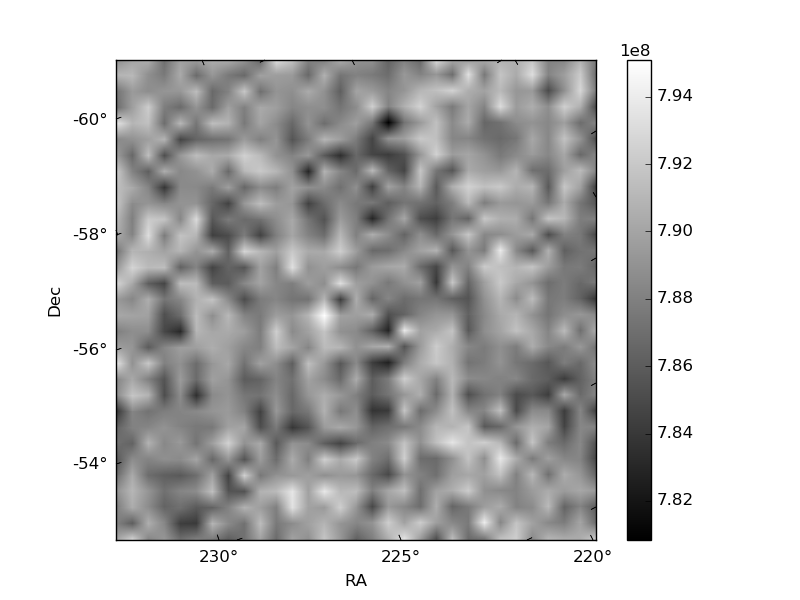
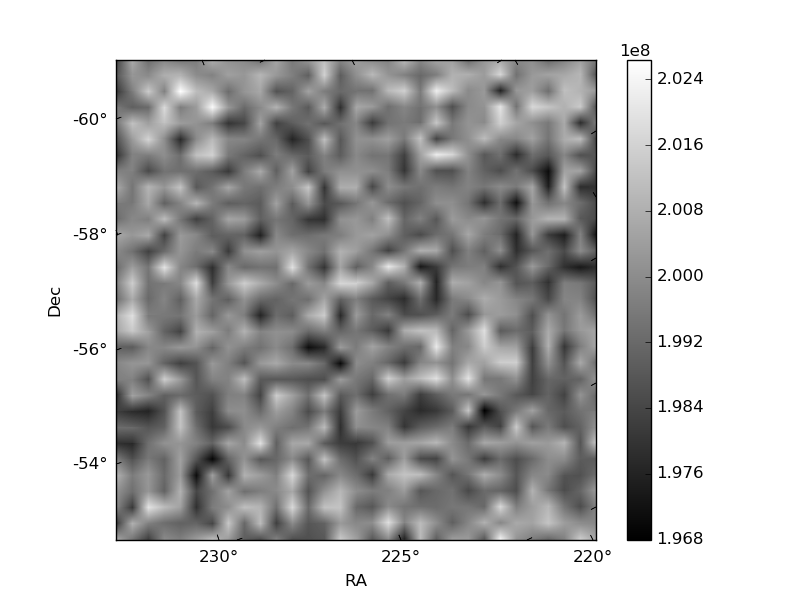
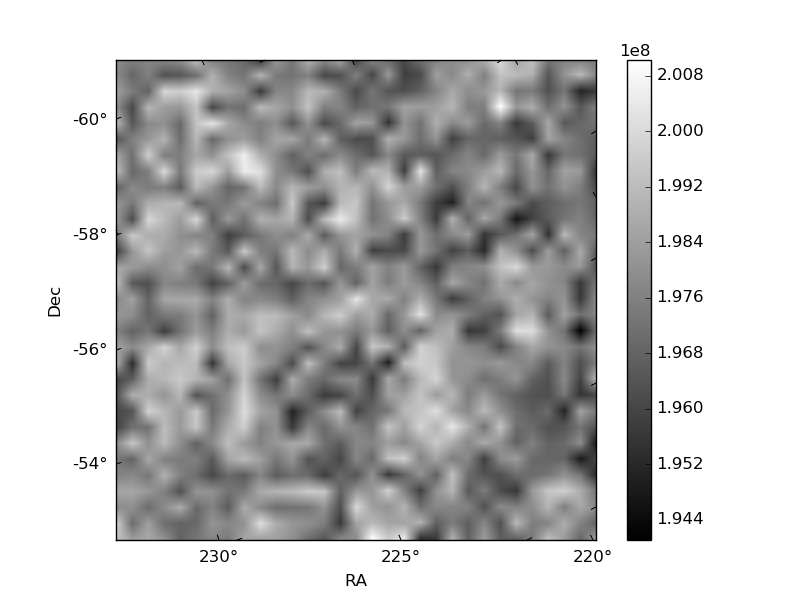
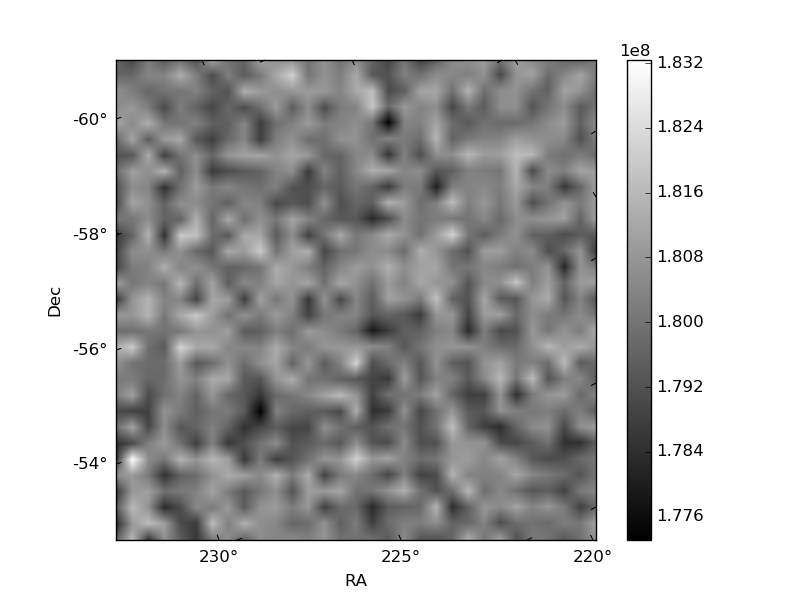
Histogram calculated using DETX and DETY for each event in the final _common_clean file
| Quadrant A | 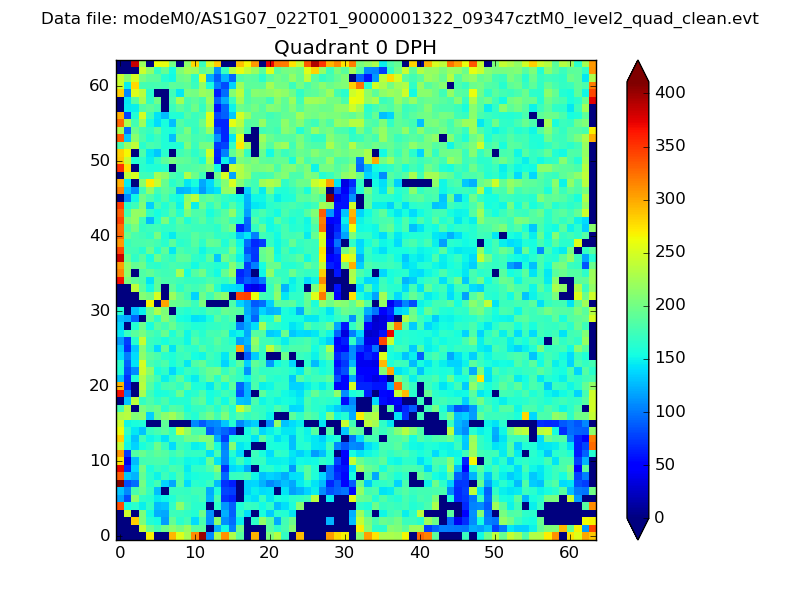 |
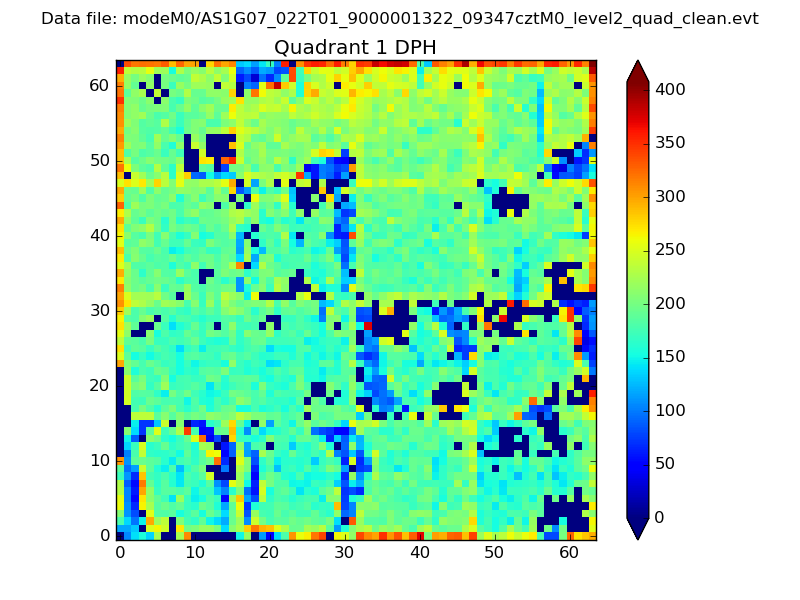 |
Quadrant B |
|---|---|---|---|
| Quadrant D |  |
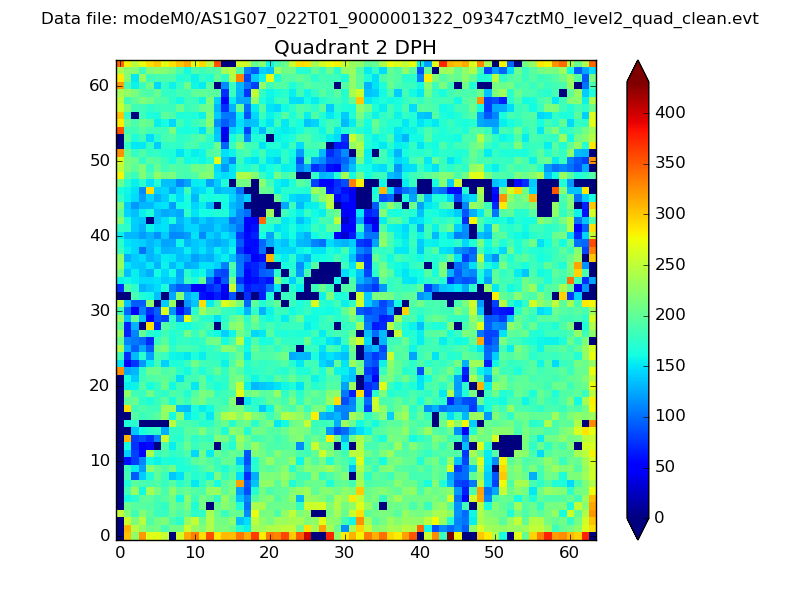 |
Quadrant C |
| Plot type | Count rate plots | Images |
|---|---|---|
| Comparison with Poisson distribution Blue bars denote a histogram of data divided into 1 sec bins. Red curve is a Poisson curve with rate = median count rate of data. |
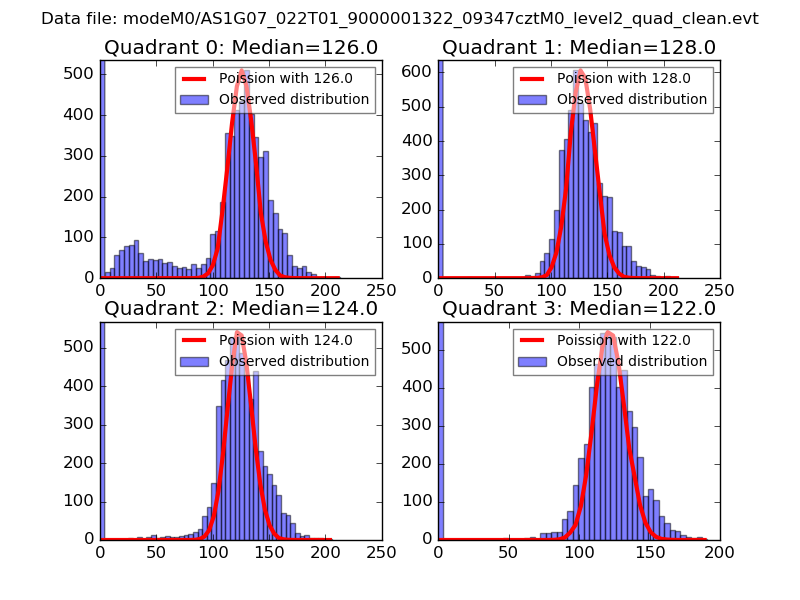 |
 |
| Quadrant-wise count rates Data is divided into 100 sec bins |
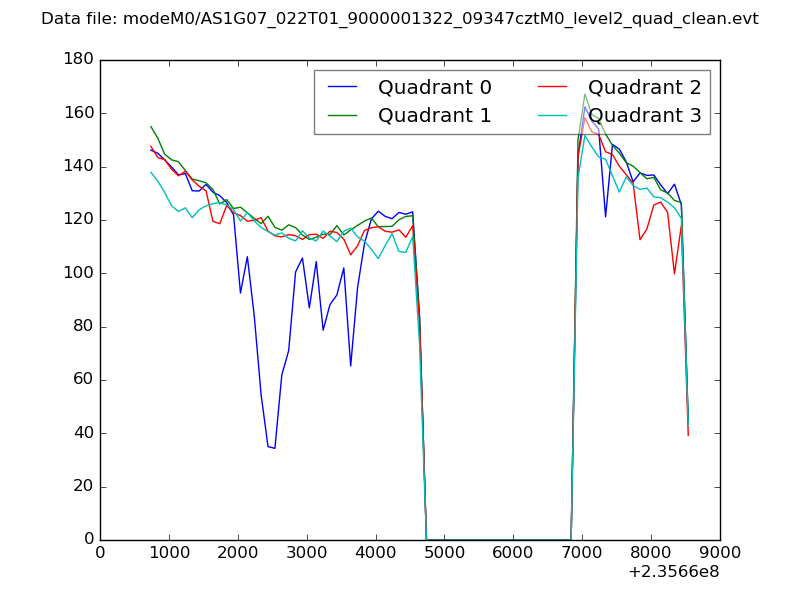 |
|
| Module-wise count rates for Quadrant A Data is divided into 100 sec bins |
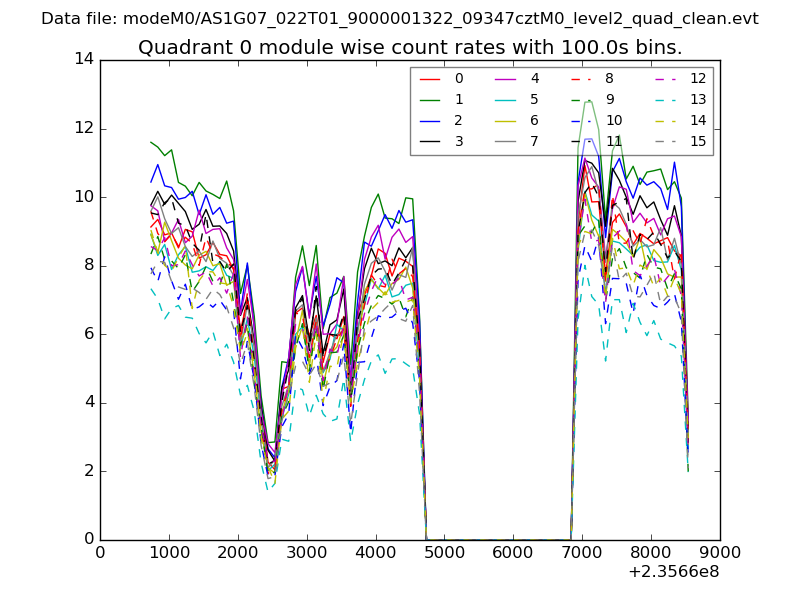 |
 |
| Module-wise count rates for Quadrant B Data is divided into 100 sec bins |
 |
 |
| Module-wise count rates for Quadrant C Data is divided into 100 sec bins |
 |
 |
| Module-wise count rates for Quadrant D Data is divided into 100 sec bins |
 |
 |
| Parameter | Plot |
|---|---|
| CZT HV Monitor |  |
| D_VDD | 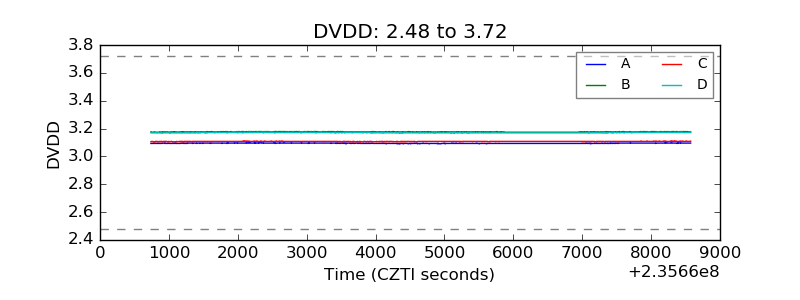 |
| Temperature 1 | 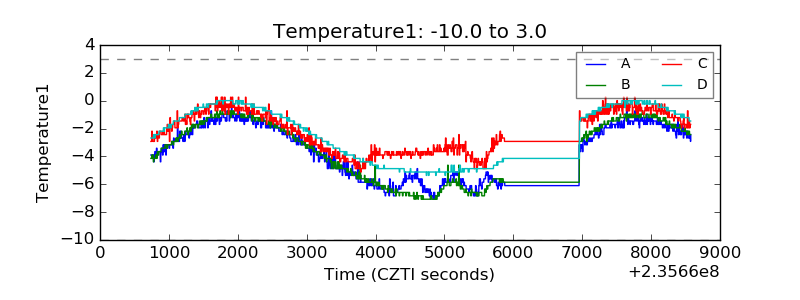 |
| Veto HV Monitor | 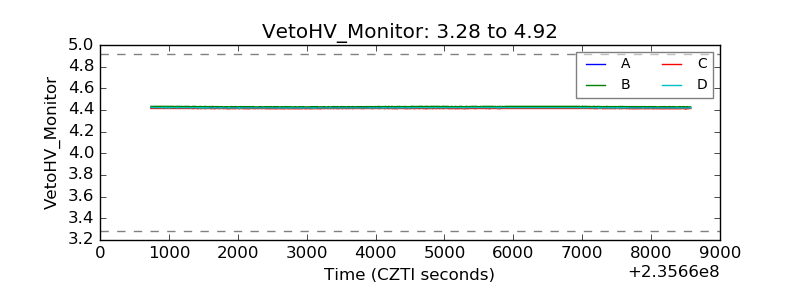 |
| Veto LLD |  |
| Alpha Counter | 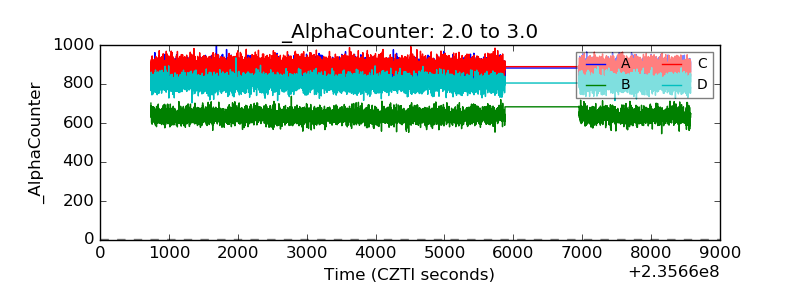 |
| _CPM_Rate | 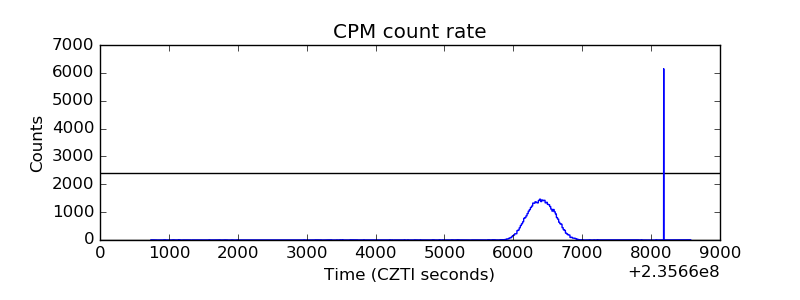 |
| CZT Counter | 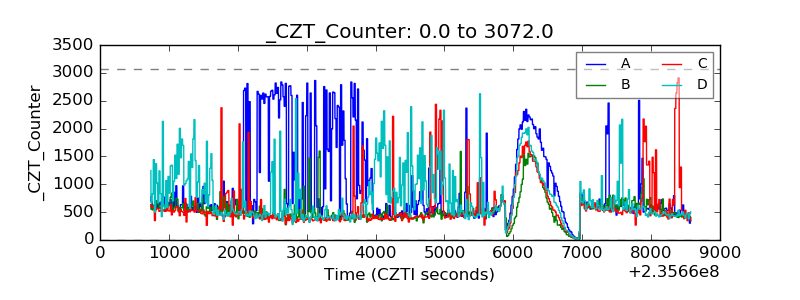 |
| +2.5 Volts monitor |  |
| +5 Volts monitor | 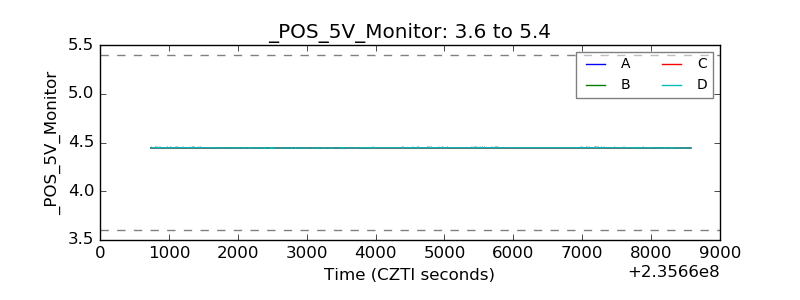 |
| _ROLL_ROT | 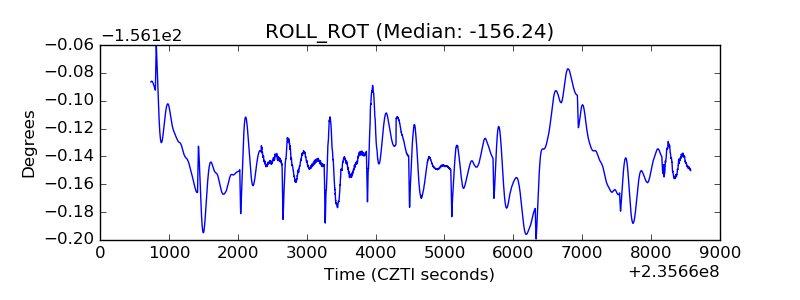 |
| _Roll_DEC | 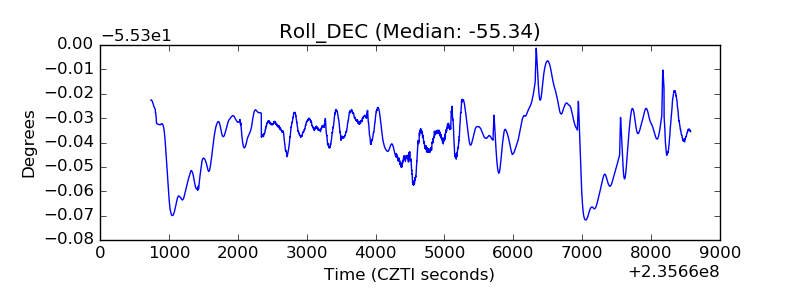 |
| _Roll_RA | 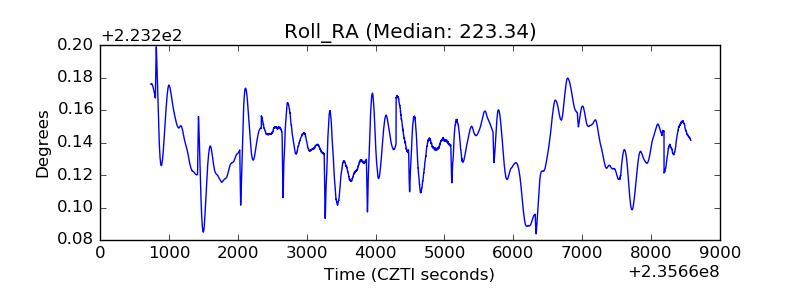 |
| Veto Counter | 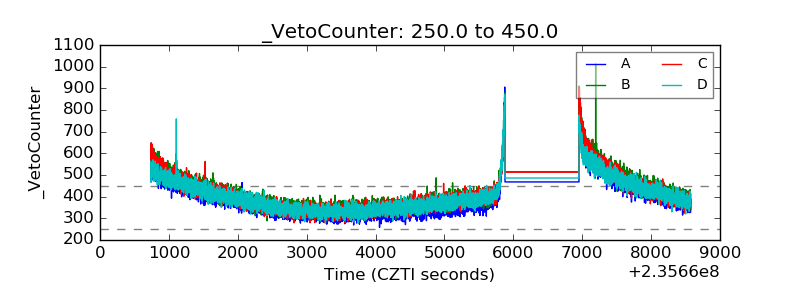 |