| Param | Original file | Final file |
|---|---|---|
| Filename | modeM0/AS1G07_022T01_9000001322_09348cztM0_level2.evt | modeM0/AS1G07_022T01_9000001322_09348cztM0_level2_quad_clean.evt |
| Size (bytes) | 1,393,776,000 | 238,815,360 |
| Size | 1.3 GB | 227.8 MB |
| Events in quadrant A | 11,101,129 | 1,539,388 |
| Events in quadrant B | 8,893,348 | 1,539,518 |
| Events in quadrant C | 10,875,087 | 1,481,576 |
| Events in quadrant D | 10,166,525 | 1,472,744 |
| Mode M0 | |||
|---|---|---|---|
| Quadrant | BADHDUFLAG | Total packets | Discarded packets |
| A | 0 | 44540 | 92 |
| B | 0 | 38102 | 31 |
| C | 0 | 44569 | 65 |
| D | 0 | 42496 | 66 |
| Mode SS | |||
|---|---|---|---|
| Quadrant | BADHDUFLAG | Total packets | Discarded packets |
| A | 0 | 356 | 0 |
| B | 0 | 356 | 0 |
| C | 0 | 356 | 0 |
| D | 0 | 356 | 0 |
| Mode M9 | |||
|---|---|---|---|
| Quadrant | BADHDUFLAG | Total packets | Discarded packets |
| A | 0 | 17 | 0 |
| B | 0 | 16 | 0 |
| C | 0 | 16 | 0 |
| D | 0 | 16 | 0 |
| Quadrant | Total seconds | Saturated seconds | Saturation percentage |
|---|---|---|---|
| A | 17377 | 450 | 2.589630% |
| B | 17391 | 314 | 1.805532% |
| C | 17387 | 1094 | 6.292057% |
| D | 17380 | 704 | 4.050633% |
Noise dominated data is calculated using 1-second bins in cleaned event files. If a bin has >2000 counts, and if more than 50% of those come from <1% of pixels, then it is considered to be noise-dominated and hence unusable.
| Quadrant | # 1 sec bins | Bins with >0 counts | Bins with >2000 counts | High rate bins dominated by noise | Noise dominated (total time) | Noise dominated (detector-on time) | Marked lightcurve |
|---|---|---|---|---|---|---|---|
| A | 45143 | 17407 | 137 | 137 | 0.30% | 0.79% | 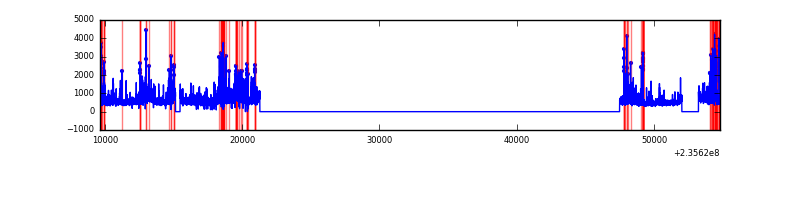 |
| B | 45143 | 17408 | 72 | 72 | 0.16% | 0.41% | 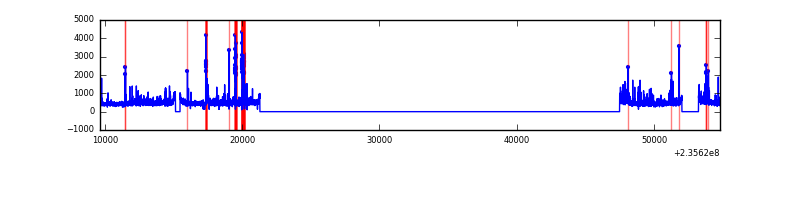 |
| C | 45143 | 17407 | 658 | 658 | 1.46% | 3.78% | 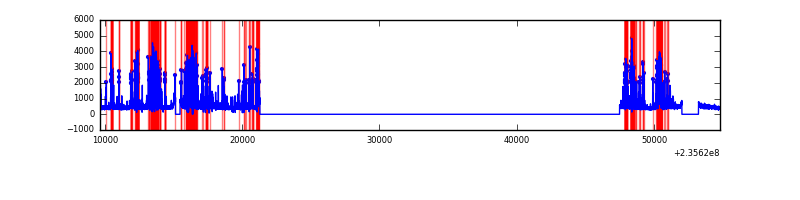 |
| D | 45143 | 17408 | 492 | 492 | 1.09% | 2.83% | 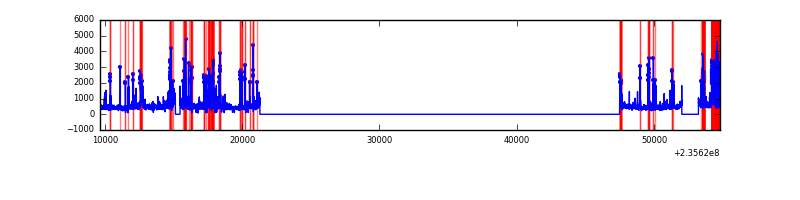 |
Top three noisy pixels from each quadrant. If the there are fewer than three noisy pixels in the level2.evt file, extra rows are filled as -1
| Pixel properties | Quadrant properties | ||||||
|---|---|---|---|---|---|---|---|
| Quadrant | DetID | PixID | Counts | Sigma | Mean | Median | Sigma |
| A | 8 | 5 | 2835078 | 6967.94 | 2014 | 1975 | 406.6 |
| A | 13 | 251 | 133757 | 324.11 | 2014 | 1975 | 406.6 |
| A | 1 | 162 | 115576 | 279.4 | 2014 | 1975 | 406.6 |
| B | 0 | 214 | 212602 | 549.56 | 2022 | 1976 | 383.3 |
| B | 5 | 250 | 177004 | 456.67 | 2022 | 1976 | 383.3 |
| B | 15 | 255 | 152759 | 393.42 | 2022 | 1976 | 383.3 |
| C | 4 | 254 | 3385856 | 7759.14 | 1896 | 1901 | 436.1 |
| C | 10 | 22 | 31596 | 68.09 | 1896 | 1901 | 436.1 |
| C | 4 | 238 | 22000 | 46.09 | 1896 | 1901 | 436.1 |
| D | 12 | 227 | 946581 | 1863.81 | 1922 | 1877 | 506.9 |
| D | 1 | 52 | 489241 | 961.52 | 1922 | 1877 | 506.9 |
| D | 7 | 71 | 333342 | 653.95 | 1922 | 1877 | 506.9 |
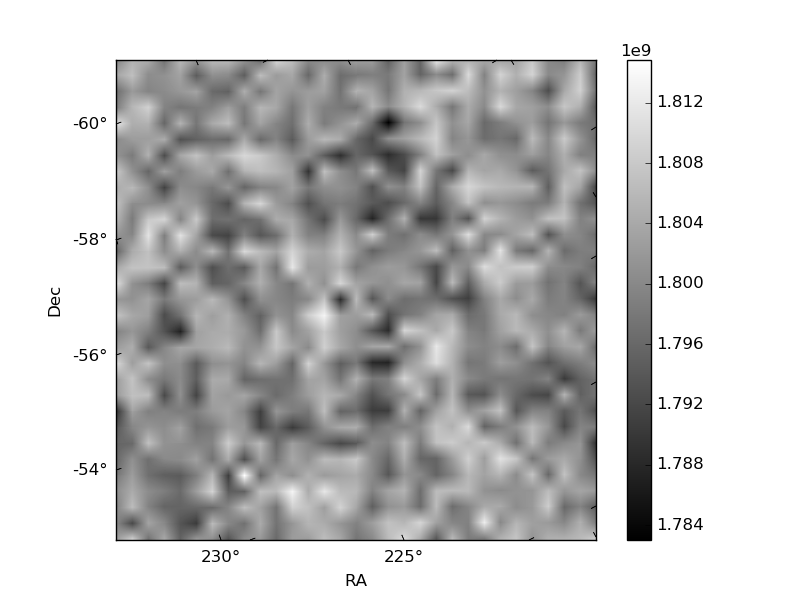
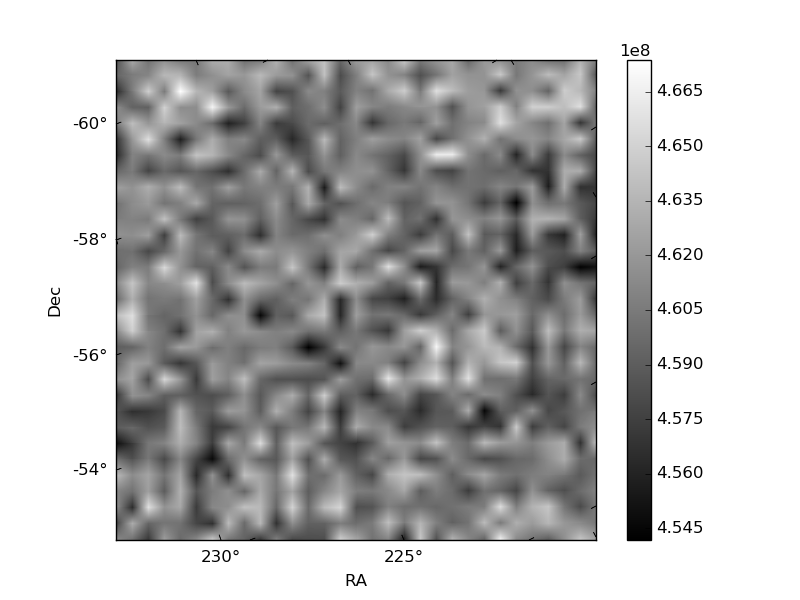
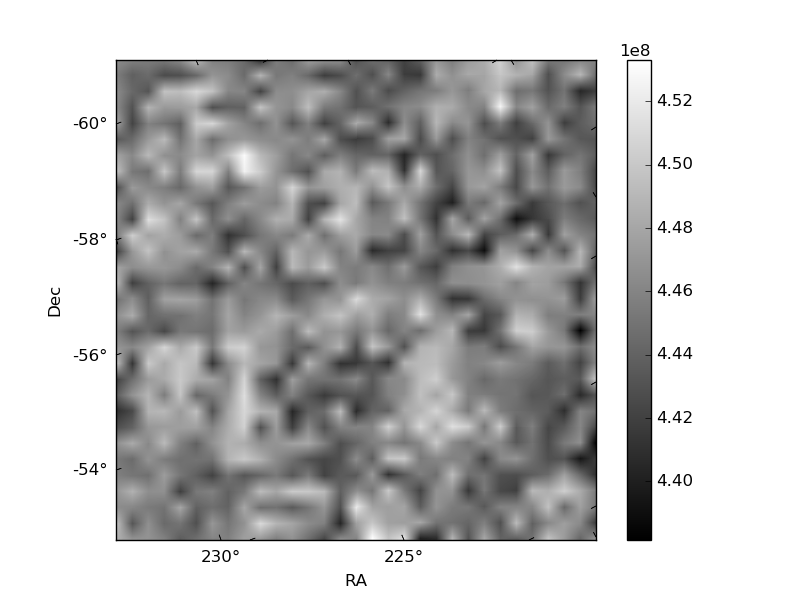
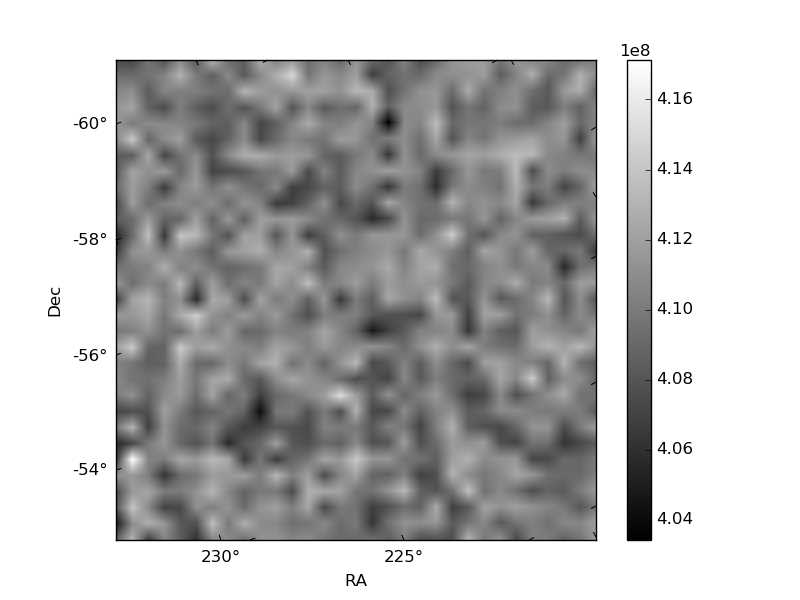
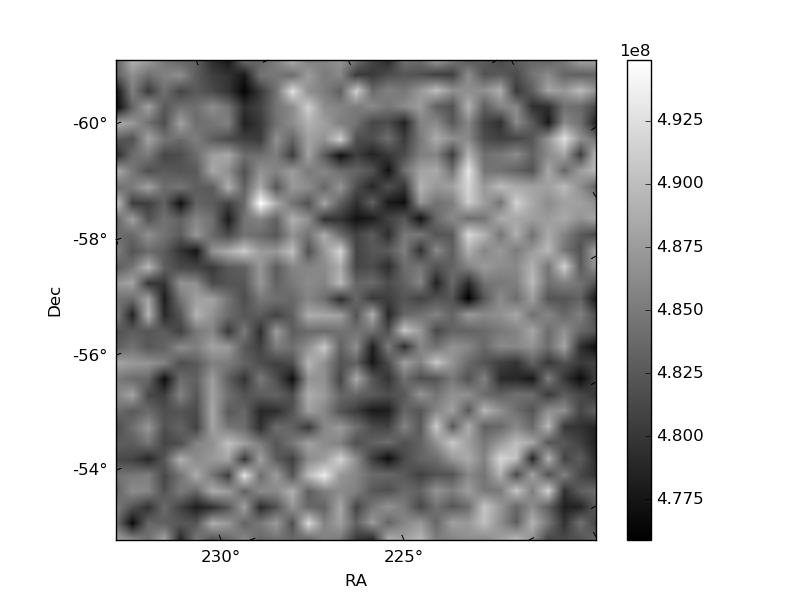
Histogram calculated using DETX and DETY for each event in the final _common_clean file
| Quadrant A | 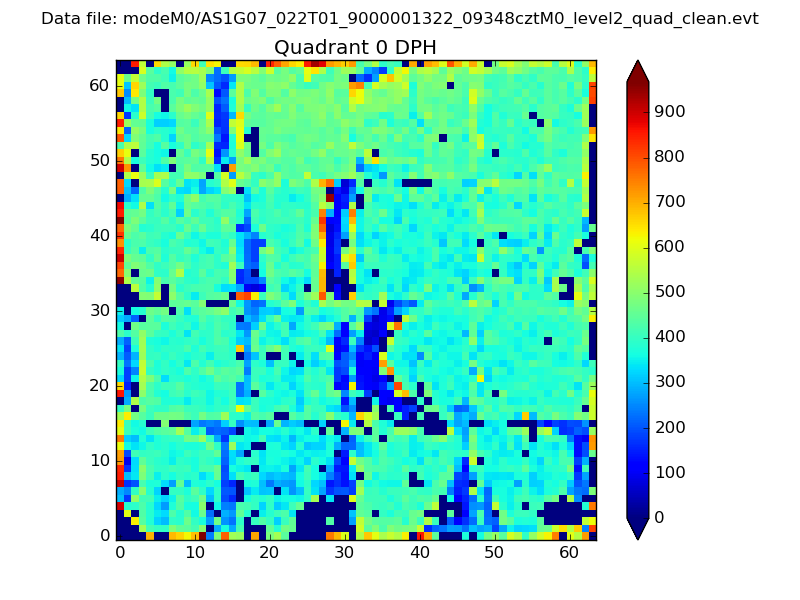 |
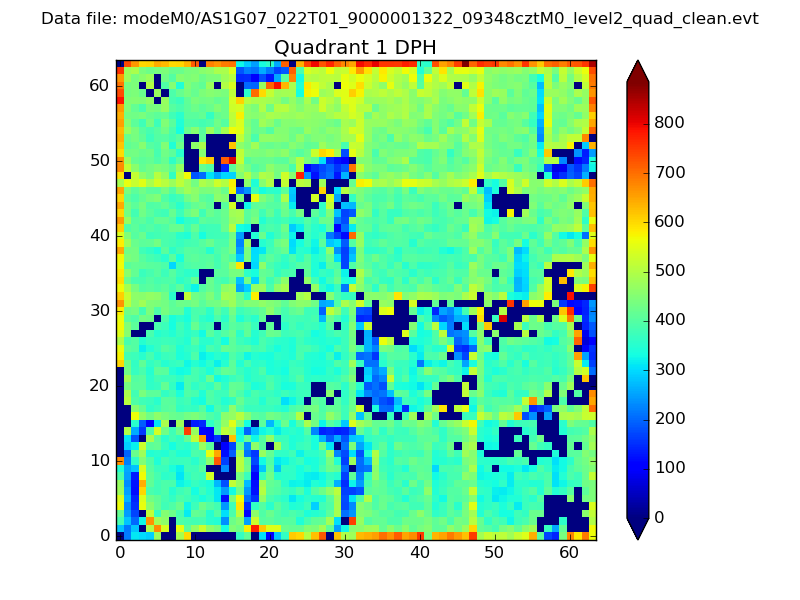 |
Quadrant B |
|---|---|---|---|
| Quadrant D | 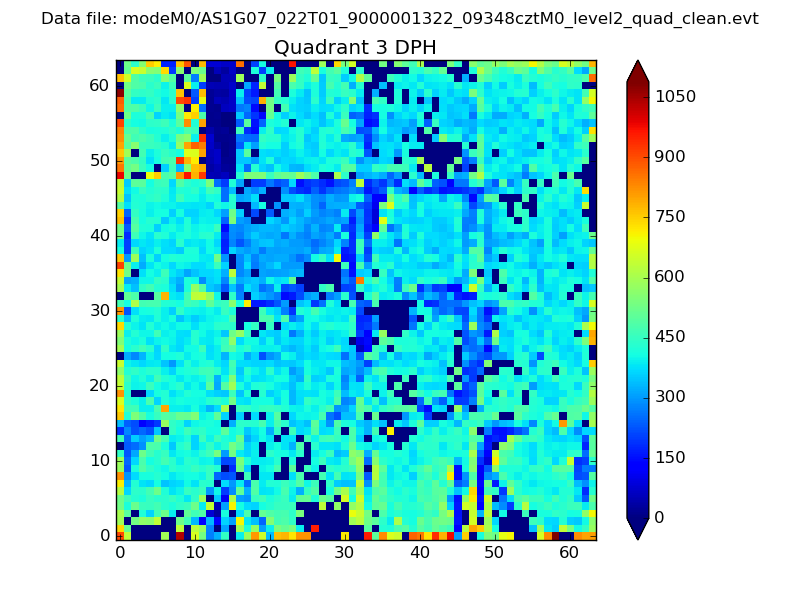 |
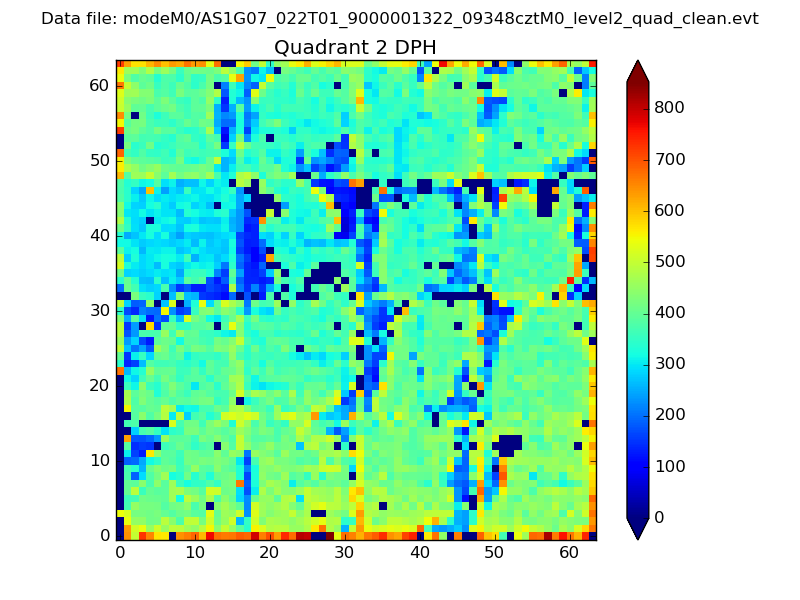 |
Quadrant C |
| Plot type | Count rate plots | Images |
|---|---|---|
| Comparison with Poisson distribution Blue bars denote a histogram of data divided into 1 sec bins. Red curve is a Poisson curve with rate = median count rate of data. |
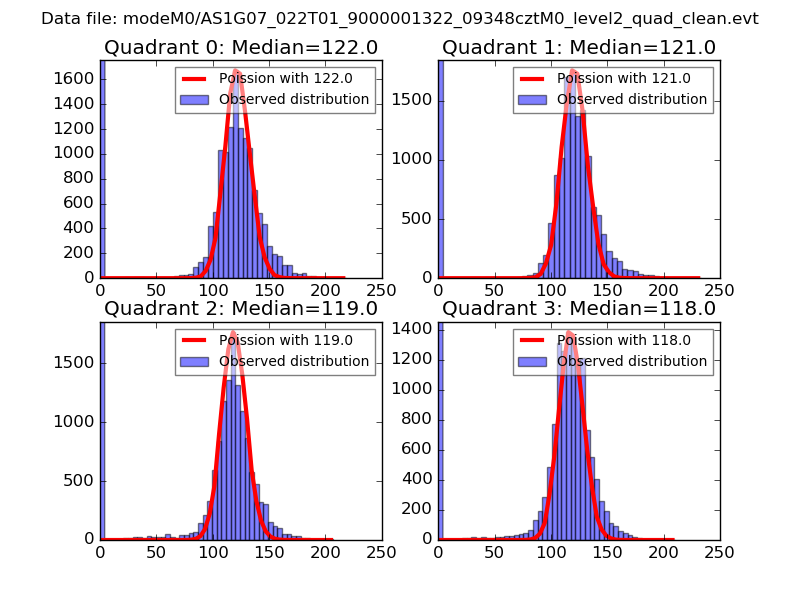 |
 |
| Quadrant-wise count rates Data is divided into 100 sec bins |
 |
|
| Module-wise count rates for Quadrant A Data is divided into 100 sec bins |
 |
 |
| Module-wise count rates for Quadrant B Data is divided into 100 sec bins |
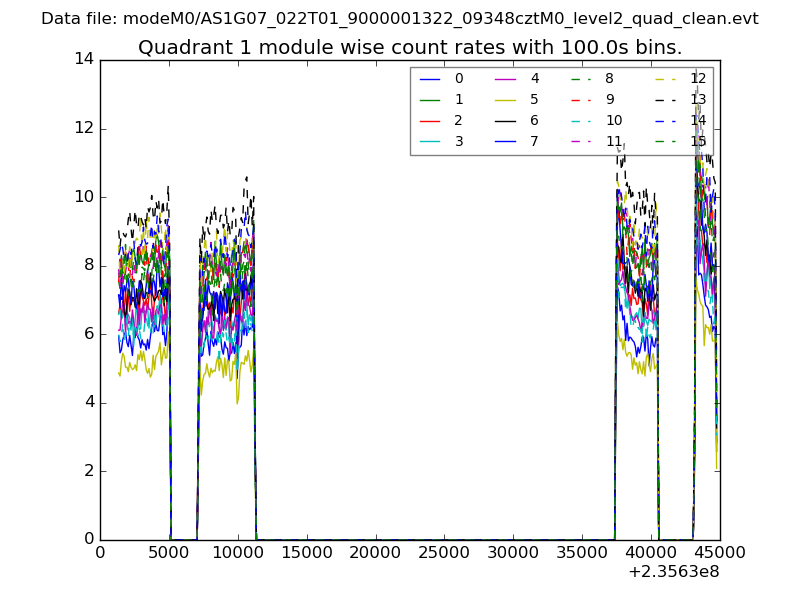 |
 |
| Module-wise count rates for Quadrant C Data is divided into 100 sec bins |
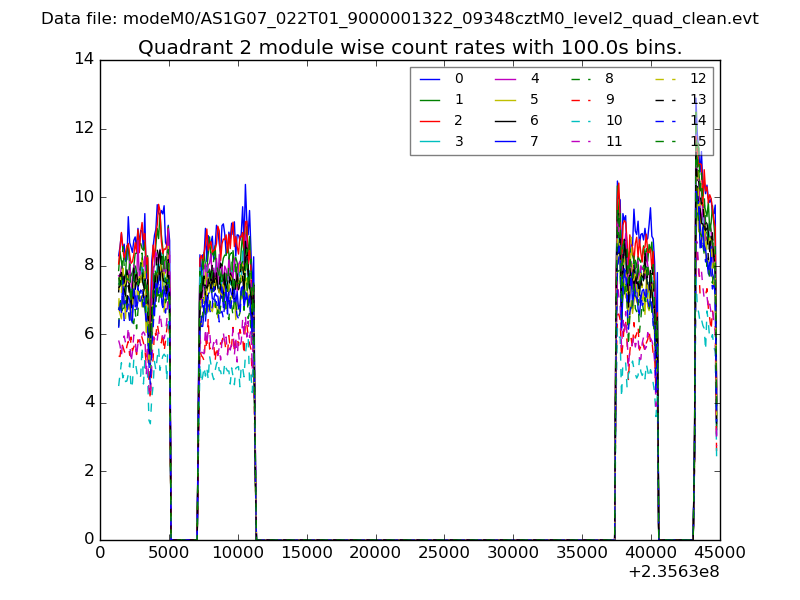 |
 |
| Module-wise count rates for Quadrant D Data is divided into 100 sec bins |
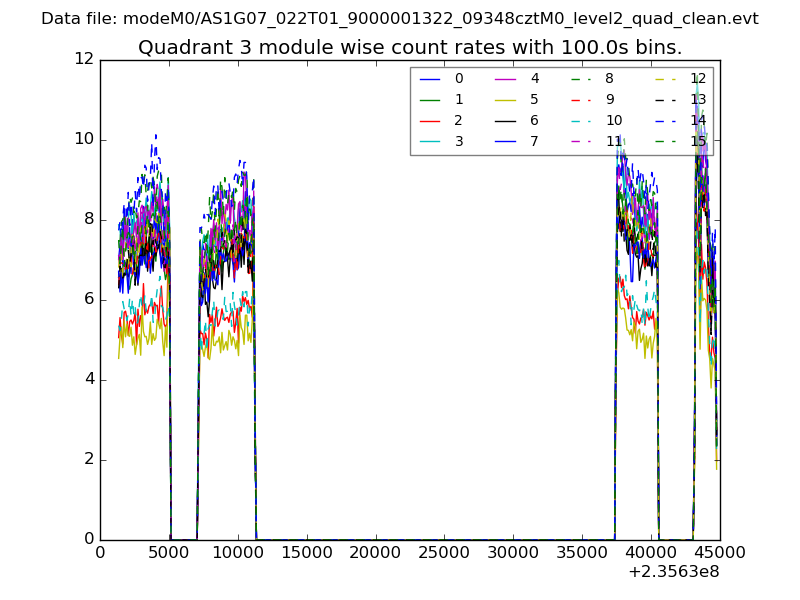 |
 |
| Parameter | Plot |
|---|---|
| CZT HV Monitor | 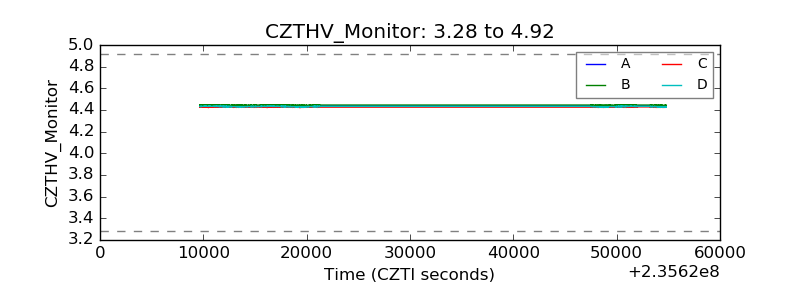 |
| D_VDD | 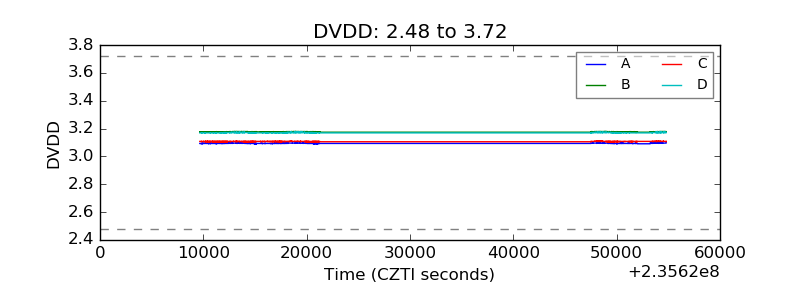 |
| Temperature 1 | 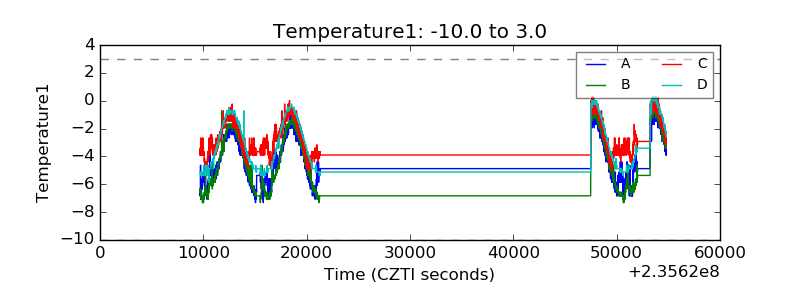 |
| Veto HV Monitor | 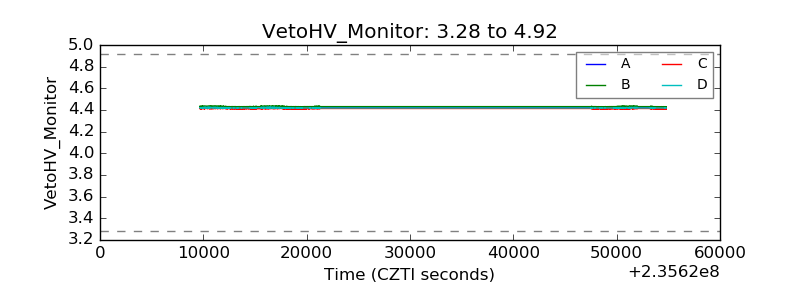 |
| Veto LLD | 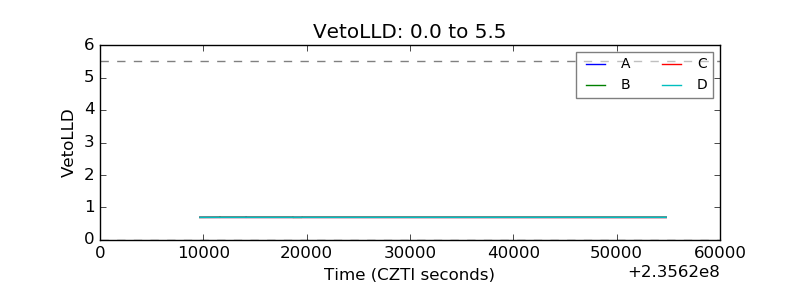 |
| Alpha Counter | 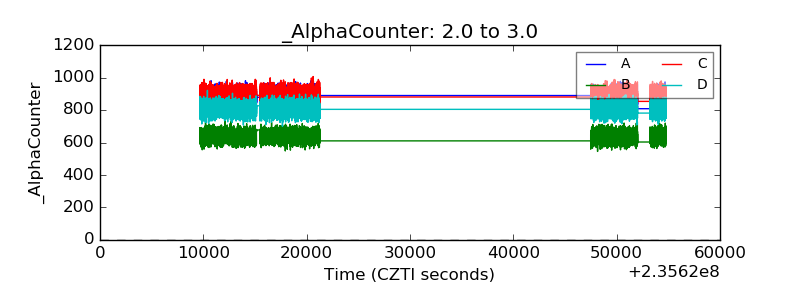 |
| _CPM_Rate | 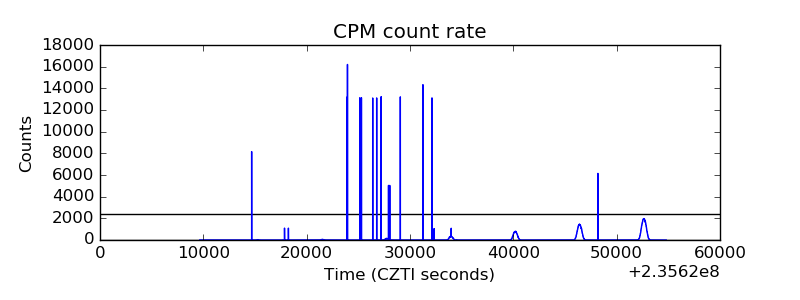 |
| CZT Counter | 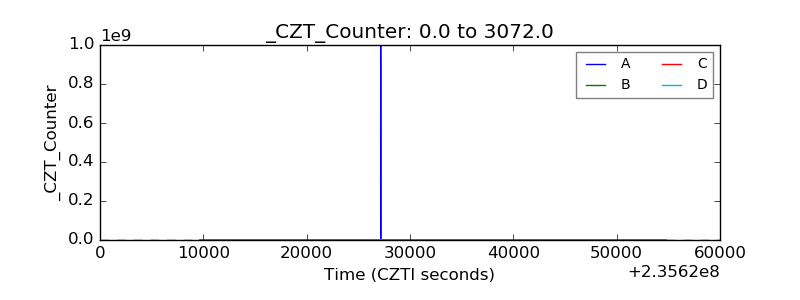 |
| +2.5 Volts monitor |  |
| +5 Volts monitor |  |
| _ROLL_ROT | 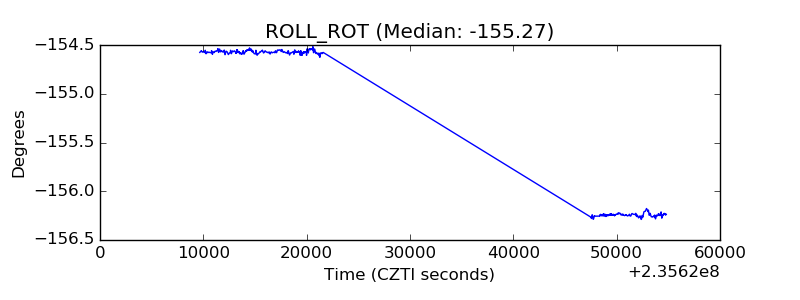 |
| _Roll_DEC | 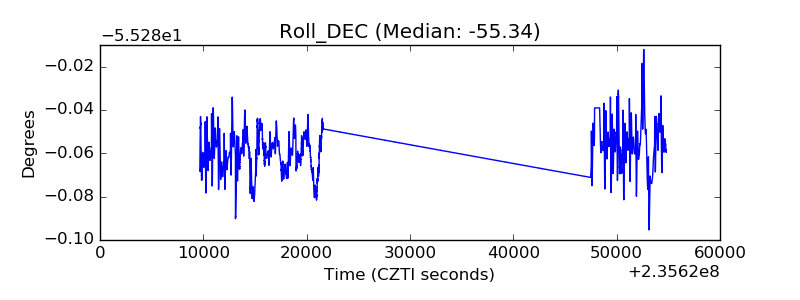 |
| _Roll_RA | 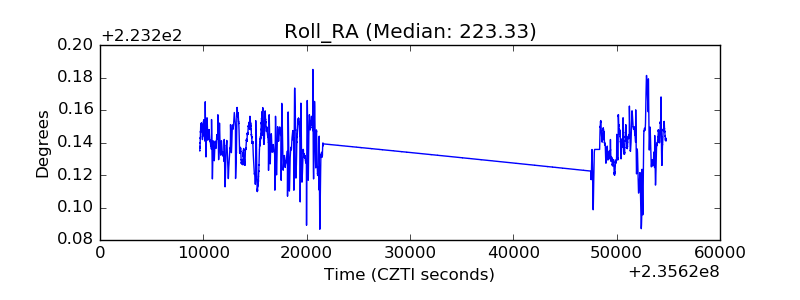 |
| Veto Counter | 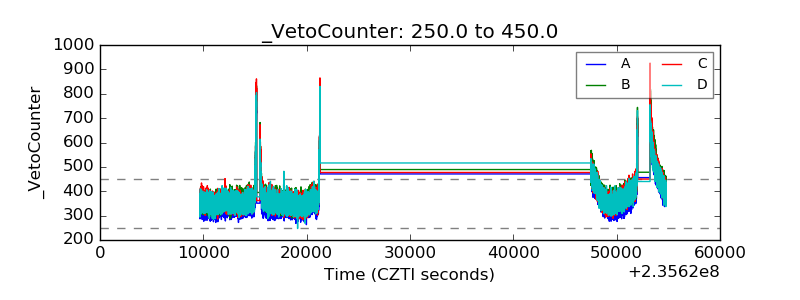 |