| Param | Original file | Final file |
|---|---|---|
| Filename | modeM0/AS1G07_022T01_9000001322_09350cztM0_level2.evt | modeM0/AS1G07_022T01_9000001322_09350cztM0_level2_quad_clean.evt |
| Size (bytes) | 426,551,040 | 83,744,640 |
| Size | 406.8 MB | 79.9 MB |
| Events in quadrant A | 4,140,101 | 519,966 |
| Events in quadrant B | 2,866,266 | 560,577 |
| Events in quadrant C | 2,562,466 | 537,058 |
| Events in quadrant D | 2,966,335 | 524,783 |
| Mode M0 | |||
|---|---|---|---|
| Quadrant | BADHDUFLAG | Total packets | Discarded packets |
| A | 0 | 17938 | 1899 |
| B | 0 | 13101 | 943 |
| C | 0 | 12453 | 864 |
| D | 0 | 13536 | 988 |
| Mode SS | |||
|---|---|---|---|
| Quadrant | BADHDUFLAG | Total packets | Discarded packets |
| A | 0 | 124 | 4 |
| B | 0 | 123 | 9 |
| C | 0 | 124 | 6 |
| D | 0 | 124 | 14 |
| Mode M9 | |||
|---|---|---|---|
| Quadrant | BADHDUFLAG | Total packets | Discarded packets |
| A | 0 | 16 | 1 |
| B | 0 | 16 | 2 |
| C | 0 | 16 | 1 |
| D | 0 | 17 | 0 |
| Quadrant | Total seconds | Saturated seconds | Saturation percentage |
|---|---|---|---|
| A | 5517 | 237 | 4.295813% |
| B | 5642 | 42 | 0.744417% |
| C | 5660 | 10 | 0.176678% |
| D | 5652 | 35 | 0.619250% |
Noise dominated data is calculated using 1-second bins in cleaned event files. If a bin has >2000 counts, and if more than 50% of those come from <1% of pixels, then it is considered to be noise-dominated and hence unusable.
| Quadrant | # 1 sec bins | Bins with >0 counts | Bins with >2000 counts | High rate bins dominated by noise | Noise dominated (total time) | Noise dominated (detector-on time) | Marked lightcurve |
|---|---|---|---|---|---|---|---|
| A | 7393 | 5928 | 99 | 99 | 1.34% | 1.67% | 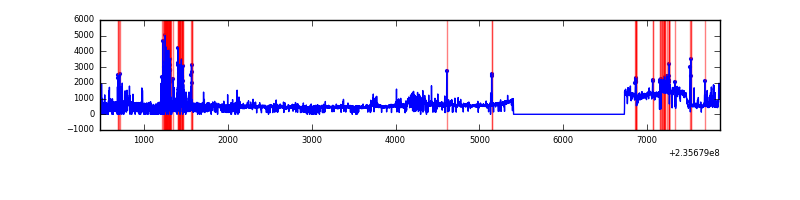 |
| B | 7394 | 5988 | 6 | 6 | 0.08% | 0.10% |  |
| C | 7394 | 5996 | 0 | 0 | 0.00% | 0.00% | 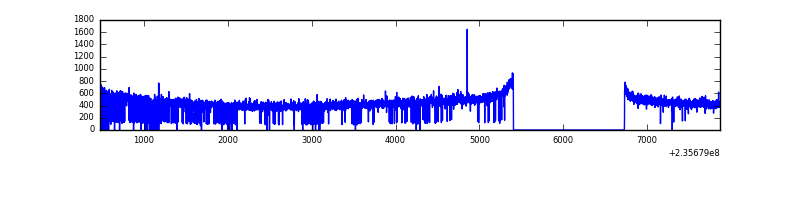 |
| D | 7394 | 5998 | 31 | 31 | 0.42% | 0.52% | 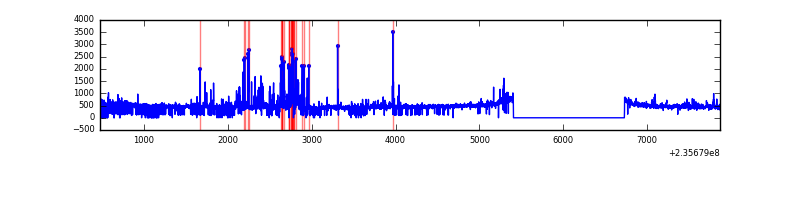 |
Top three noisy pixels from each quadrant. If the there are fewer than three noisy pixels in the level2.evt file, extra rows are filled as -1
| Pixel properties | Quadrant properties | ||||||
|---|---|---|---|---|---|---|---|
| Quadrant | DetID | PixID | Counts | Sigma | Mean | Median | Sigma |
| A | 8 | 5 | 852107 | 6348.5 | 659 | 645 | 134.1 |
| A | 0 | 8 | 541819 | 4034.99 | 659 | 645 | 134.1 |
| A | 1 | 162 | 99441 | 736.62 | 659 | 645 | 134.1 |
| B | 4 | 80 | 71478 | 544.4 | 690 | 676 | 130.1 |
| B | 10 | 245 | 33890 | 255.38 | 690 | 676 | 130.1 |
| B | 0 | 219 | 29758 | 223.61 | 690 | 676 | 130.1 |
| C | 13 | 61 | 5073 | 29.3 | 654 | 655 | 150.8 |
| C | 8 | 222 | 4778 | 27.34 | 654 | 655 | 150.8 |
| C | 10 | 22 | 4387 | 24.75 | 654 | 655 | 150.8 |
| D | 12 | 233 | 224424 | 1296.22 | 650 | 634 | 172.6 |
| D | 8 | 195 | 66201 | 379.77 | 650 | 634 | 172.6 |
| D | 7 | 71 | 54416 | 311.51 | 650 | 634 | 172.6 |
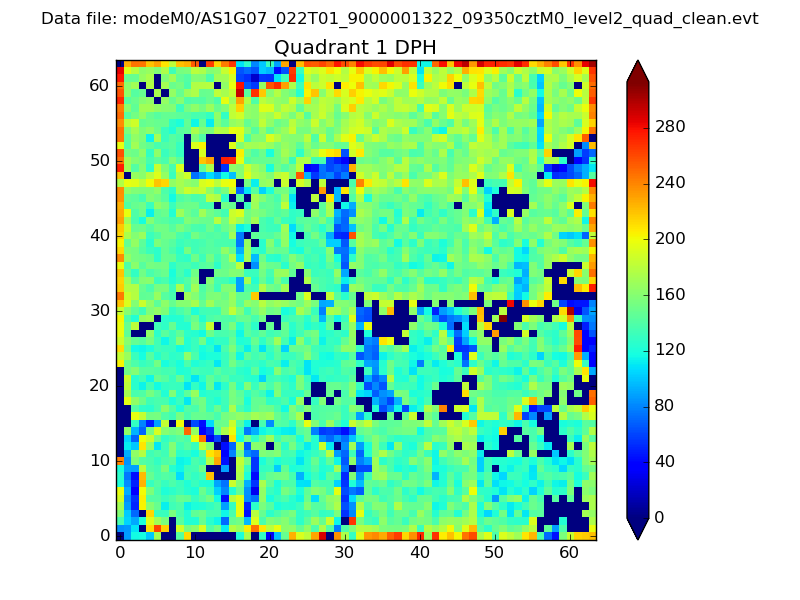
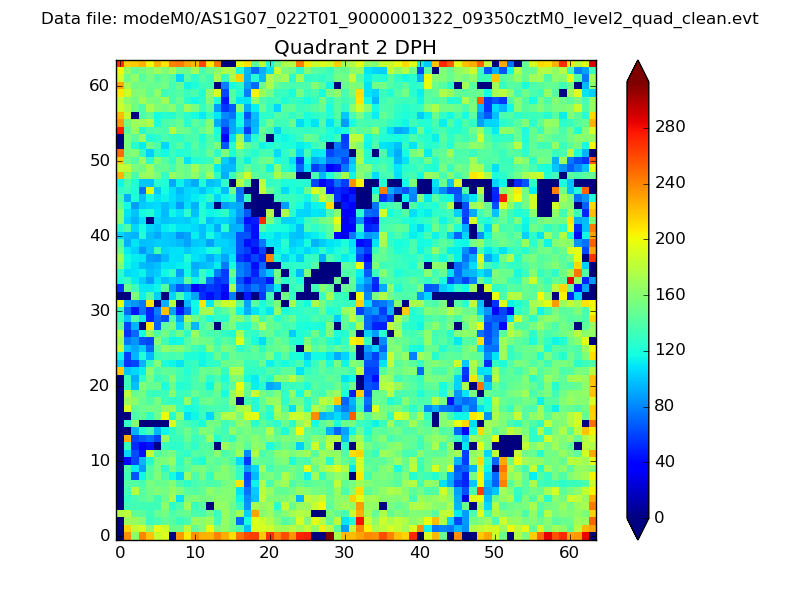
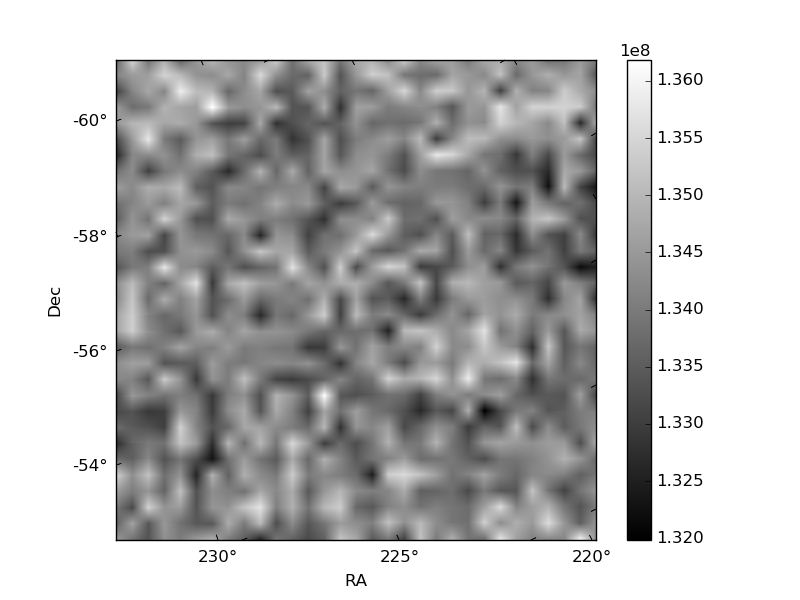
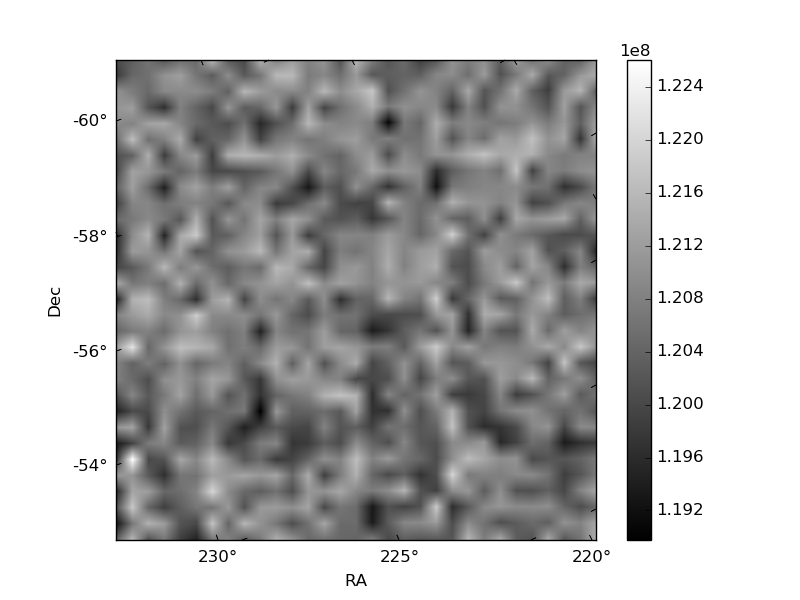
Histogram calculated using DETX and DETY for each event in the final _common_clean file
| Quadrant A | 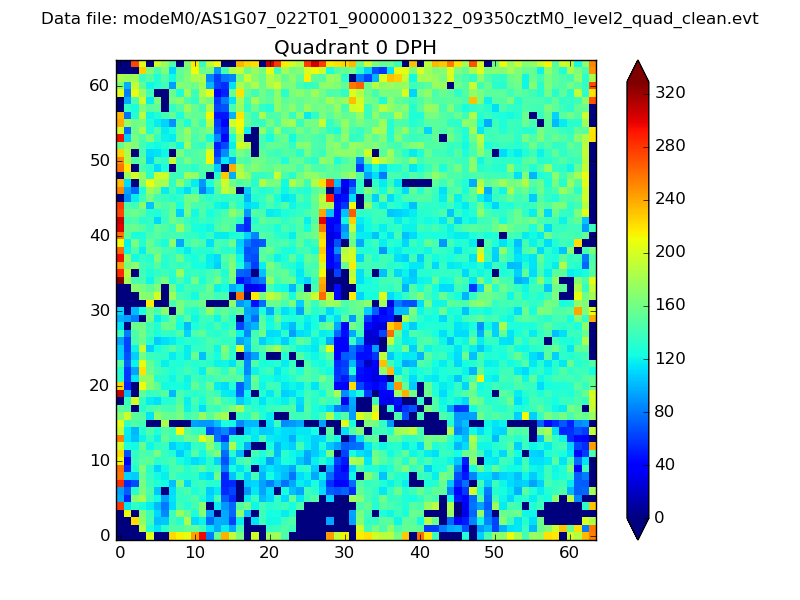 |
 |
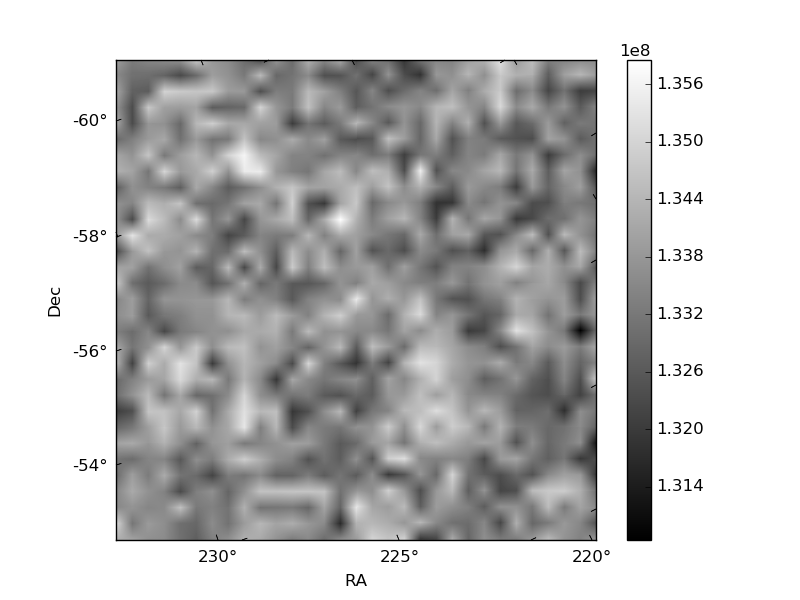
Quadrant B |
|---|---|---|---|
| Quadrant D | 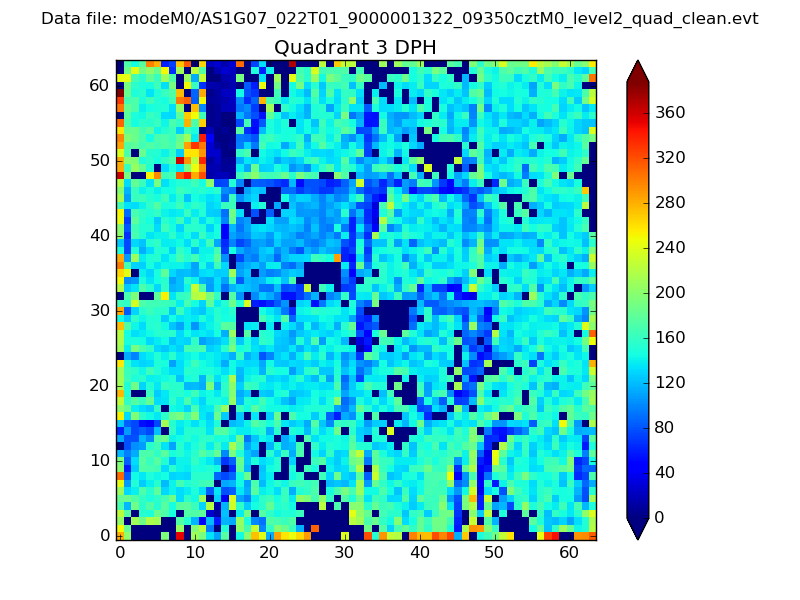 |
 |
Quadrant C |
| Plot type | Count rate plots | Images |
|---|---|---|
| Comparison with Poisson distribution Blue bars denote a histogram of data divided into 1 sec bins. Red curve is a Poisson curve with rate = median count rate of data. |
 |
 |
| Quadrant-wise count rates Data is divided into 100 sec bins |
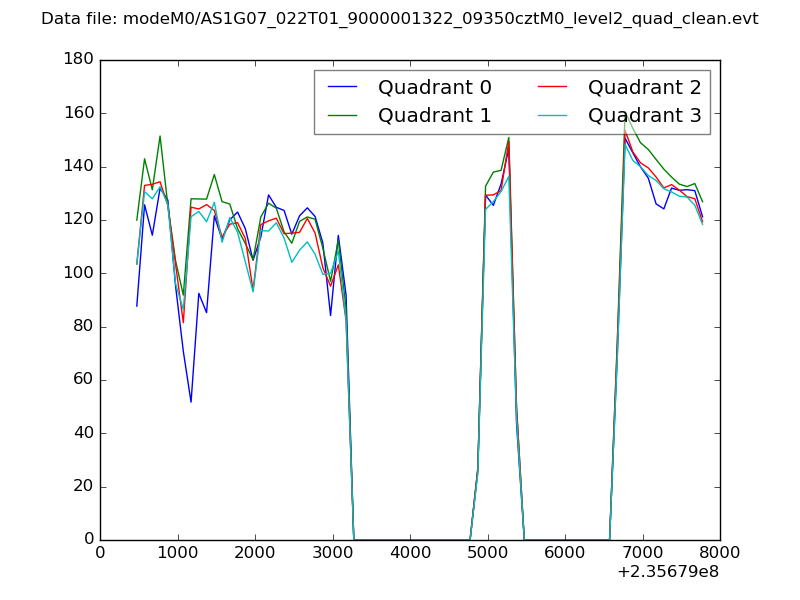 |
|
| Module-wise count rates for Quadrant A Data is divided into 100 sec bins |
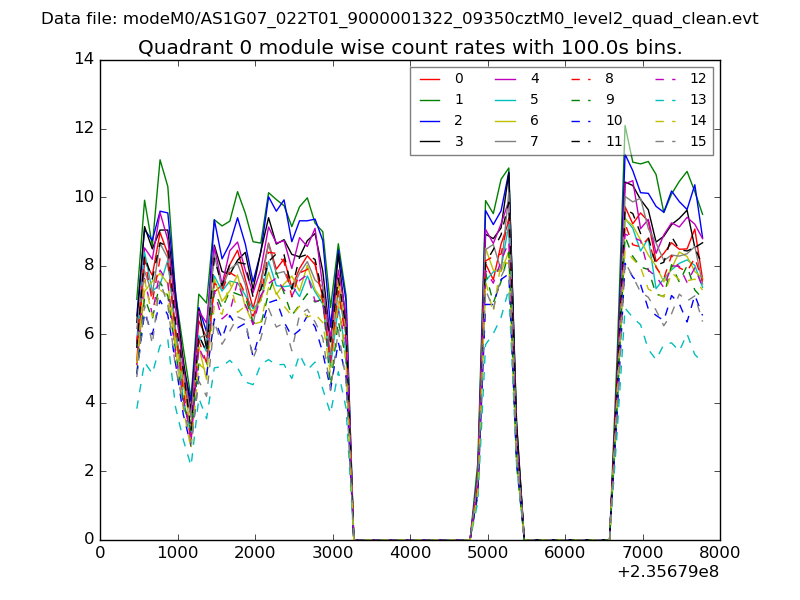 |
 |
| Module-wise count rates for Quadrant B Data is divided into 100 sec bins |
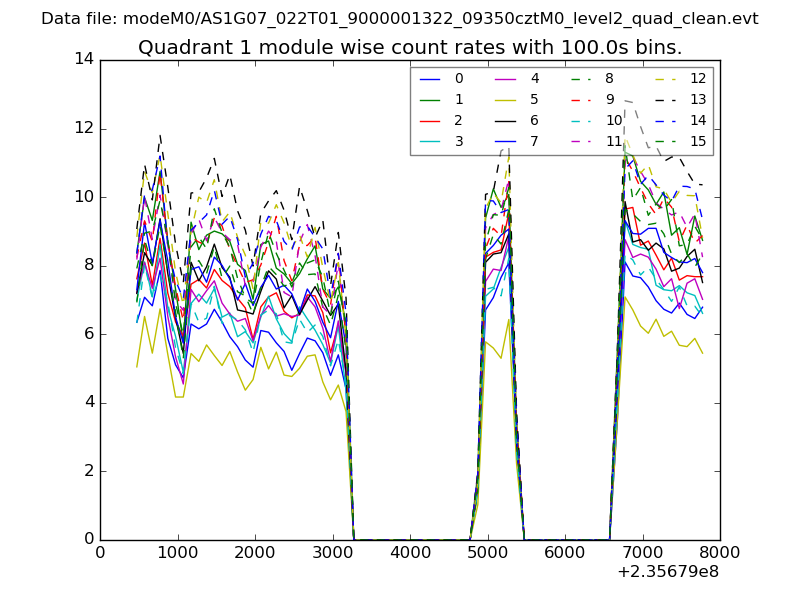 |
 |
| Module-wise count rates for Quadrant C Data is divided into 100 sec bins |
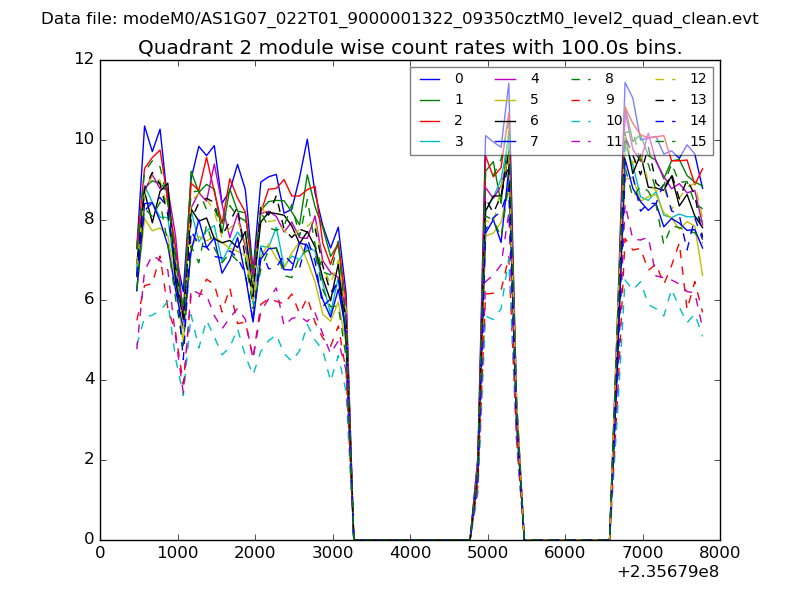 |
 |
| Module-wise count rates for Quadrant D Data is divided into 100 sec bins |
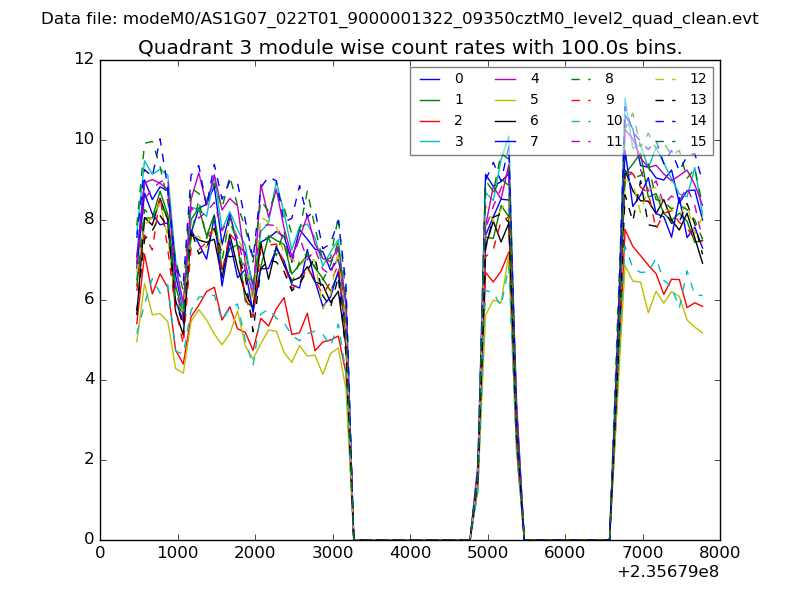 |
 |
| Parameter | Plot |
|---|---|
| CZT HV Monitor | 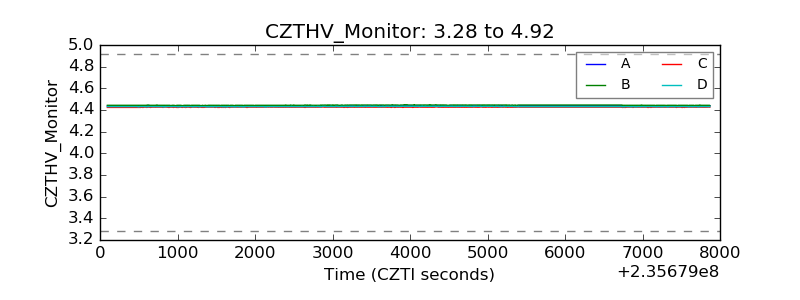 |
| D_VDD | 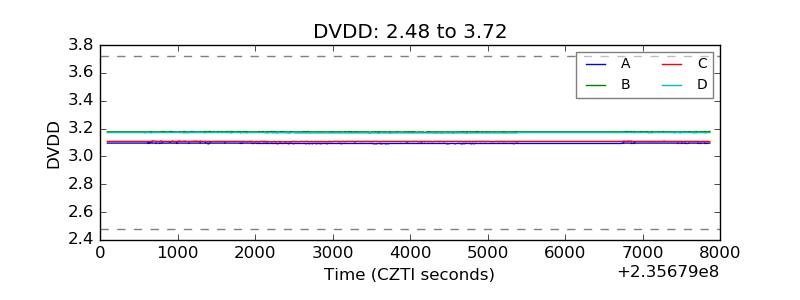 |
| Temperature 1 | 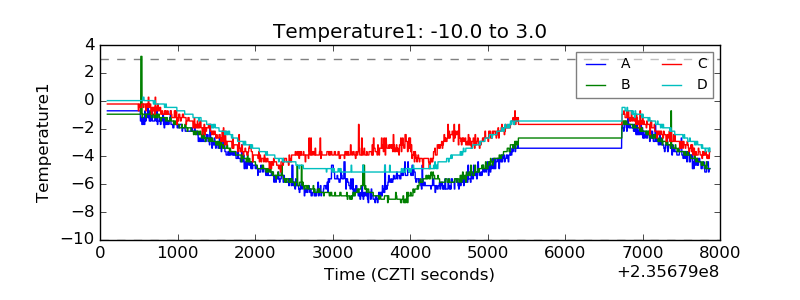 |
| Veto HV Monitor |  |
| Veto LLD | 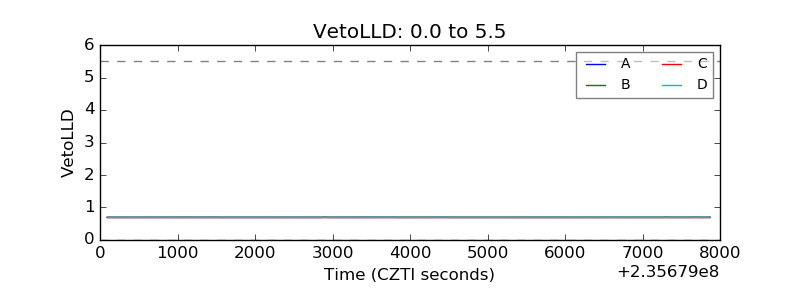 |
| Alpha Counter | 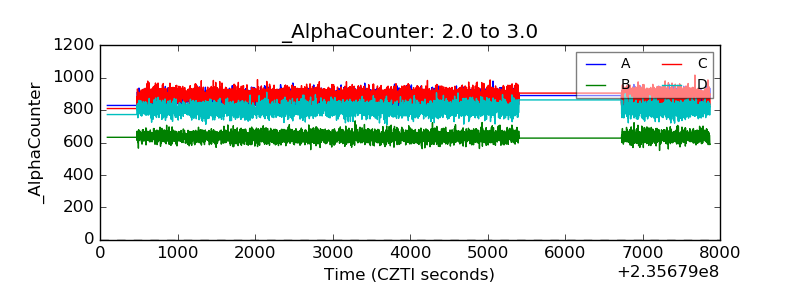 |
| _CPM_Rate | 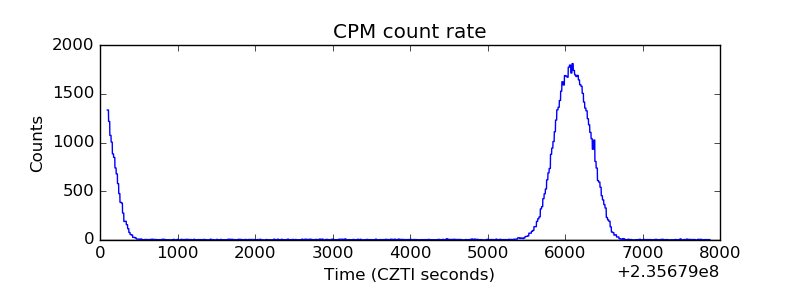 |
| CZT Counter | 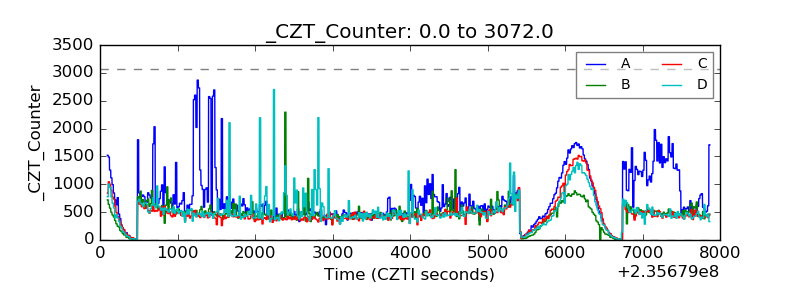 |
| +2.5 Volts monitor |  |
| +5 Volts monitor |  |
| _ROLL_ROT | 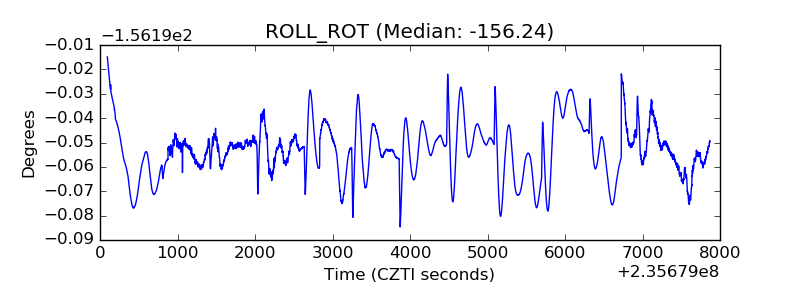 |
| _Roll_DEC | 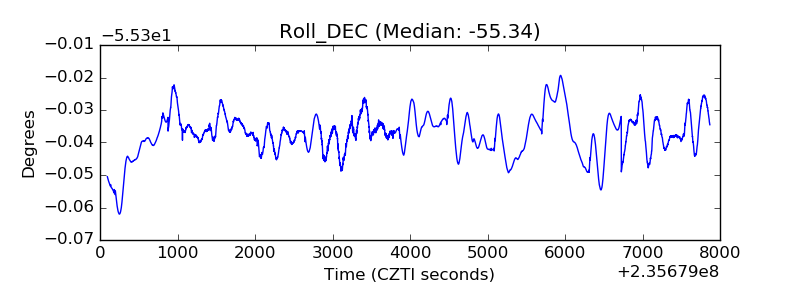 |
| _Roll_RA |  |
| Veto Counter | 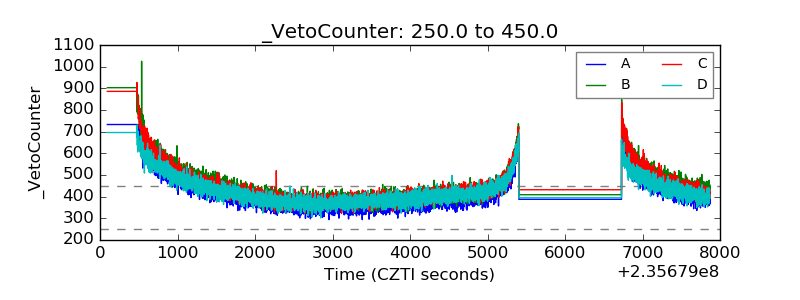 |