| Param | Original file | Final file |
|---|---|---|
| Filename | modeM0/AS1G07_022T01_9000001322_09351cztM0_level2.evt | modeM0/AS1G07_022T01_9000001322_09351cztM0_level2_quad_clean.evt |
| Size (bytes) | 517,561,920 | 89,406,720 |
| Size | 493.6 MB | 85.3 MB |
| Events in quadrant A | 4,161,231 | 576,715 |
| Events in quadrant B | 3,104,849 | 599,097 |
| Events in quadrant C | 2,774,387 | 578,324 |
| Events in quadrant D | 5,219,574 | 527,084 |
| Mode M0 | |||
|---|---|---|---|
| Quadrant | BADHDUFLAG | Total packets | Discarded packets |
| A | 0 | 17047 | 540 |
| B | 0 | 13529 | 284 |
| C | 0 | 12969 | 301 |
| D | 0 | 20495 | 825 |
| Mode SS | |||
|---|---|---|---|
| Quadrant | BADHDUFLAG | Total packets | Discarded packets |
| A | 0 | 132 | 8 |
| B | 0 | 132 | 2 |
| C | 0 | 132 | 0 |
| D | 0 | 132 | 2 |
| Mode M9 | |||
|---|---|---|---|
| Quadrant | BADHDUFLAG | Total packets | Discarded packets |
| A | 0 | 25 | 1 |
| B | 0 | 25 | 1 |
| C | 0 | 25 | 0 |
| D | 0 | 25 | 0 |
| Quadrant | Total seconds | Saturated seconds | Saturation percentage |
|---|---|---|---|
| A | 6083 | 182 | 2.991945% |
| B | 6116 | 56 | 0.915631% |
| C | 6115 | 31 | 0.506950% |
| D | 6047 | 767 | 12.683976% |
Noise dominated data is calculated using 1-second bins in cleaned event files. If a bin has >2000 counts, and if more than 50% of those come from <1% of pixels, then it is considered to be noise-dominated and hence unusable.
| Quadrant | # 1 sec bins | Bins with >0 counts | Bins with >2000 counts | High rate bins dominated by noise | Noise dominated (total time) | Noise dominated (detector-on time) | Marked lightcurve |
|---|---|---|---|---|---|---|---|
| A | 8840 | 6230 | 68 | 68 | 0.77% | 1.09% | 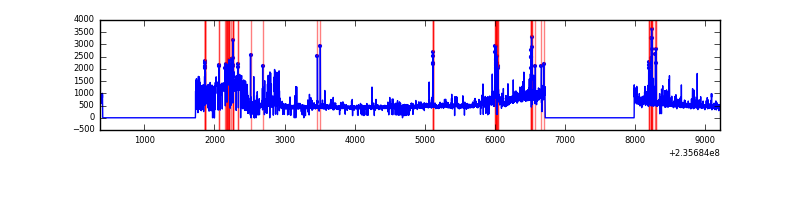 |
| B | 8839 | 6232 | 7 | 7 | 0.08% | 0.11% | 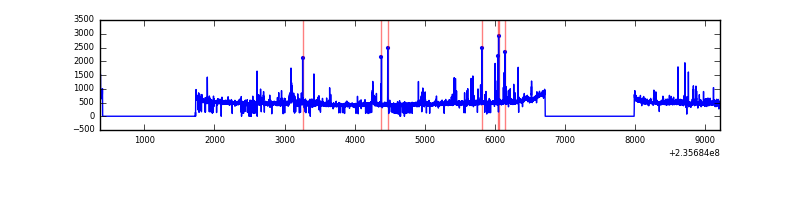 |
| C | 8840 | 6239 | 9 | 9 | 0.10% | 0.14% | 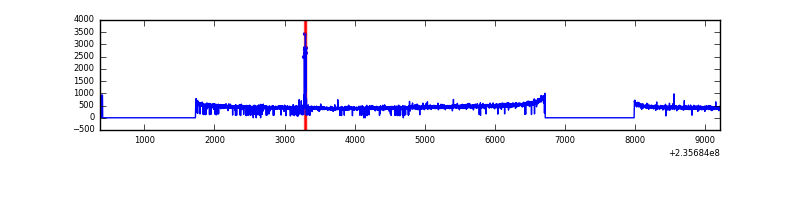 |
| D | 8840 | 6220 | 669 | 669 | 7.57% | 10.76% | 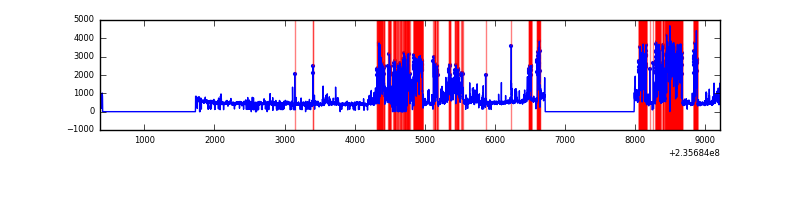 |
Top three noisy pixels from each quadrant. If the there are fewer than three noisy pixels in the level2.evt file, extra rows are filled as -1
| Pixel properties | Quadrant properties | ||||||
|---|---|---|---|---|---|---|---|
| Quadrant | DetID | PixID | Counts | Sigma | Mean | Median | Sigma |
| A | 8 | 5 | 764965 | 5235.23 | 719 | 704 | 146.0 |
| A | 0 | 8 | 493612 | 3376.45 | 719 | 704 | 146.0 |
| A | 13 | 251 | 37311 | 250.76 | 719 | 704 | 146.0 |
| B | 4 | 80 | 60751 | 426.94 | 736 | 720 | 140.6 |
| B | 0 | 219 | 44914 | 314.31 | 736 | 720 | 140.6 |
| B | 10 | 245 | 32556 | 226.42 | 736 | 720 | 140.6 |
| C | 10 | 22 | 41296 | 251.23 | 697 | 698 | 161.6 |
| C | 14 | 67 | 8053 | 45.51 | 697 | 698 | 161.6 |
| C | 13 | 61 | 5294 | 28.44 | 697 | 698 | 161.6 |
| D | 12 | 227 | 2337238 | 13684.17 | 649 | 632 | 170.8 |
| D | 1 | 52 | 195184 | 1139.38 | 649 | 632 | 170.8 |
| D | 7 | 71 | 46428 | 268.2 | 649 | 632 | 170.8 |
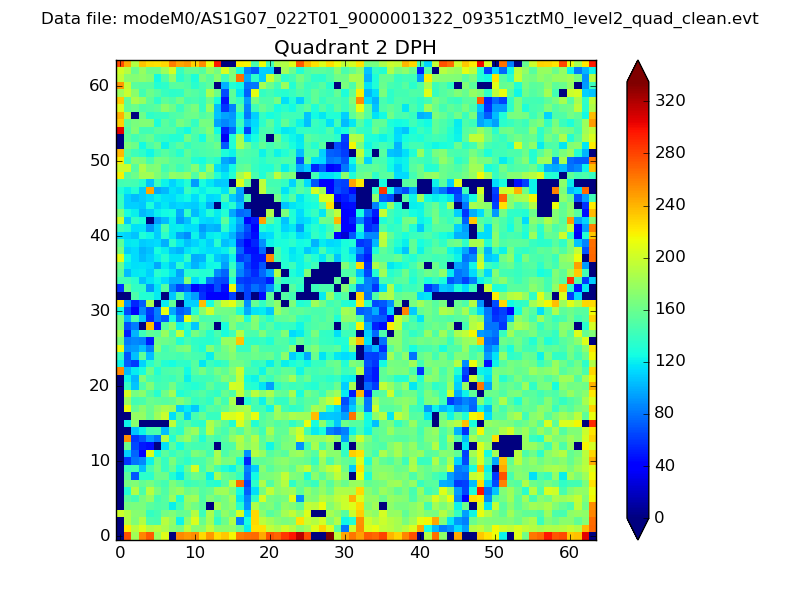
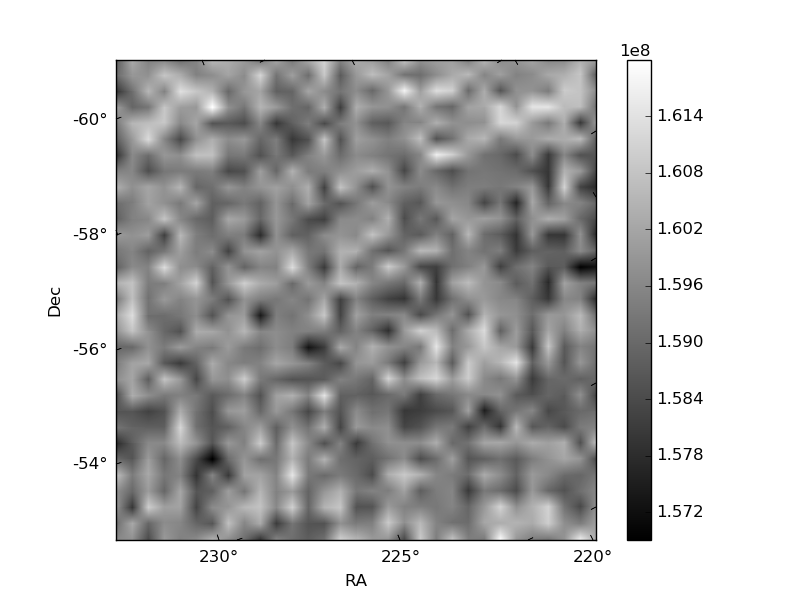
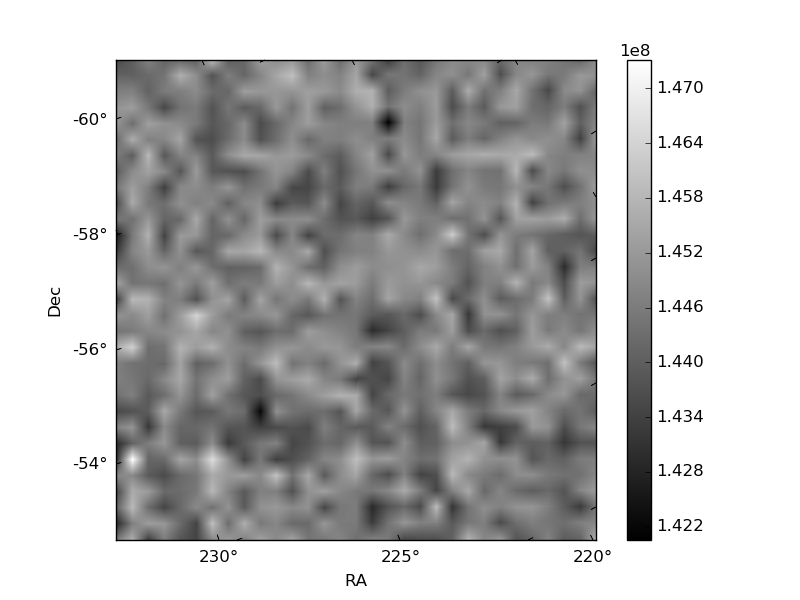
Histogram calculated using DETX and DETY for each event in the final _common_clean file
| Quadrant A | 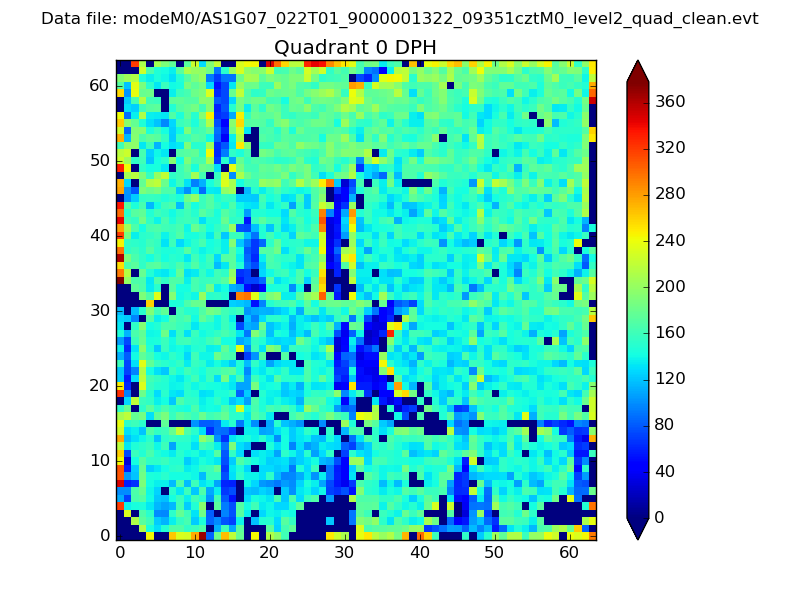 |
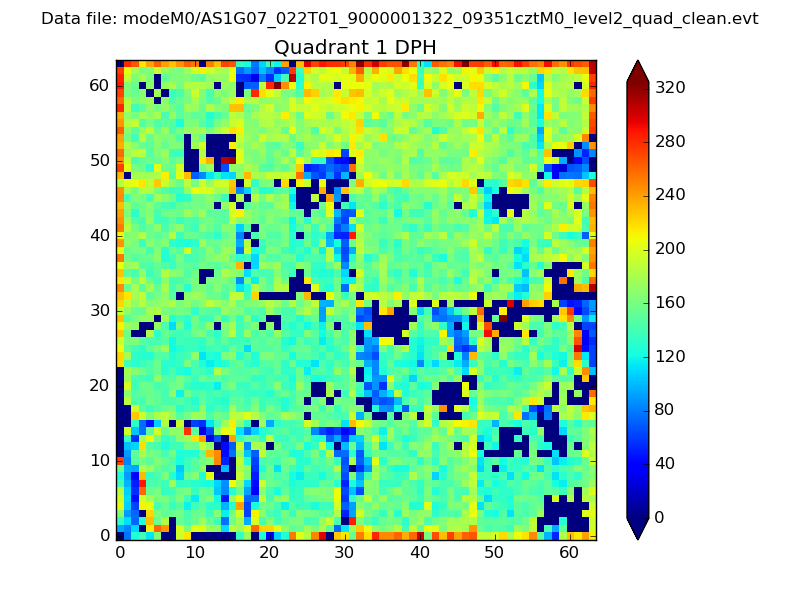 |
Quadrant B |
|---|---|---|---|
| Quadrant D | 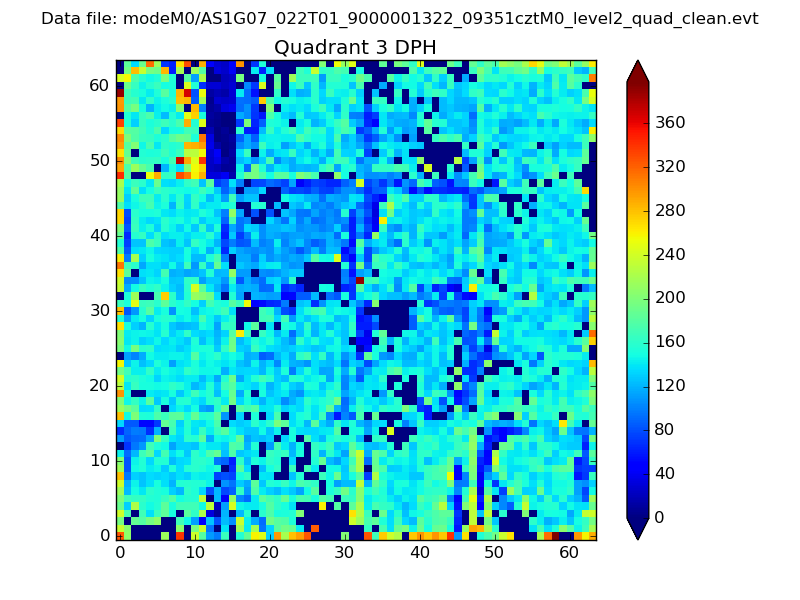 |
 |
Quadrant C |
| Plot type | Count rate plots | Images |
|---|---|---|
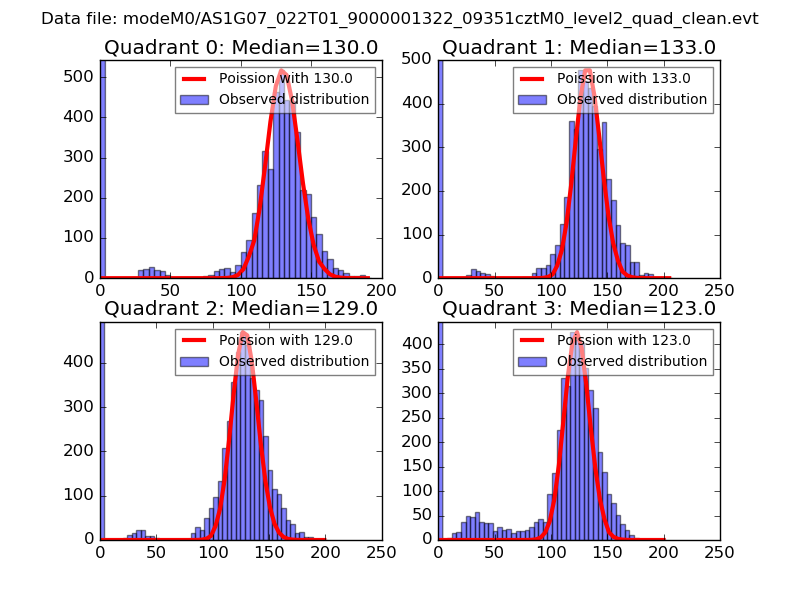
| Comparison with Poisson distribution Blue bars denote a histogram of data divided into 1 sec bins. Red curve is a Poisson curve with rate = median count rate of data. |
 |
 |
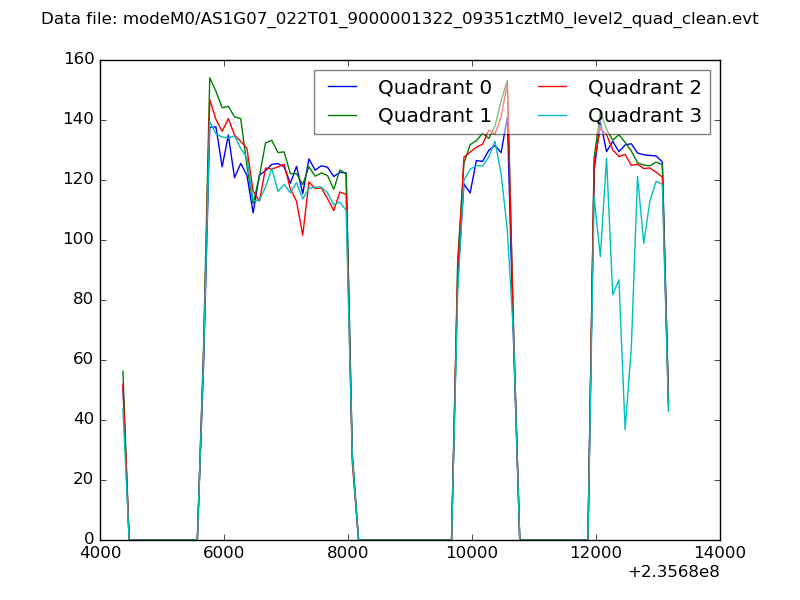
| Quadrant-wise count rates Data is divided into 100 sec bins |
 |
|
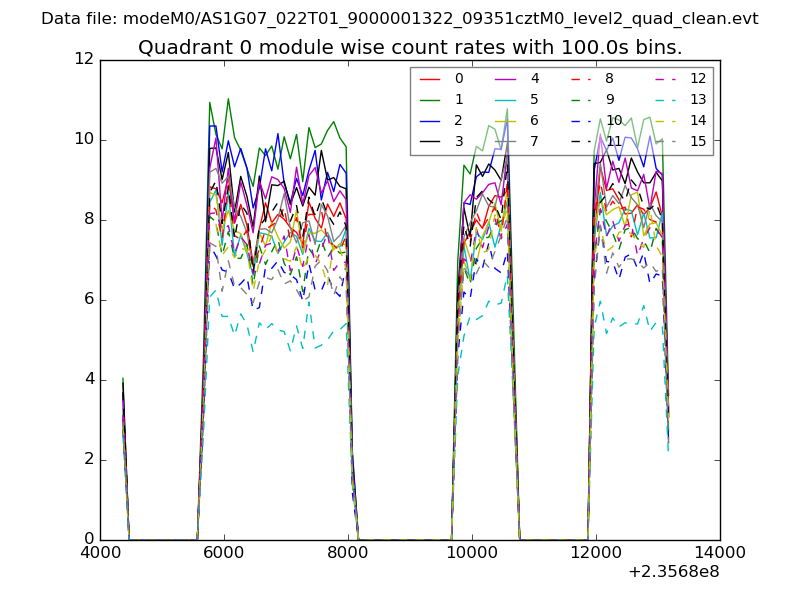
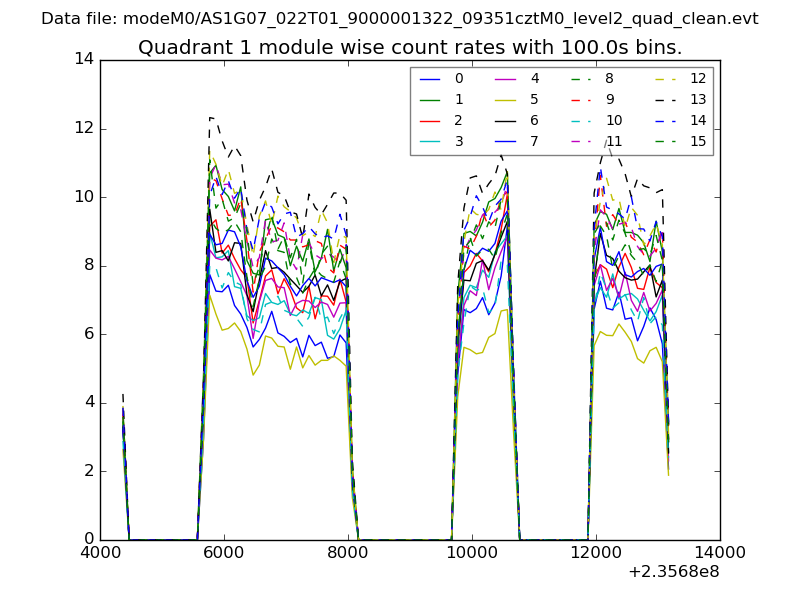
| Module-wise count rates for Quadrant A Data is divided into 100 sec bins |
 |
 |
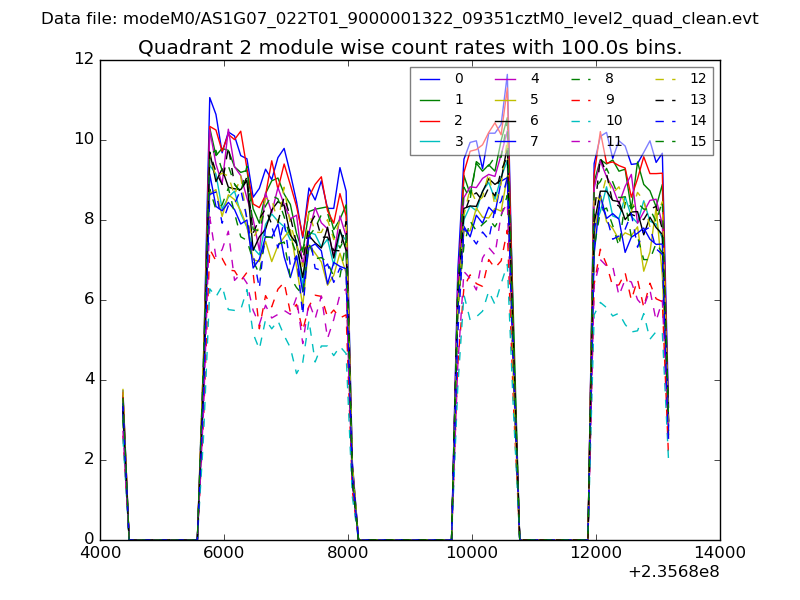
| Module-wise count rates for Quadrant B Data is divided into 100 sec bins |
 |
 |
| Module-wise count rates for Quadrant C Data is divided into 100 sec bins |
 |
 |
| Module-wise count rates for Quadrant D Data is divided into 100 sec bins |
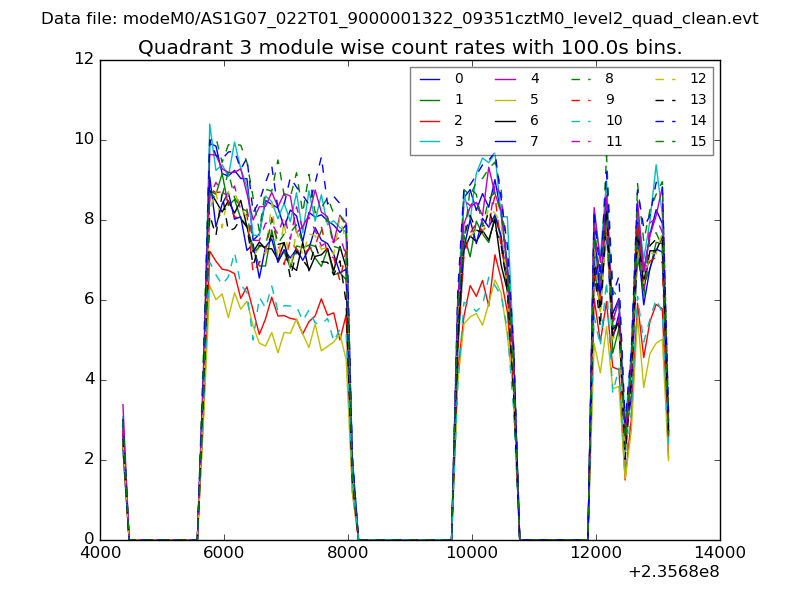 |
 |
| Parameter | Plot |
|---|---|
| CZT HV Monitor | 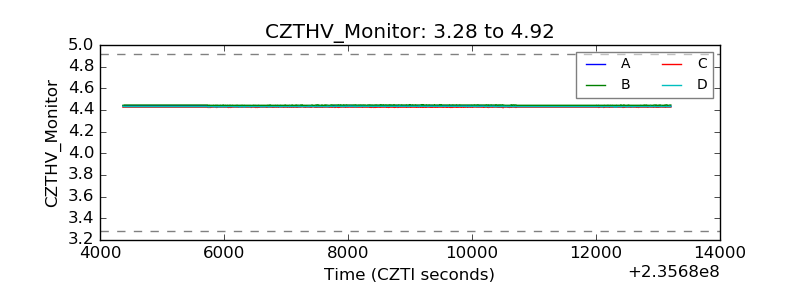 |
| D_VDD | 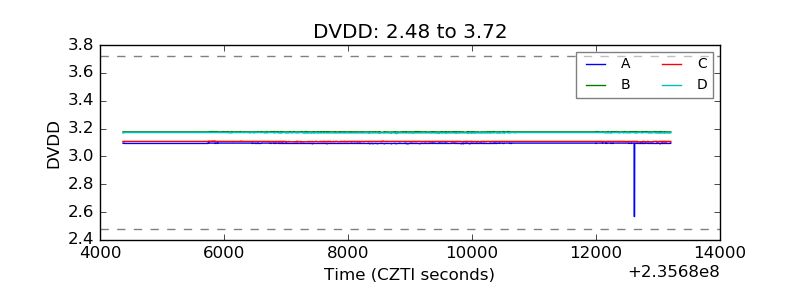 |
| Temperature 1 | 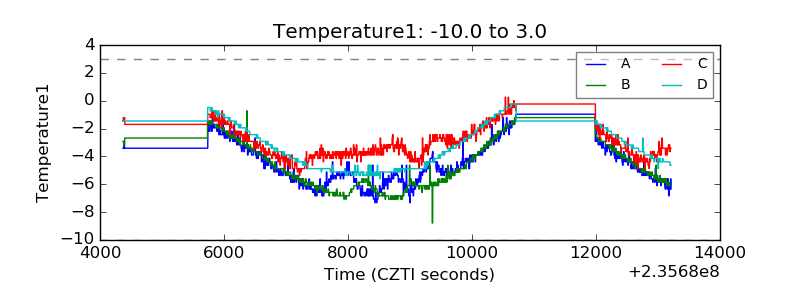 |
| Veto HV Monitor | 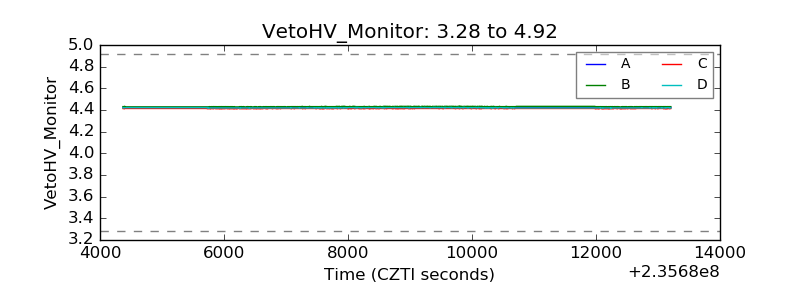 |
| Veto LLD | 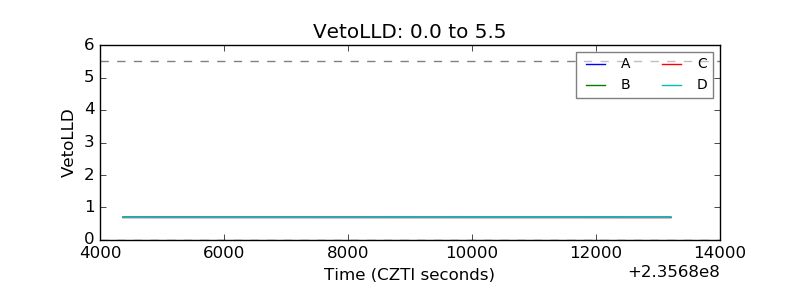 |
| Alpha Counter | 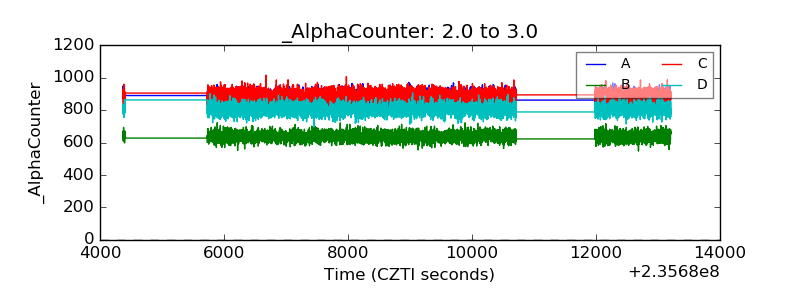 |
| _CPM_Rate | 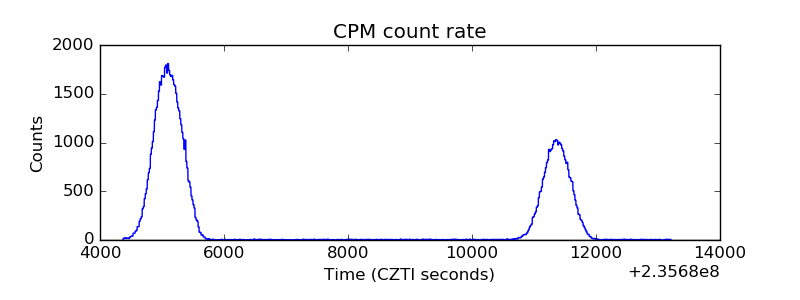 |
| CZT Counter | 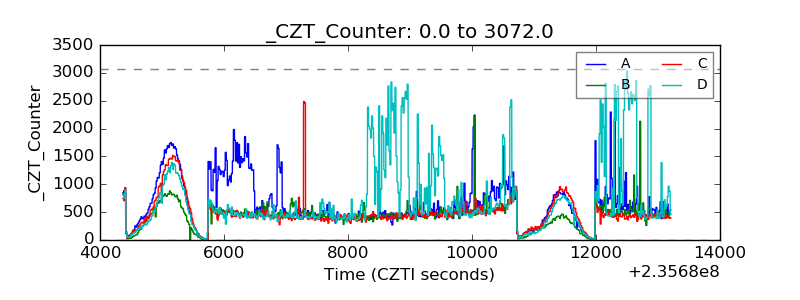 |
| +2.5 Volts monitor |  |
| +5 Volts monitor |  |
| _ROLL_ROT | 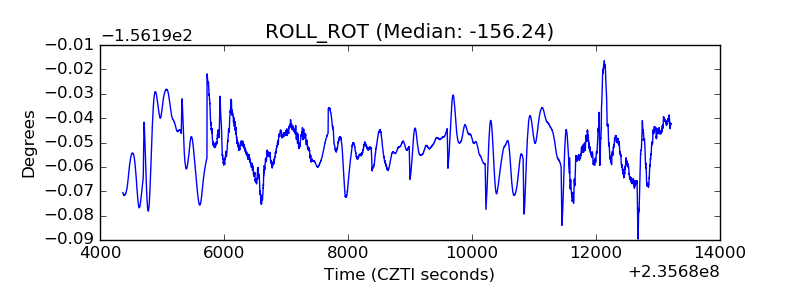 |
| _Roll_DEC | 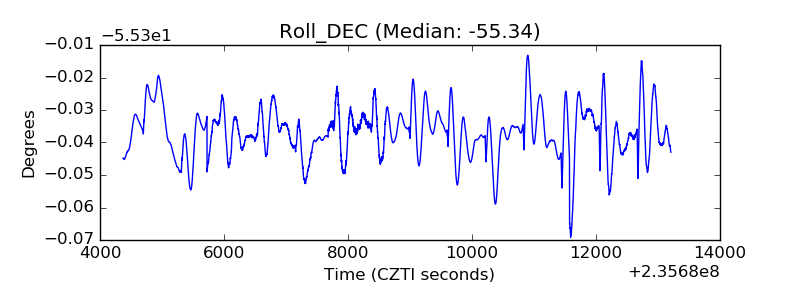 |
| _Roll_RA | 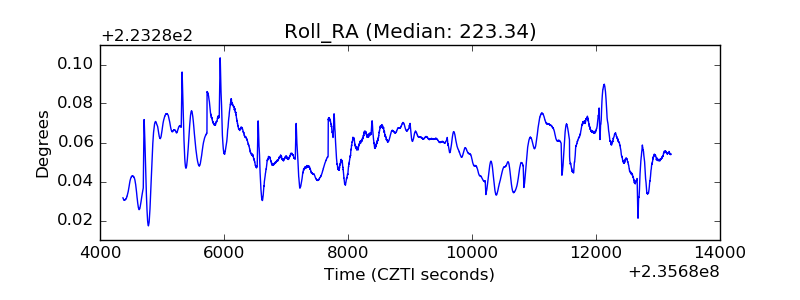 |
| Veto Counter | 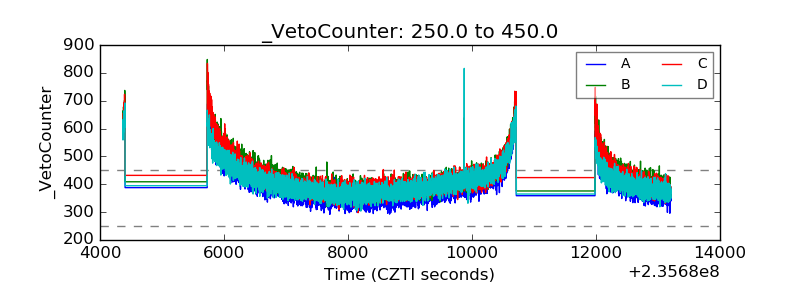 |