| Param | Original file | Final file |
|---|---|---|
| Filename | modeM0/AS1G07_022T01_9000001322_09353cztM0_level2.evt | modeM0/AS1G07_022T01_9000001322_09353cztM0_level2_quad_clean.evt |
| Size (bytes) | 2,869,735,680 | 511,283,520 |
| Size | 2.7 GB | 487.6 MB |
| Events in quadrant A | 25,231,105 | 3,203,426 |
| Events in quadrant B | 18,336,701 | 3,354,375 |
| Events in quadrant C | 17,989,991 | 3,260,597 |
| Events in quadrant D | 22,886,255 | 3,155,959 |
| Mode M0 | |||
|---|---|---|---|
| Quadrant | BADHDUFLAG | Total packets | Discarded packets |
| A | 0 | 113726 | 14110 |
| B | 0 | 90127 | 11150 |
| C | 0 | 90179 | 10223 |
| D | 0 | 111135 | 17942 |
| Mode SS | |||
|---|---|---|---|
| Quadrant | BADHDUFLAG | Total packets | Discarded packets |
| A | 0 | 854 | 97 |
| B | 0 | 853 | 97 |
| C | 0 | 853 | 98 |
| D | 0 | 853 | 95 |
| Mode M9 | |||
|---|---|---|---|
| Quadrant | BADHDUFLAG | Total packets | Discarded packets |
| A | 0 | 88 | 10 |
| B | 0 | 87 | 2 |
| C | 0 | 87 | 4 |
| D | 0 | 87 | 5 |
| Quadrant | Total seconds | Saturated seconds | Saturation percentage |
|---|---|---|---|
| A | 36289 | 1892 | 5.213701% |
| B | 36660 | 339 | 0.924714% |
| C | 36779 | 550 | 1.495419% |
| D | 36279 | 1316 | 3.627443% |
Noise dominated data is calculated using 1-second bins in cleaned event files. If a bin has >2000 counts, and if more than 50% of those come from <1% of pixels, then it is considered to be noise-dominated and hence unusable.
| Quadrant | # 1 sec bins | Bins with >0 counts | Bins with >2000 counts | High rate bins dominated by noise | Noise dominated (total time) | Noise dominated (detector-on time) | Marked lightcurve |
|---|---|---|---|---|---|---|---|
| A | 50703 | 37743 | 1139 | 1139 | 2.25% | 3.02% | 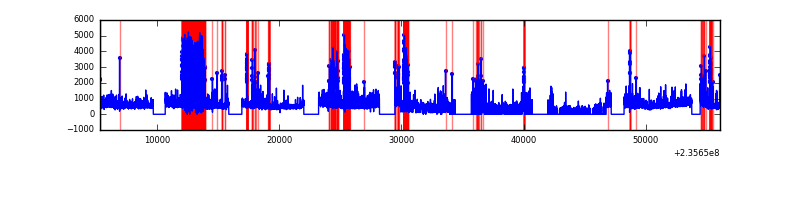 |
| B | 50703 | 38049 | 37 | 37 | 0.07% | 0.10% | 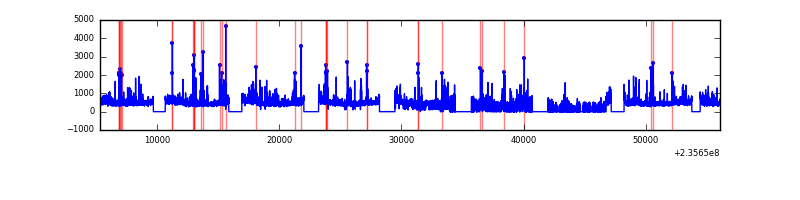 |
| C | 50703 | 38171 | 334 | 334 | 0.66% | 0.88% | 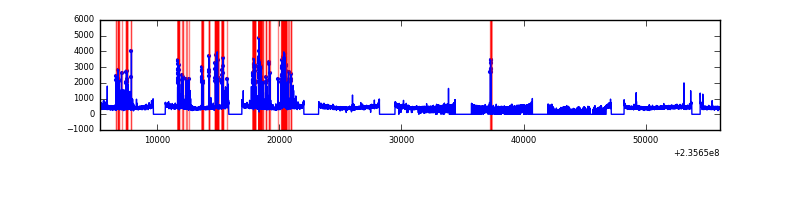 |
| D | 50703 | 37639 | 910 | 910 | 1.79% | 2.42% | 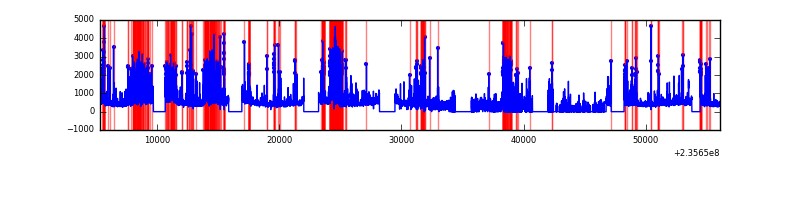 |
Top three noisy pixels from each quadrant. If the there are fewer than three noisy pixels in the level2.evt file, extra rows are filled as -1
| Pixel properties | Quadrant properties | ||||||
|---|---|---|---|---|---|---|---|
| Quadrant | DetID | PixID | Counts | Sigma | Mean | Median | Sigma |
| A | 8 | 5 | 7031843 | 8427.06 | 4163 | 4080 | 834.0 |
| A | 1 | 162 | 659008 | 785.33 | 4163 | 4080 | 834.0 |
| A | 0 | 8 | 373031 | 442.41 | 4163 | 4080 | 834.0 |
| B | 0 | 214 | 384326 | 475.84 | 4308 | 4208 | 798.8 |
| B | 4 | 80 | 325426 | 402.11 | 4308 | 4208 | 798.8 |
| B | 0 | 219 | 281396 | 346.99 | 4308 | 4208 | 798.8 |
| C | 4 | 254 | 1821992 | 1942.62 | 4107 | 4116 | 935.8 |
| C | 10 | 22 | 79067 | 80.09 | 4107 | 4116 | 935.8 |
| C | 13 | 61 | 31493 | 29.26 | 4107 | 4116 | 935.8 |
| D | 1 | 52 | 3080422 | 2879.65 | 4017 | 3923 | 1068.4 |
| D | 12 | 227 | 2102621 | 1964.41 | 4017 | 3923 | 1068.4 |
| D | 7 | 71 | 670192 | 623.64 | 4017 | 3923 | 1068.4 |
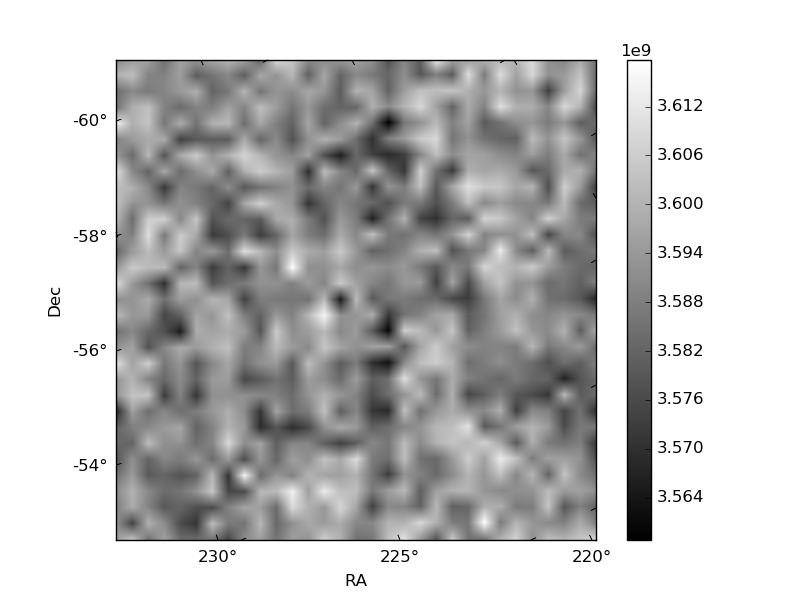
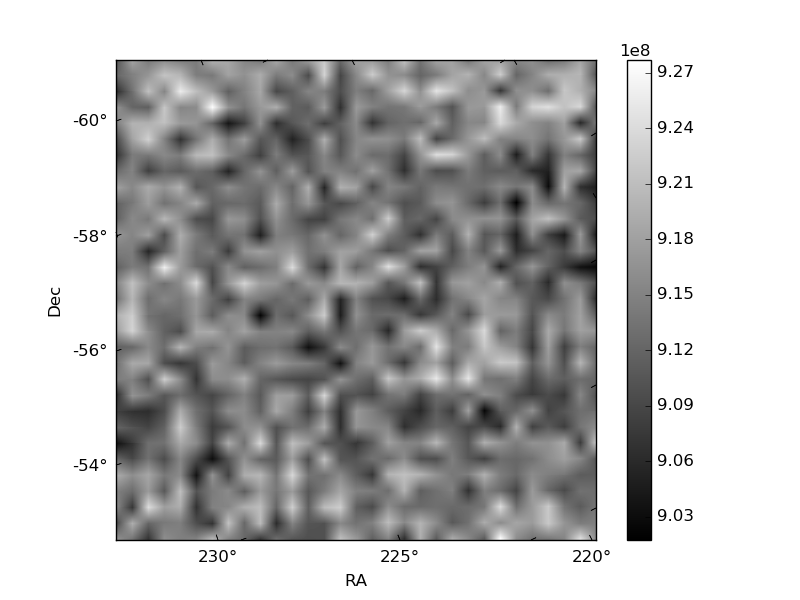
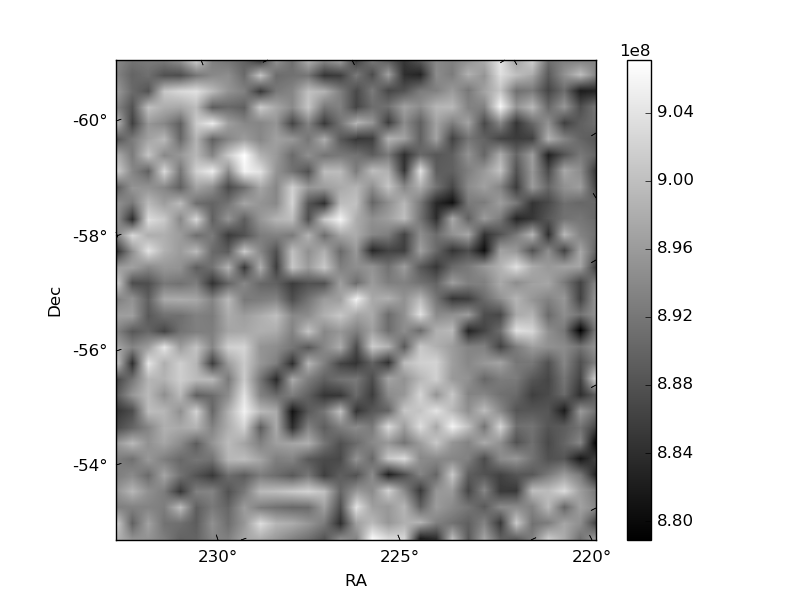
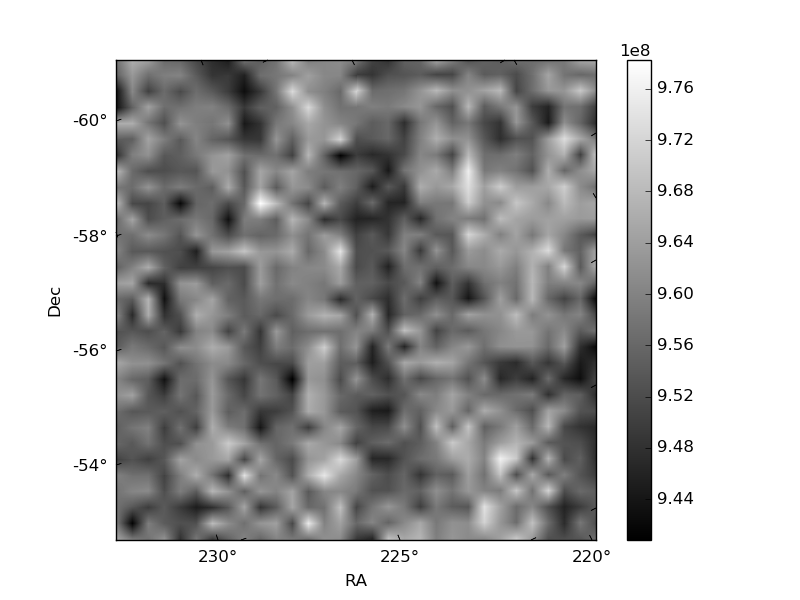
Histogram calculated using DETX and DETY for each event in the final _common_clean file
| Quadrant A | 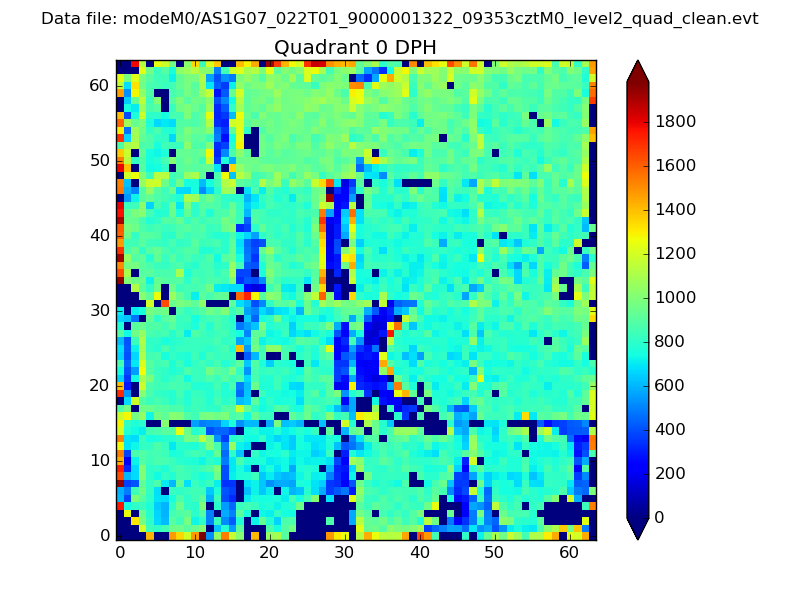 |
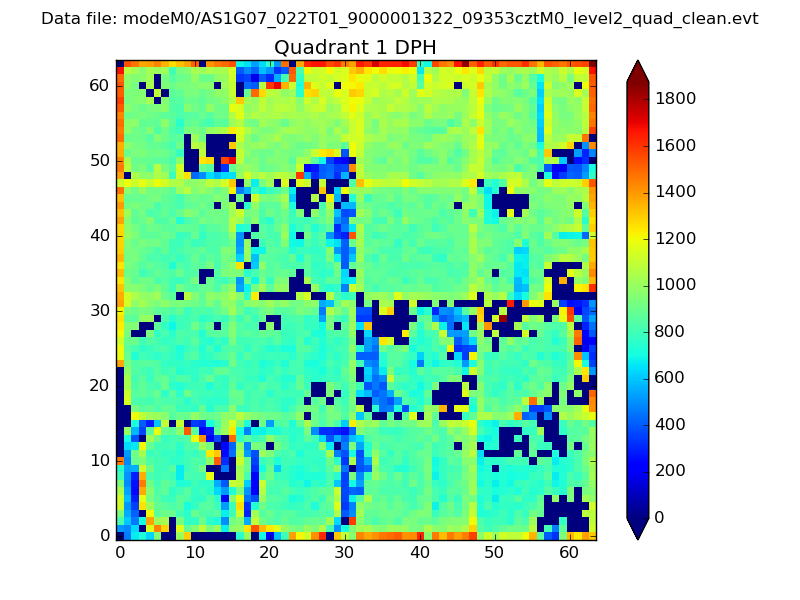 |
Quadrant B |
|---|---|---|---|
| Quadrant D | 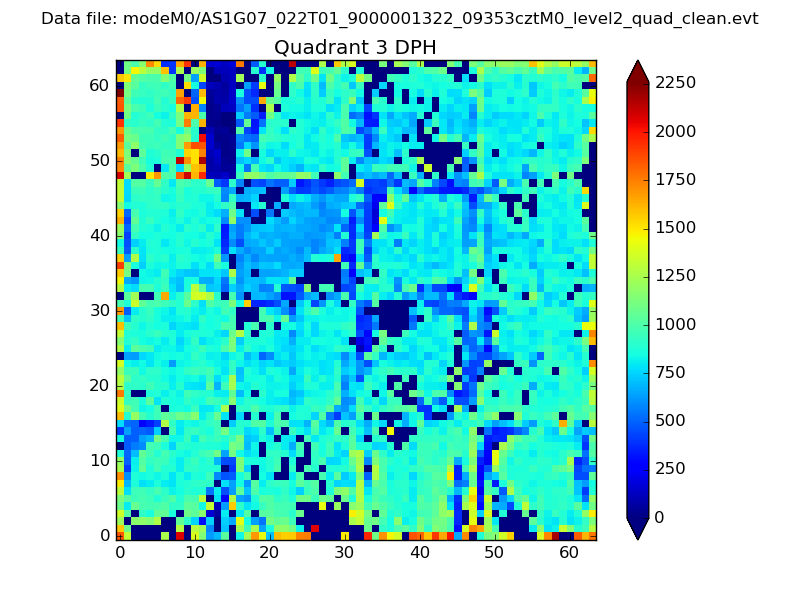 |
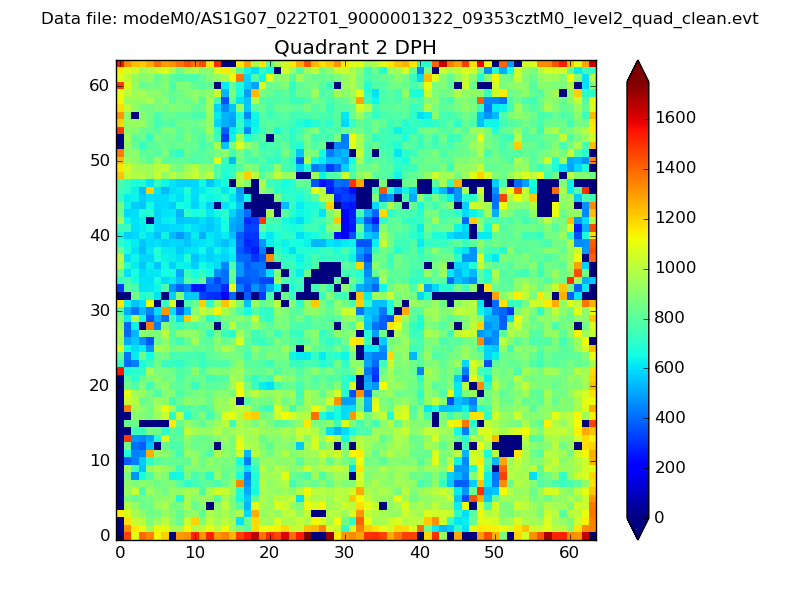 |
Quadrant C |
| Plot type | Count rate plots | Images |
|---|---|---|
| Comparison with Poisson distribution Blue bars denote a histogram of data divided into 1 sec bins. Red curve is a Poisson curve with rate = median count rate of data. |
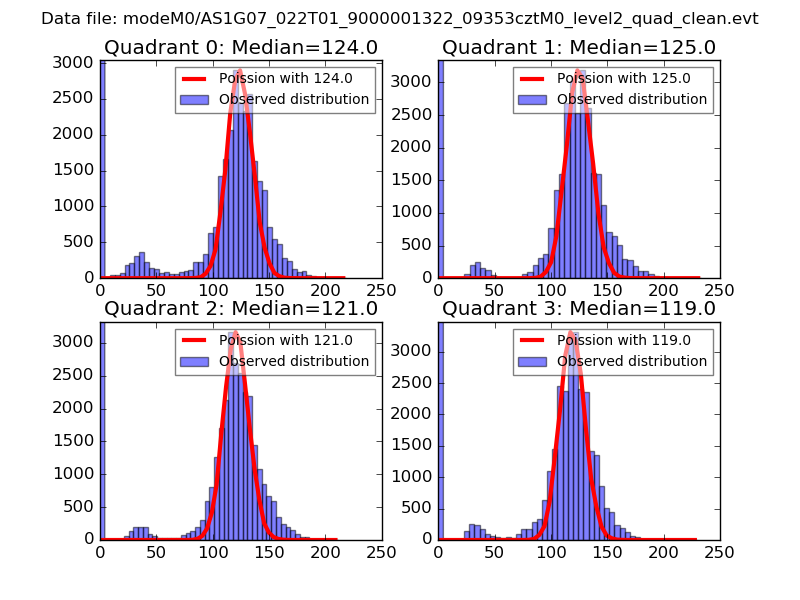 |
 |
| Quadrant-wise count rates Data is divided into 100 sec bins |
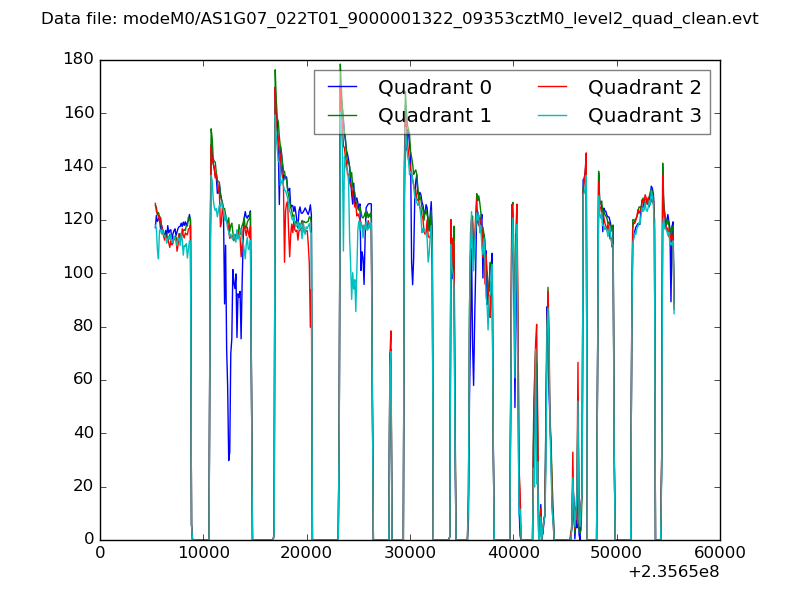 |
|
| Module-wise count rates for Quadrant A Data is divided into 100 sec bins |
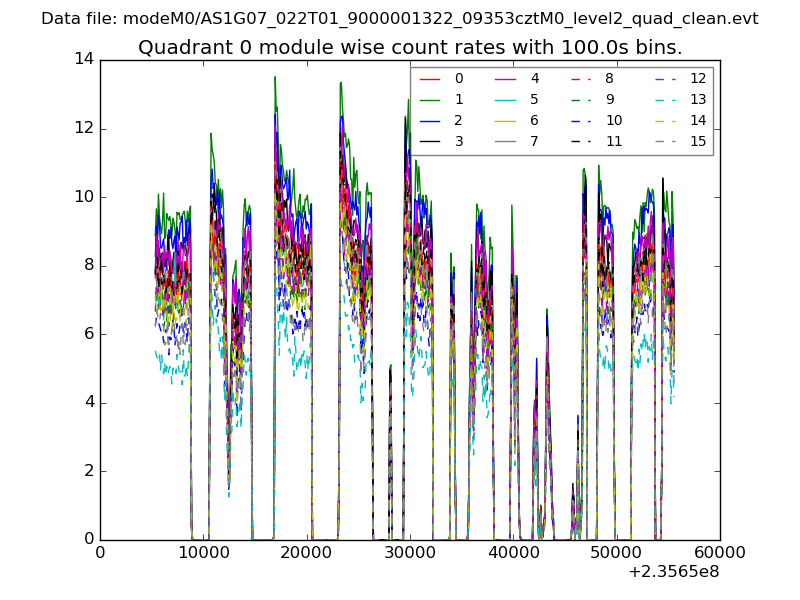 |
 |
| Module-wise count rates for Quadrant B Data is divided into 100 sec bins |
 |
 |
| Module-wise count rates for Quadrant C Data is divided into 100 sec bins |
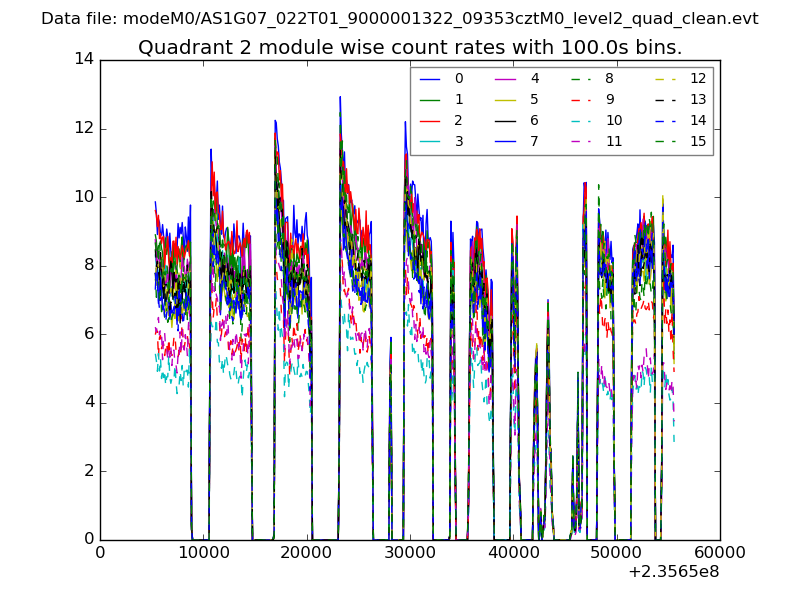 |
 |
| Module-wise count rates for Quadrant D Data is divided into 100 sec bins |
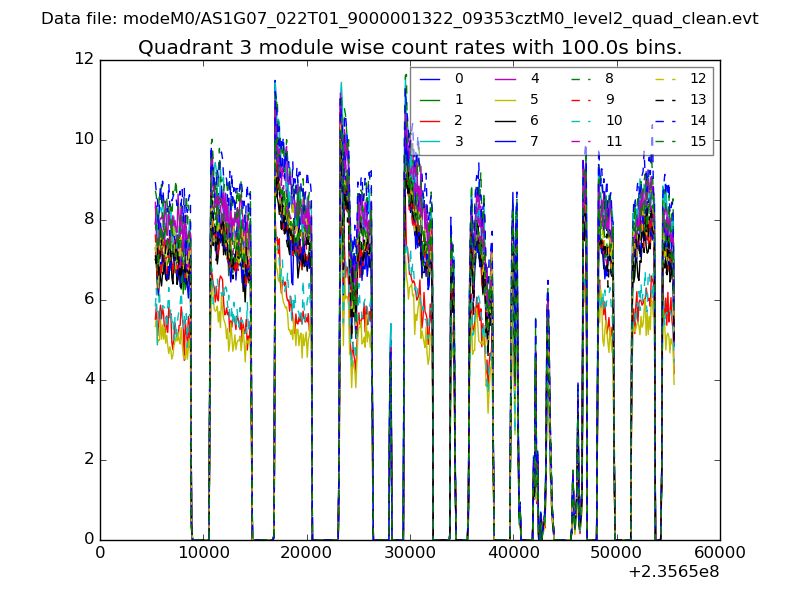 |
 |
| Parameter | Plot |
|---|---|
| CZT HV Monitor | 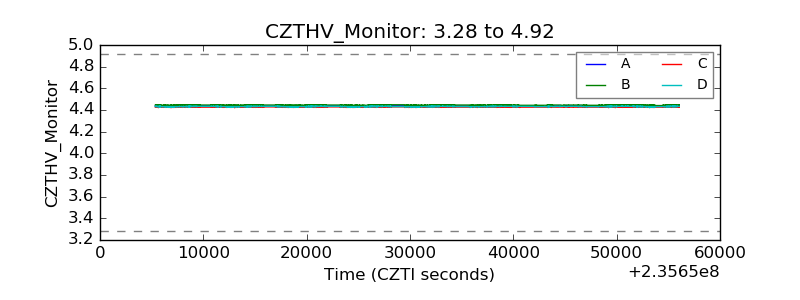 |
| D_VDD | 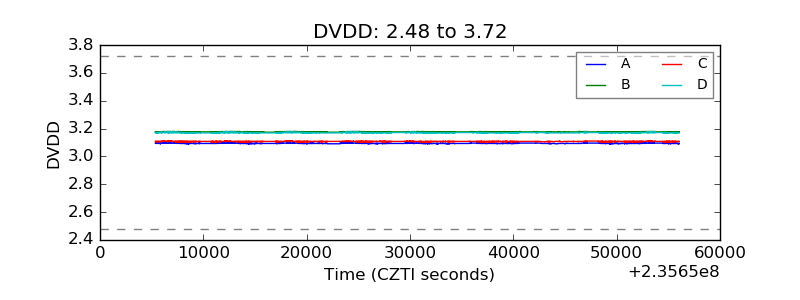 |
| Temperature 1 | 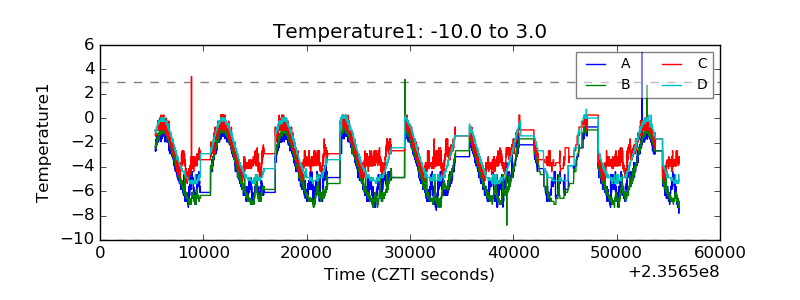 |
| Veto HV Monitor | 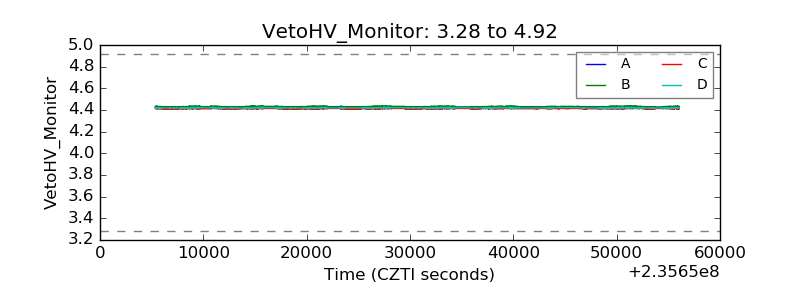 |
| Veto LLD | 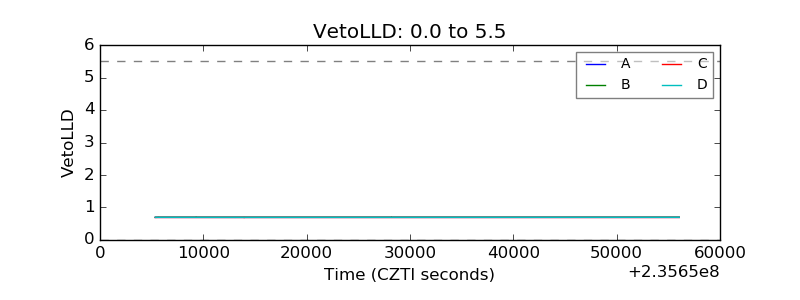 |
| Alpha Counter | 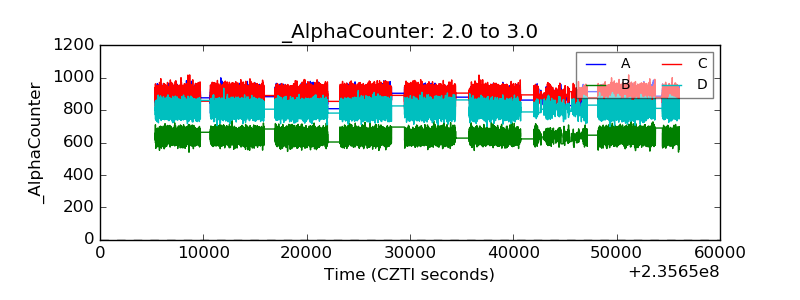 |
| _CPM_Rate | 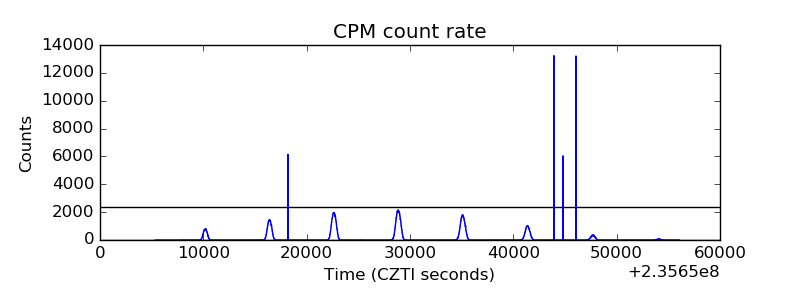 |
| CZT Counter | 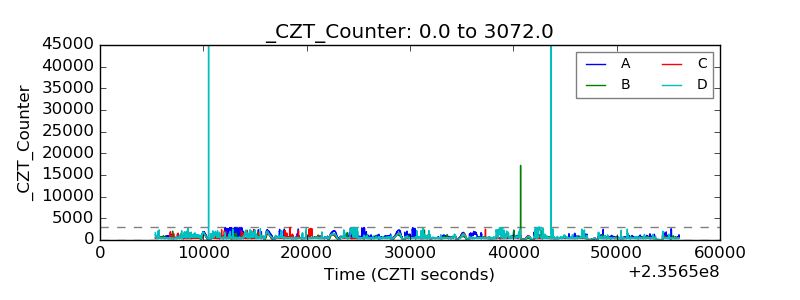 |
| +2.5 Volts monitor |  |
| +5 Volts monitor |  |
| _ROLL_ROT |  |
| _Roll_DEC |  |
| _Roll_RA | 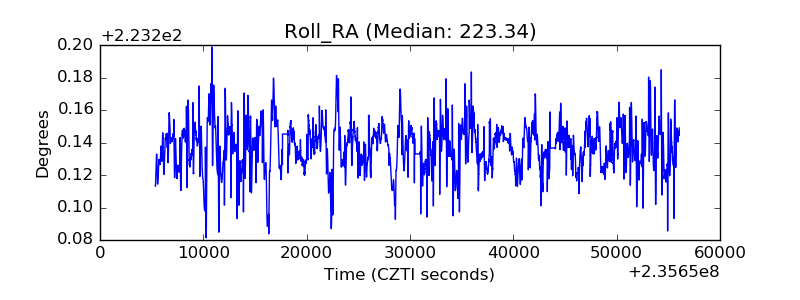 |
| Veto Counter | 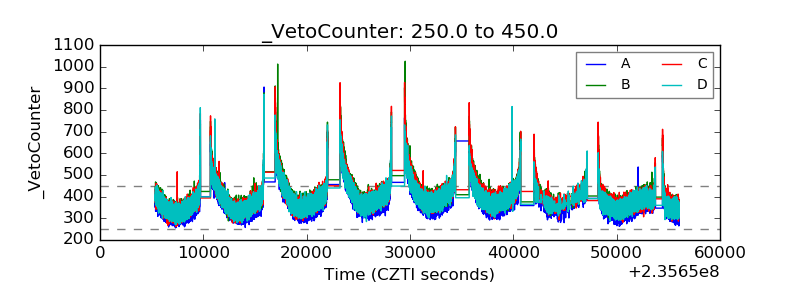 |