| Param | Original file | Final file |
|---|---|---|
| Filename | modeM0/AS1G07_022T01_9000001322_09354cztM0_level2.evt | modeM0/AS1G07_022T01_9000001322_09354cztM0_level2_quad_clean.evt |
| Size (bytes) | 701,556,480 | 110,980,800 |
| Size | 669.1 MB | 105.8 MB |
| Events in quadrant A | 5,608,534 | 704,505 |
| Events in quadrant B | 4,162,680 | 716,543 |
| Events in quadrant C | 3,694,475 | 703,633 |
| Events in quadrant D | 7,214,770 | 655,205 |
| Mode M0 | |||
|---|---|---|---|
| Quadrant | BADHDUFLAG | Total packets | Discarded packets |
| A | 0 | 22198 | 3 |
| B | 0 | 17961 | 2 |
| C | 0 | 17190 | 2 |
| D | 0 | 27315 | 2 |
| Mode SS | |||
|---|---|---|---|
| Quadrant | BADHDUFLAG | Total packets | Discarded packets |
| A | 0 | 172 | 0 |
| B | 0 | 172 | 0 |
| C | 0 | 172 | 0 |
| D | 0 | 172 | 0 |
| Mode M9 | |||
|---|---|---|---|
| Quadrant | BADHDUFLAG | Total packets | Discarded packets |
| A | 0 | 10 | 0 |
| B | 0 | 10 | 0 |
| C | 0 | 10 | 0 |
| D | 0 | 10 | 0 |
| Quadrant | Total seconds | Saturated seconds | Saturation percentage |
|---|---|---|---|
| A | 8356 | 310 | 3.709909% |
| B | 8356 | 146 | 1.747247% |
| C | 8356 | 84 | 1.005266% |
| D | 8356 | 1238 | 14.815701% |
Noise dominated data is calculated using 1-second bins in cleaned event files. If a bin has >2000 counts, and if more than 50% of those come from <1% of pixels, then it is considered to be noise-dominated and hence unusable.
| Quadrant | # 1 sec bins | Bins with >0 counts | Bins with >2000 counts | High rate bins dominated by noise | Noise dominated (total time) | Noise dominated (detector-on time) | Marked lightcurve |
|---|---|---|---|---|---|---|---|
| A | 9371 | 8358 | 63 | 63 | 0.67% | 0.75% | 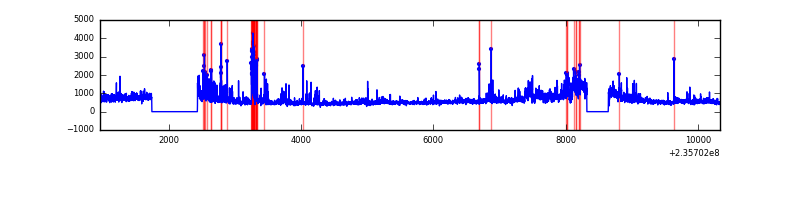 |
| B | 9371 | 8358 | 16 | 16 | 0.17% | 0.19% | 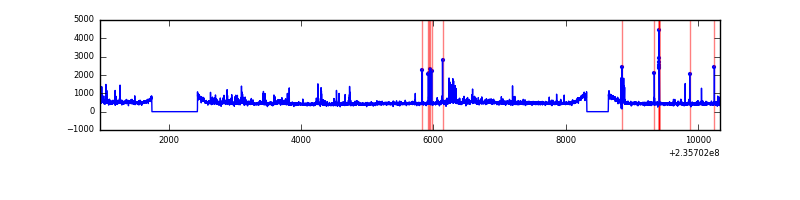 |
| C | 9371 | 8358 | 0 | 0 | 0.00% | 0.00% | 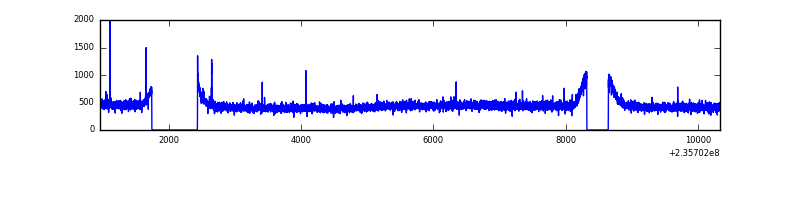 |
| D | 9371 | 8358 | 995 | 995 | 10.62% | 11.90% | 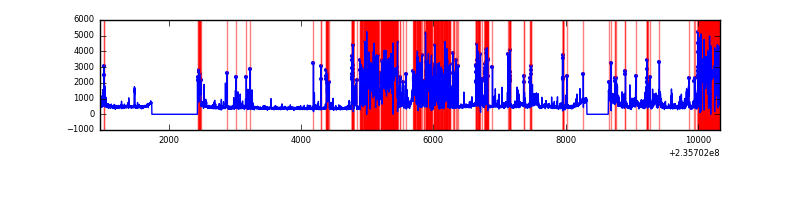 |
Top three noisy pixels from each quadrant. If the there are fewer than three noisy pixels in the level2.evt file, extra rows are filled as -1
| Pixel properties | Quadrant properties | ||||||
|---|---|---|---|---|---|---|---|
| Quadrant | DetID | PixID | Counts | Sigma | Mean | Median | Sigma |
| A | 8 | 5 | 1159956 | 5910.98 | 964 | 940 | 196.1 |
| A | 1 | 162 | 232239 | 1179.62 | 964 | 940 | 196.1 |
| A | 13 | 251 | 121399 | 614.34 | 964 | 940 | 196.1 |
| B | 0 | 214 | 88663 | 463.92 | 980 | 953 | 189.1 |
| B | 4 | 80 | 80933 | 423.04 | 980 | 953 | 189.1 |
| B | 0 | 219 | 67040 | 349.55 | 980 | 953 | 189.1 |
| C | 14 | 67 | 7637 | 30.84 | 940 | 942 | 217.1 |
| C | 13 | 61 | 7105 | 28.39 | 940 | 942 | 217.1 |
| C | 10 | 22 | 6561 | 25.88 | 940 | 942 | 217.1 |
| D | 13 | 104 | 2507821 | 10908.2 | 861 | 839 | 229.8 |
| D | 1 | 52 | 361605 | 1569.74 | 861 | 839 | 229.8 |
| D | 12 | 227 | 267730 | 1161.28 | 861 | 839 | 229.8 |
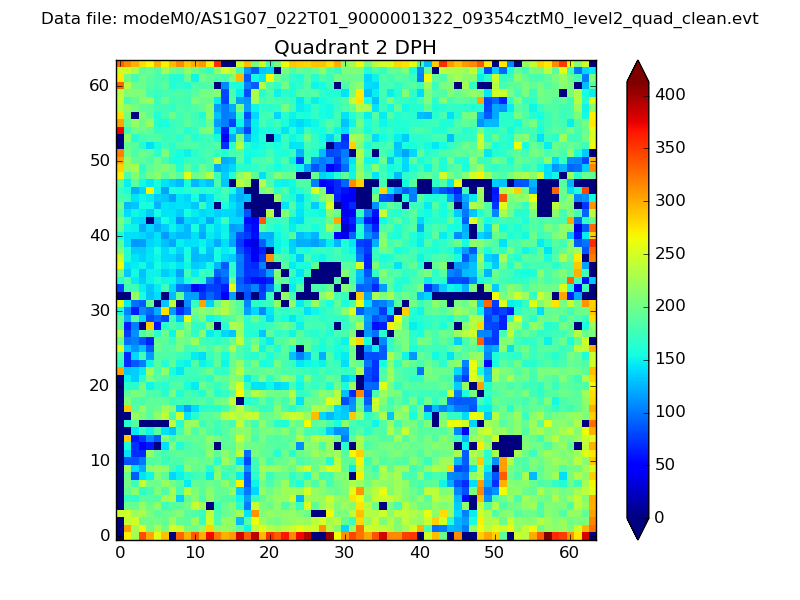
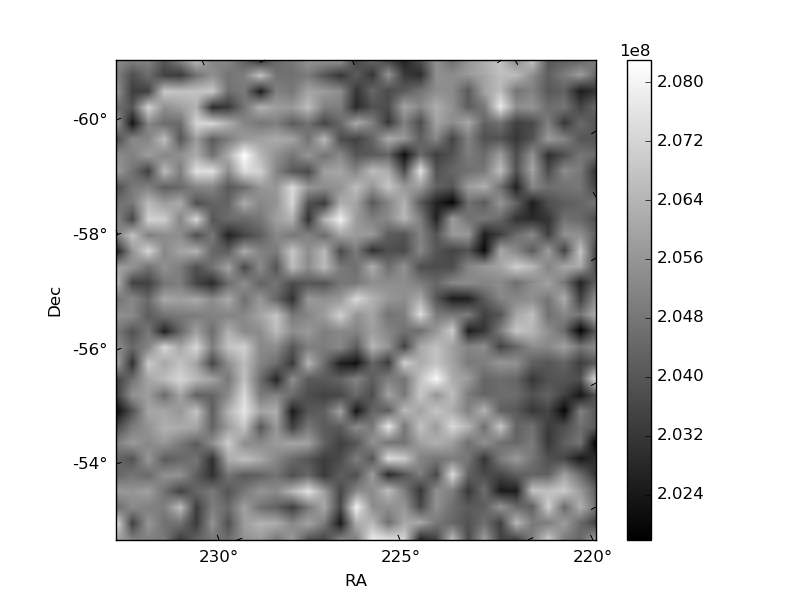
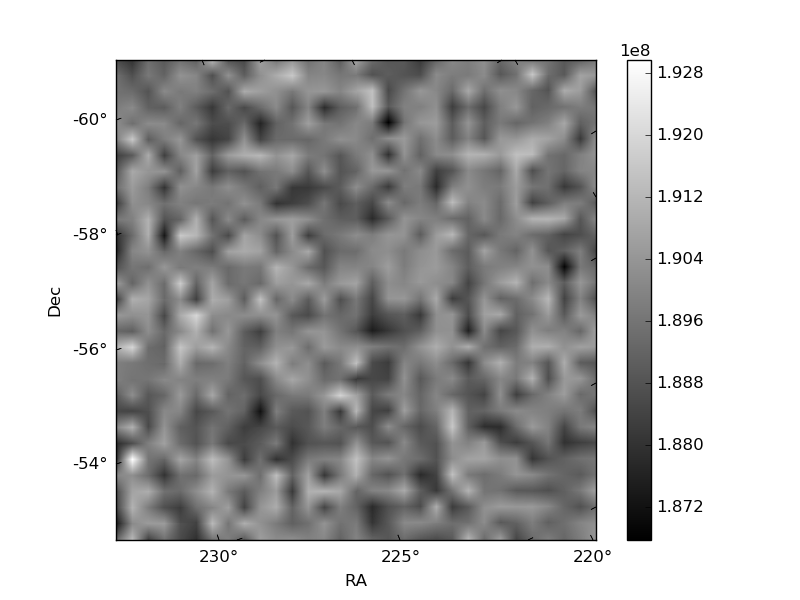
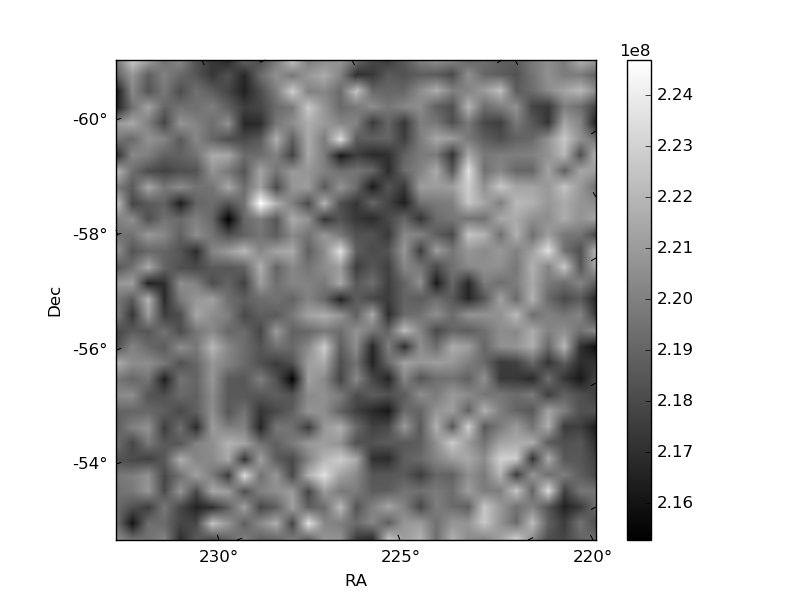
Histogram calculated using DETX and DETY for each event in the final _common_clean file
| Quadrant A | 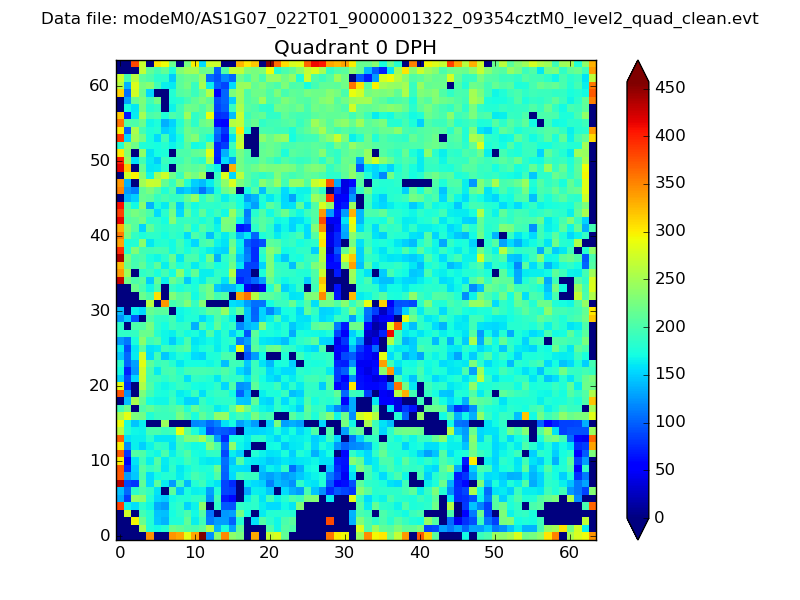 |
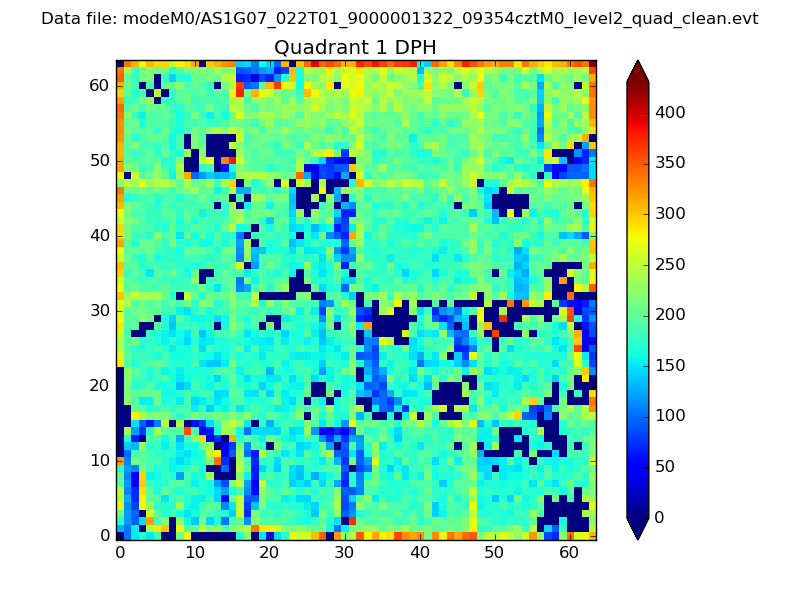 |
Quadrant B |
|---|---|---|---|
| Quadrant D | 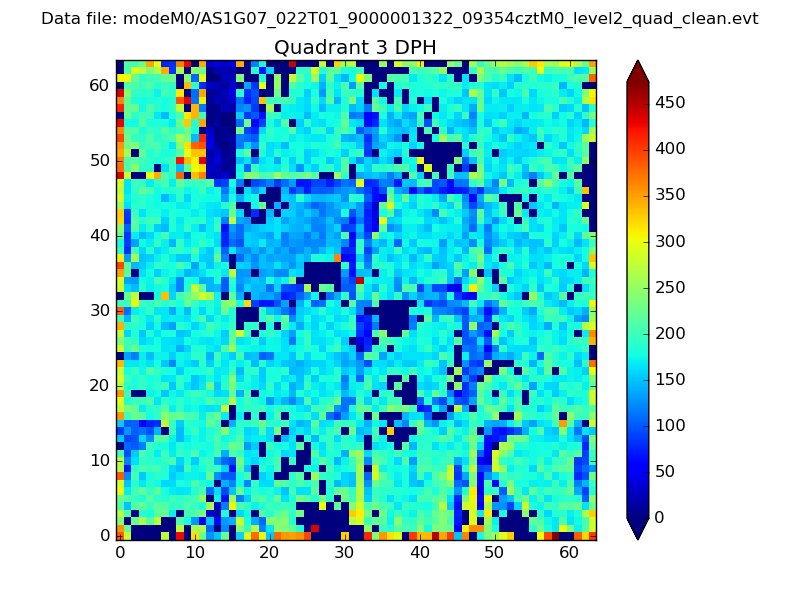 |
 |
Quadrant C |
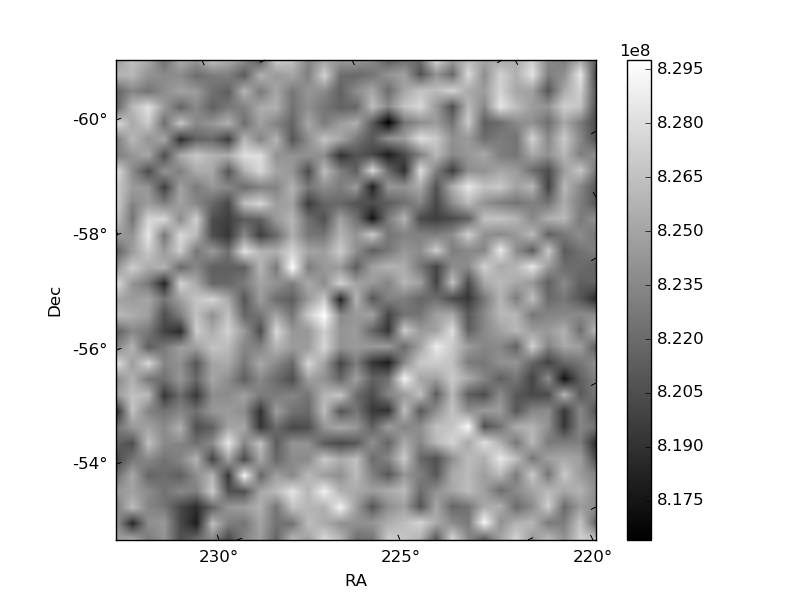
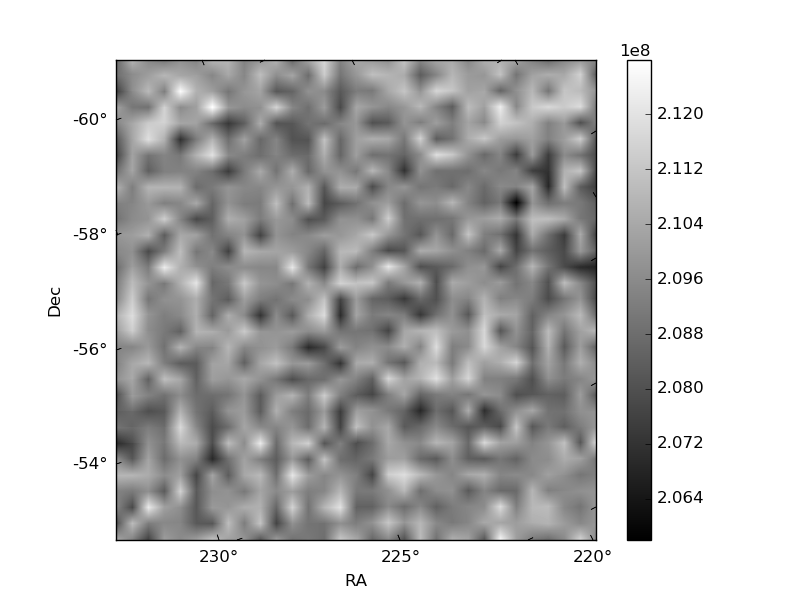
| Plot type | Count rate plots | Images |
|---|---|---|
| Comparison with Poisson distribution Blue bars denote a histogram of data divided into 1 sec bins. Red curve is a Poisson curve with rate = median count rate of data. |
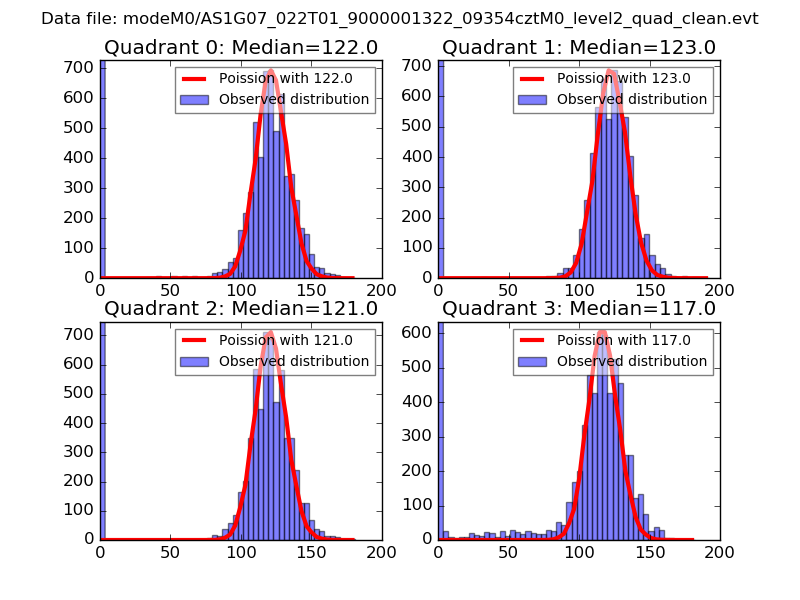 |
 |
| Quadrant-wise count rates Data is divided into 100 sec bins |
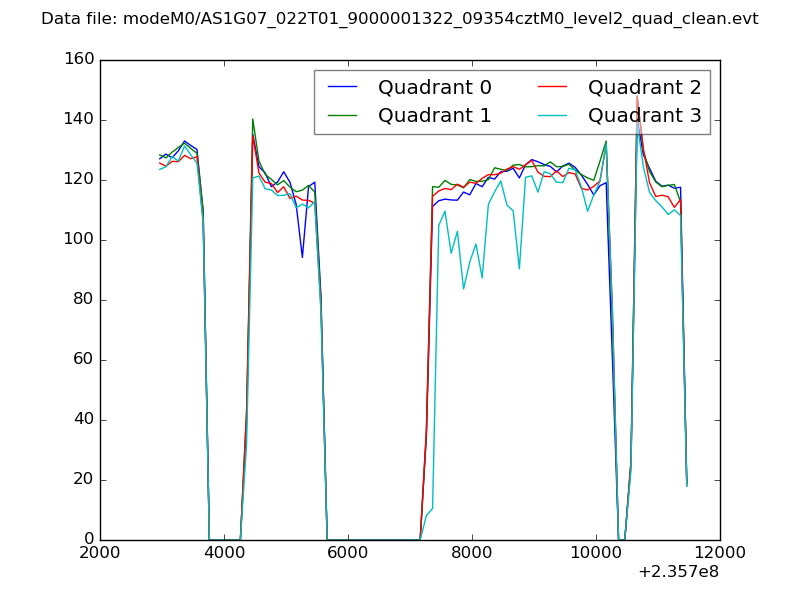 |
|
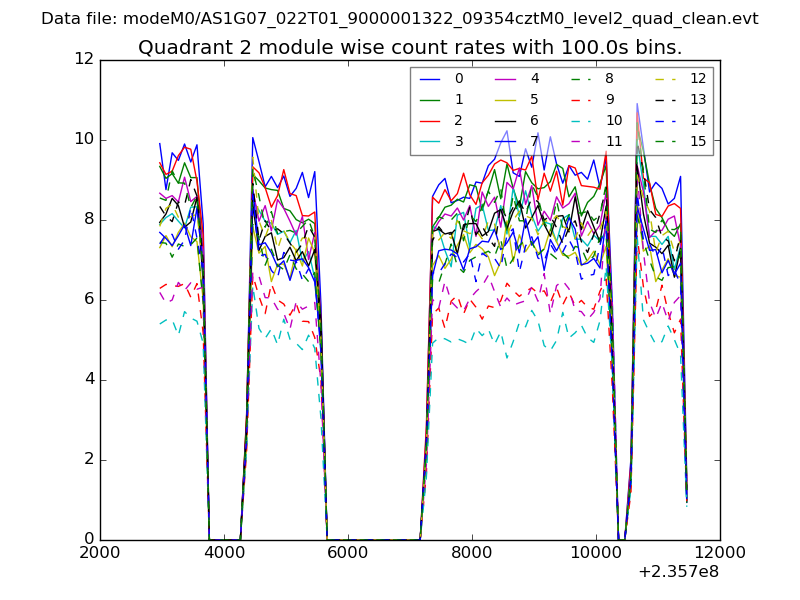
| Module-wise count rates for Quadrant A Data is divided into 100 sec bins |
 |
 |
| Module-wise count rates for Quadrant B Data is divided into 100 sec bins |
 |
 |
| Module-wise count rates for Quadrant C Data is divided into 100 sec bins |
 |
 |
| Module-wise count rates for Quadrant D Data is divided into 100 sec bins |
 |
 |
| Parameter | Plot |
|---|---|
| CZT HV Monitor | 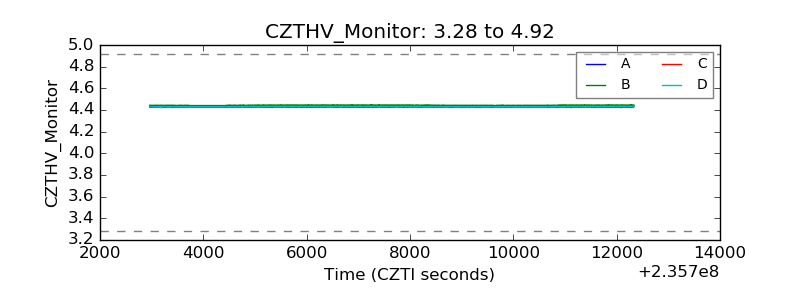 |
| D_VDD |  |
| Temperature 1 | 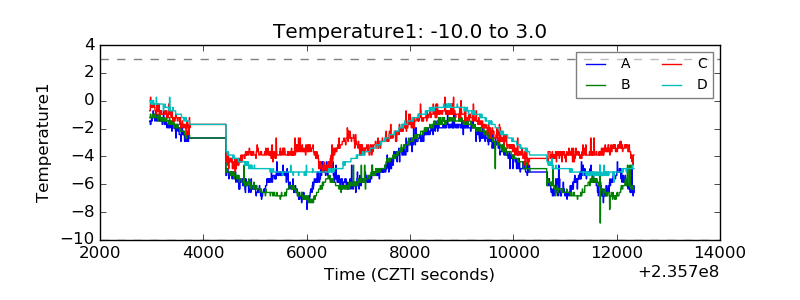 |
| Veto HV Monitor |  |
| Veto LLD |  |
| Alpha Counter | 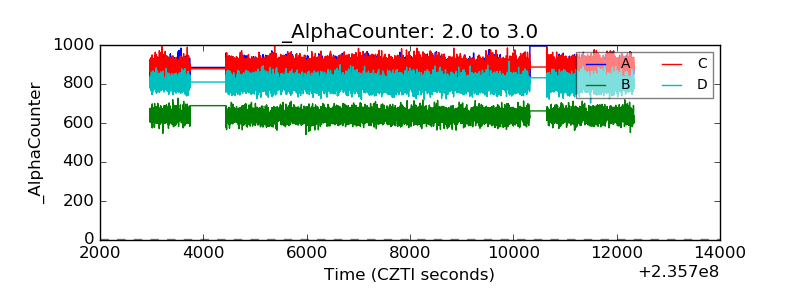 |
| _CPM_Rate | 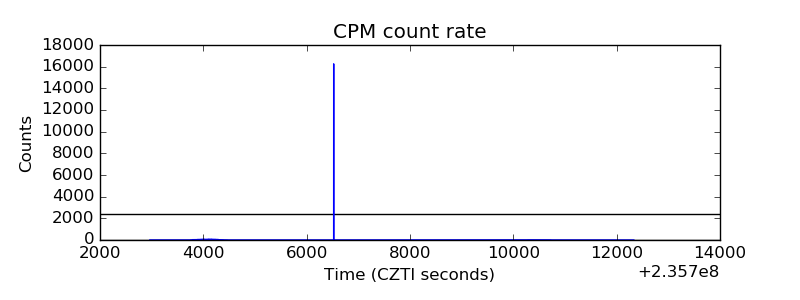 |
| CZT Counter | 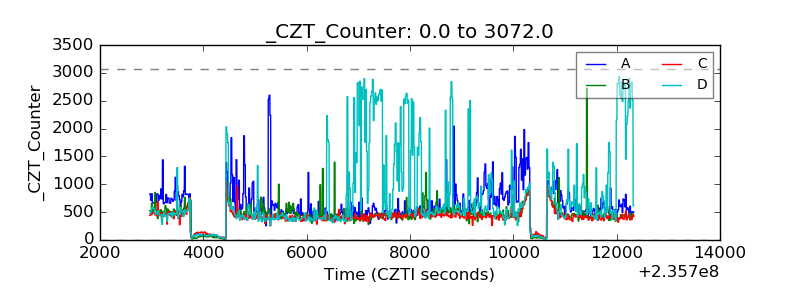 |
| +2.5 Volts monitor |  |
| +5 Volts monitor |  |
| _ROLL_ROT | 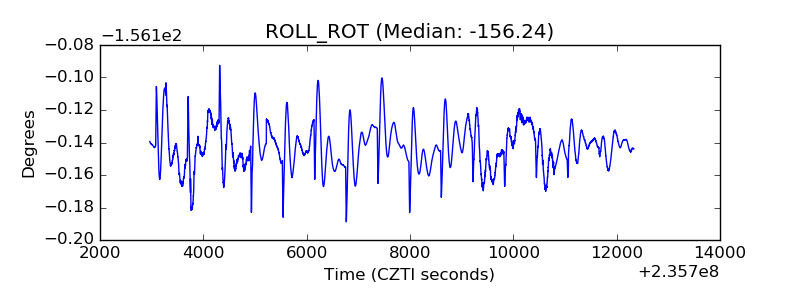 |
| _Roll_DEC | 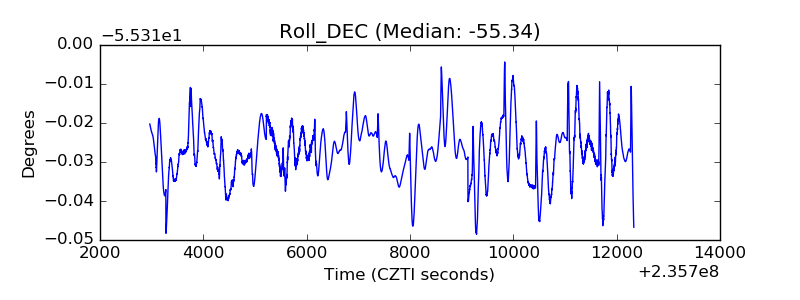 |
| _Roll_RA | 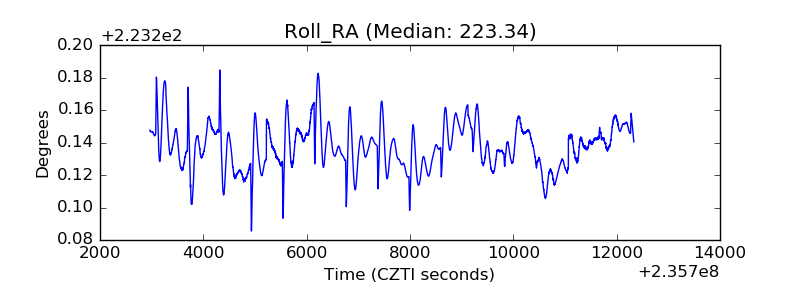 |
| Veto Counter | 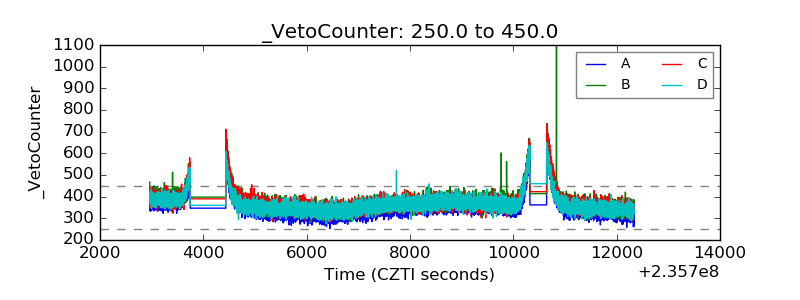 |