| Param | Original file | Final file |
|---|---|---|
| Filename | modeM0/AS1G07_022T01_9000001322_09355cztM0_level2.evt | modeM0/AS1G07_022T01_9000001322_09355cztM0_level2_quad_clean.evt |
| Size (bytes) | 554,679,360 | 84,075,840 |
| Size | 529.0 MB | 80.2 MB |
| Events in quadrant A | 4,687,512 | 512,601 |
| Events in quadrant B | 3,461,519 | 520,510 |
| Events in quadrant C | 3,149,671 | 513,421 |
| Events in quadrant D | 5,011,341 | 498,131 |
| Mode M0 | |||
|---|---|---|---|
| Quadrant | BADHDUFLAG | Total packets | Discarded packets |
| A | 0 | 19369 | 402 |
| B | 0 | 15491 | 288 |
| C | 0 | 15003 | 278 |
| D | 0 | 20477 | 531 |
| Mode SS | |||
|---|---|---|---|
| Quadrant | BADHDUFLAG | Total packets | Discarded packets |
| A | 0 | 148 | 0 |
| B | 0 | 148 | 2 |
| C | 0 | 148 | 6 |
| D | 0 | 148 | 2 |
| Mode M9 | |||
|---|---|---|---|
| Quadrant | BADHDUFLAG | Total packets | Discarded packets |
| A | 0 | 3 | 0 |
| B | 0 | 3 | 0 |
| C | 0 | 3 | 0 |
| D | 0 | 3 | 0 |
| Quadrant | Total seconds | Saturated seconds | Saturation percentage |
|---|---|---|---|
| A | 7190 | 145 | 2.016690% |
| B | 7210 | 118 | 1.636616% |
| C | 7207 | 87 | 1.207160% |
| D | 7180 | 549 | 7.646240% |
Noise dominated data is calculated using 1-second bins in cleaned event files. If a bin has >2000 counts, and if more than 50% of those come from <1% of pixels, then it is considered to be noise-dominated and hence unusable.
| Quadrant | # 1 sec bins | Bins with >0 counts | Bins with >2000 counts | High rate bins dominated by noise | Noise dominated (total time) | Noise dominated (detector-on time) | Marked lightcurve |
|---|---|---|---|---|---|---|---|
| A | 7637 | 7299 | 26 | 26 | 0.34% | 0.36% | 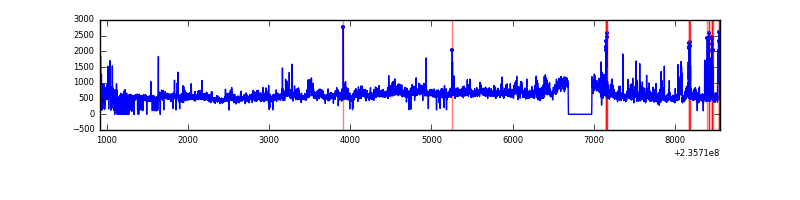 |
| B | 7637 | 7313 | 10 | 10 | 0.13% | 0.14% | 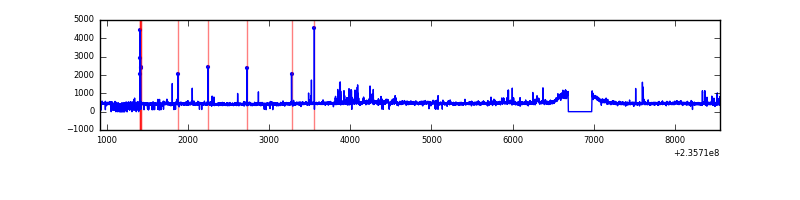 |
| C | 7637 | 7316 | 0 | 0 | 0.00% | 0.00% |  |
| D | 7637 | 7293 | 407 | 407 | 5.33% | 5.58% | 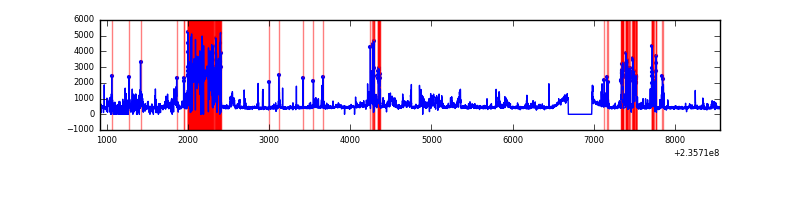 |
Top three noisy pixels from each quadrant. If the there are fewer than three noisy pixels in the level2.evt file, extra rows are filled as -1
| Pixel properties | Quadrant properties | ||||||
|---|---|---|---|---|---|---|---|
| Quadrant | DetID | PixID | Counts | Sigma | Mean | Median | Sigma |
| A | 8 | 5 | 1284553 | 7652.56 | 821 | 800 | 167.8 |
| A | 1 | 162 | 71093 | 419.02 | 821 | 800 | 167.8 |
| A | 4 | 2 | 44360 | 259.66 | 821 | 800 | 167.8 |
| B | 4 | 80 | 70173 | 436.86 | 829 | 806 | 158.8 |
| B | 0 | 219 | 53115 | 329.43 | 829 | 806 | 158.8 |
| B | 0 | 214 | 43128 | 266.53 | 829 | 806 | 158.8 |
| C | 14 | 67 | 10132 | 50.19 | 800 | 801 | 185.9 |
| C | 13 | 61 | 6257 | 29.35 | 800 | 801 | 185.9 |
| C | 8 | 222 | 4931 | 22.22 | 800 | 801 | 185.9 |
| D | 13 | 104 | 1273355 | 6405.82 | 761 | 742 | 198.7 |
| D | 7 | 46 | 356202 | 1789.24 | 761 | 742 | 198.7 |
| D | 12 | 233 | 168632 | 845.09 | 761 | 742 | 198.7 |
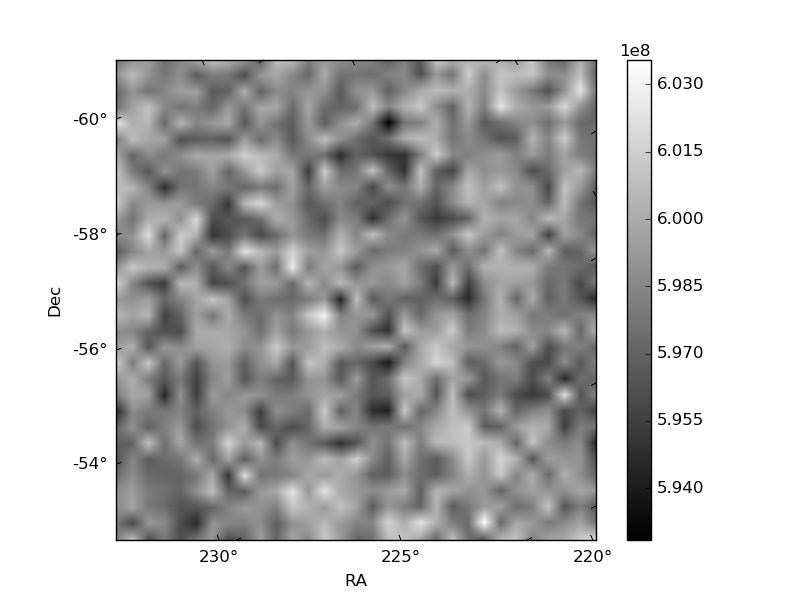
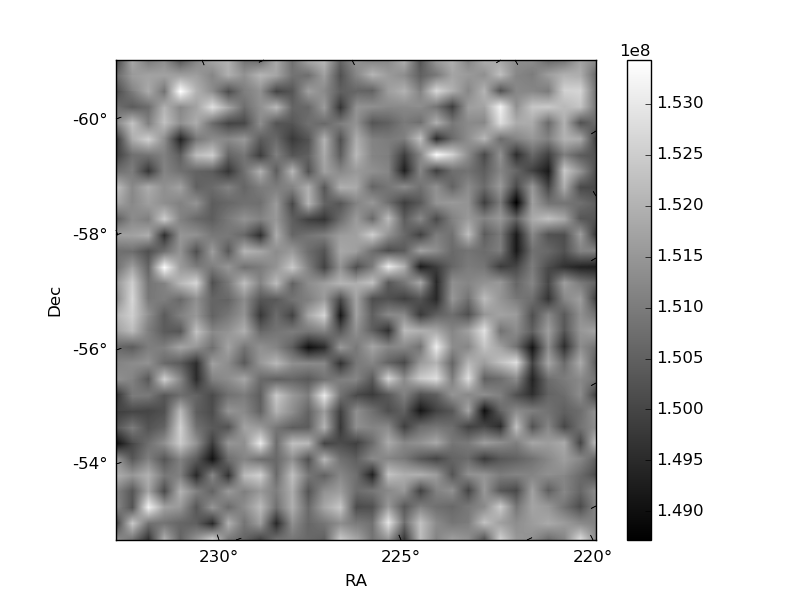
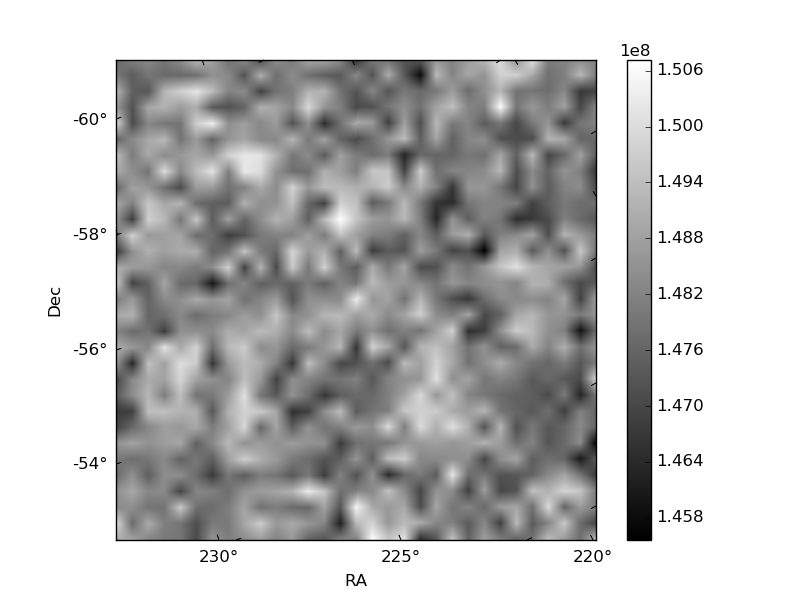
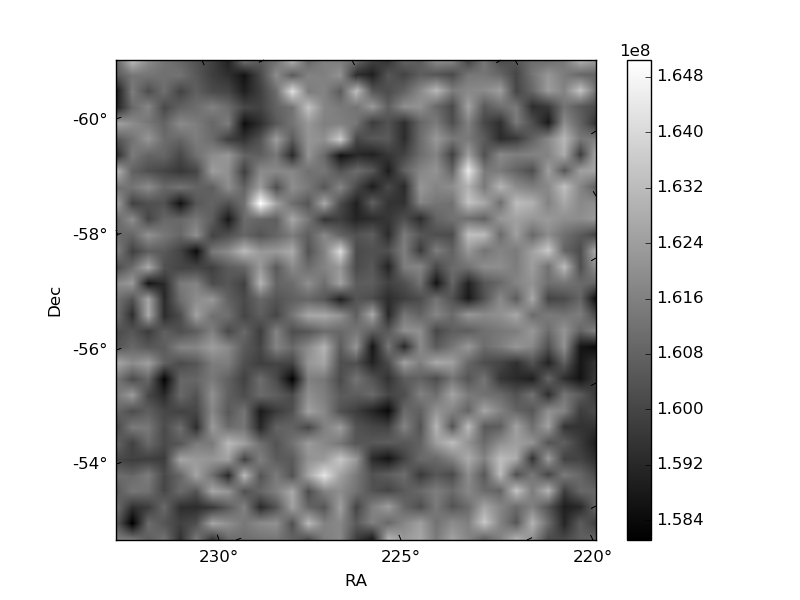
Histogram calculated using DETX and DETY for each event in the final _common_clean file
| Quadrant A | 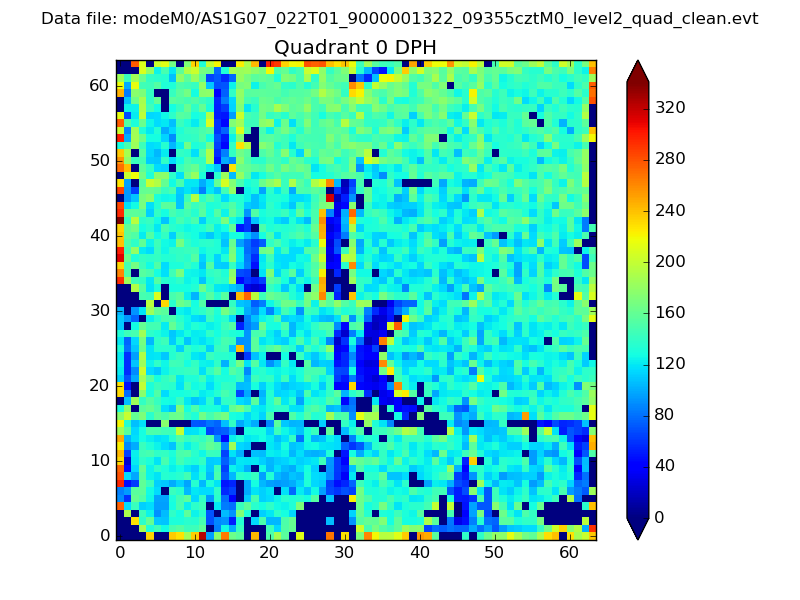 |
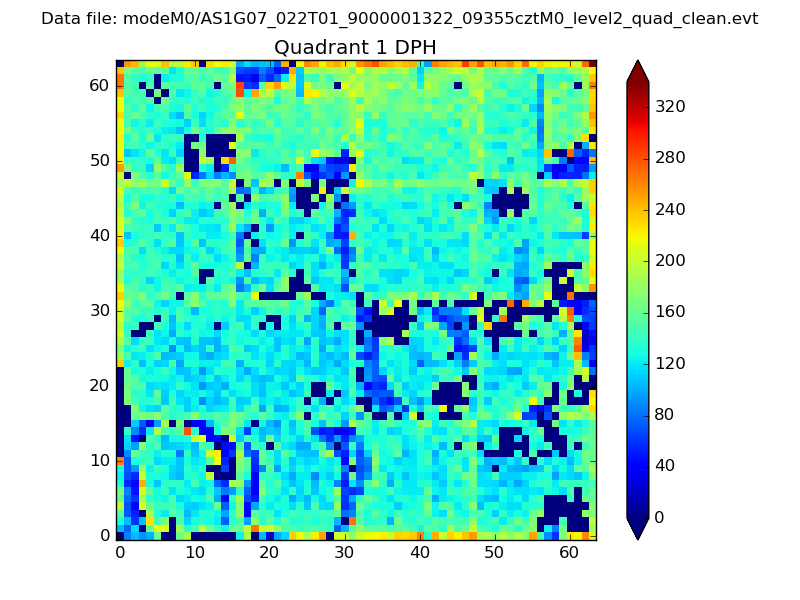 |
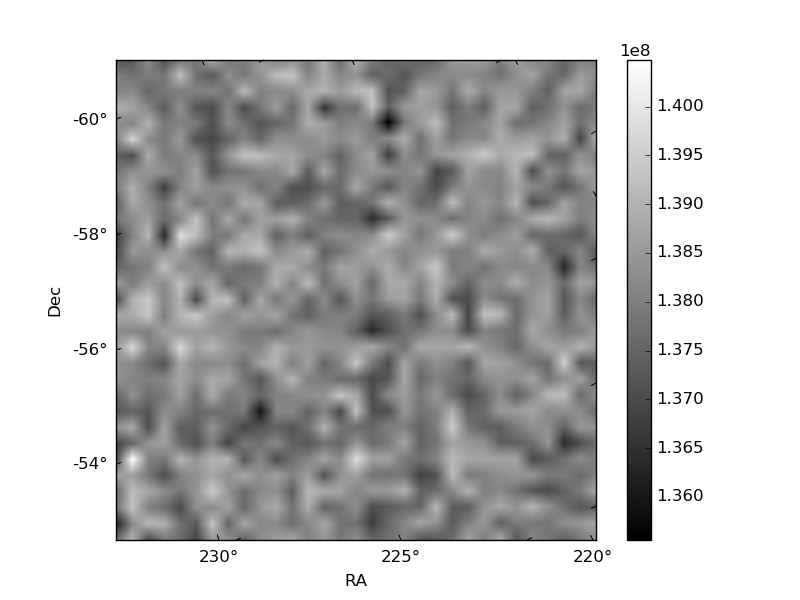
Quadrant B |
|---|---|---|---|
| Quadrant D | 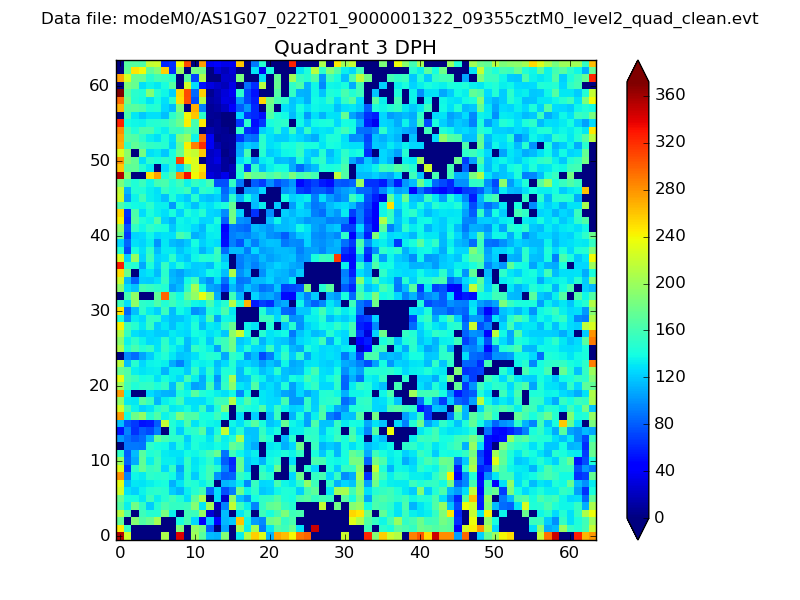 |
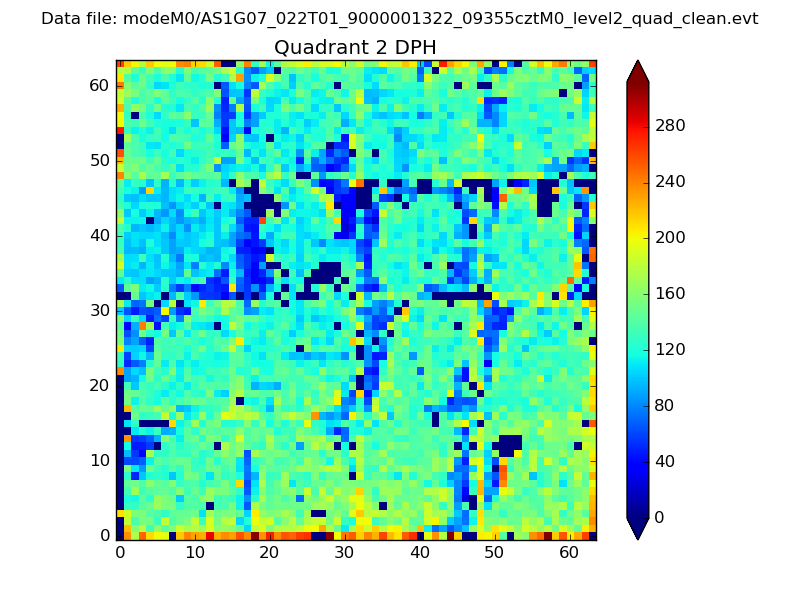 |
Quadrant C |
| Plot type | Count rate plots | Images |
|---|---|---|
| Comparison with Poisson distribution Blue bars denote a histogram of data divided into 1 sec bins. Red curve is a Poisson curve with rate = median count rate of data. |
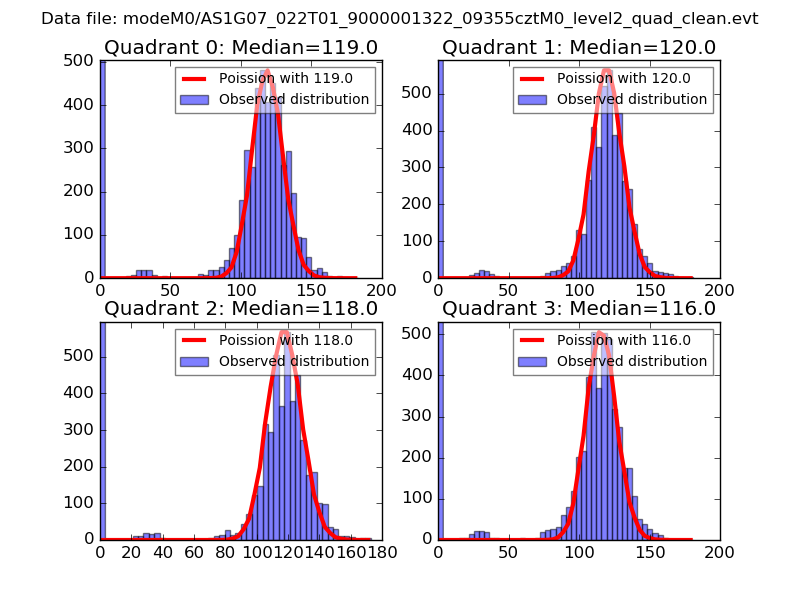 |
 |
| Quadrant-wise count rates Data is divided into 100 sec bins |
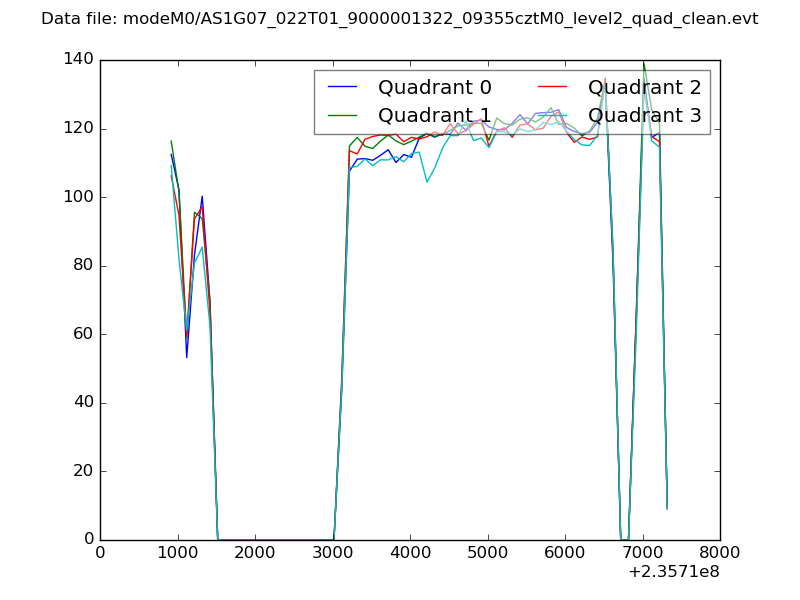 |
|
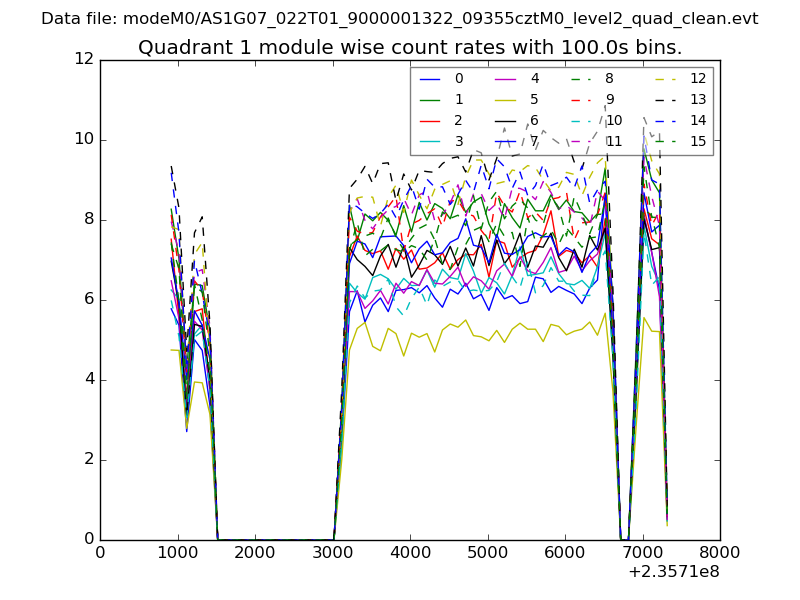
| Module-wise count rates for Quadrant A Data is divided into 100 sec bins |
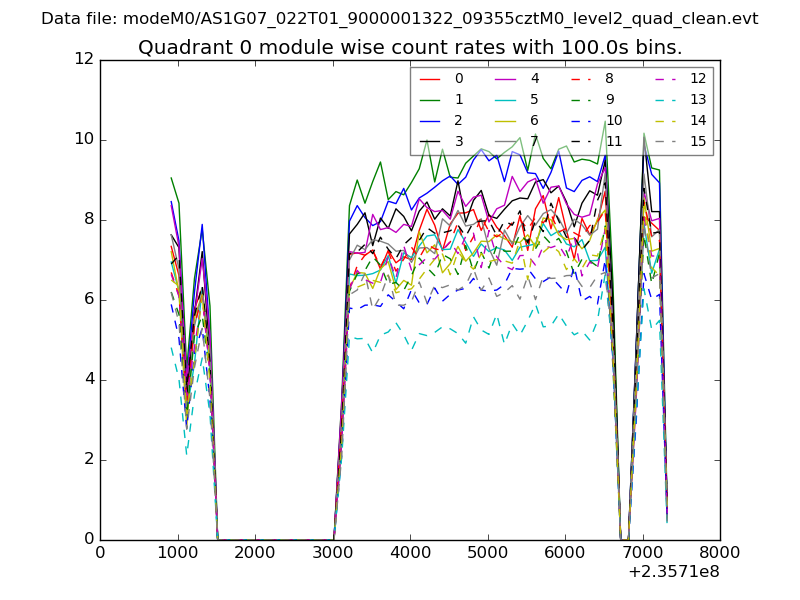 |
 |
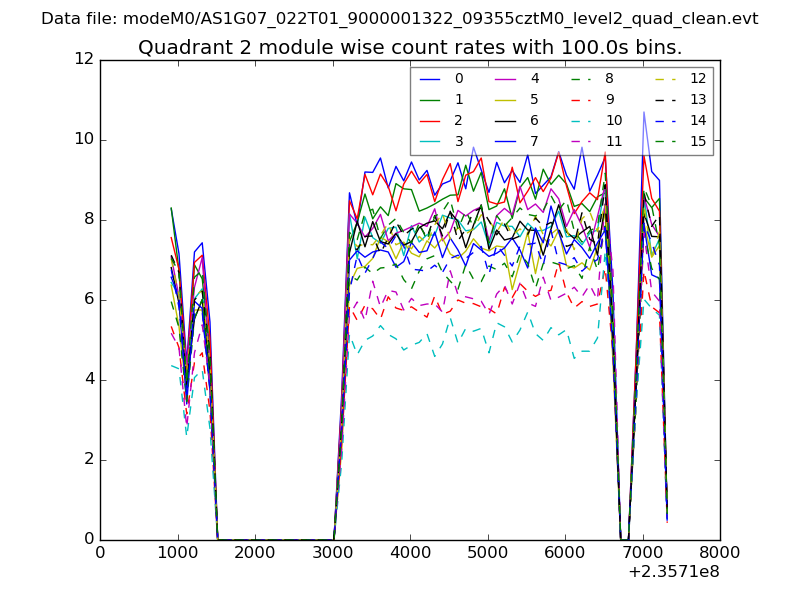
| Module-wise count rates for Quadrant B Data is divided into 100 sec bins |
 |
 |
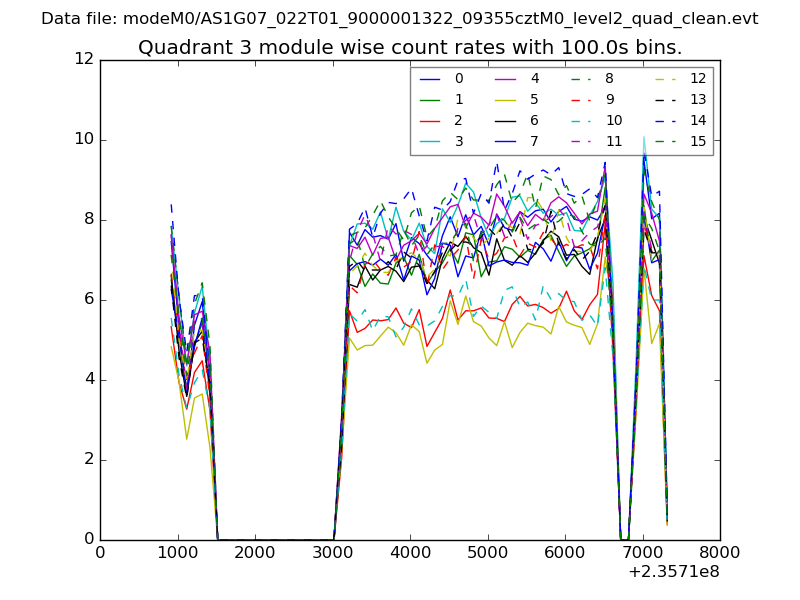
| Module-wise count rates for Quadrant C Data is divided into 100 sec bins |
 |
 |
| Module-wise count rates for Quadrant D Data is divided into 100 sec bins |
 |
 |
| Parameter | Plot |
|---|---|
| CZT HV Monitor | 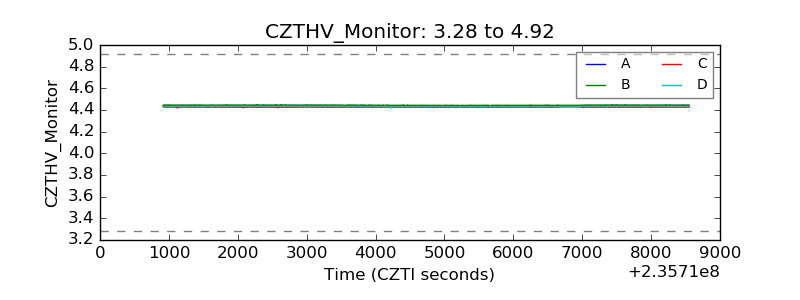 |
| D_VDD | 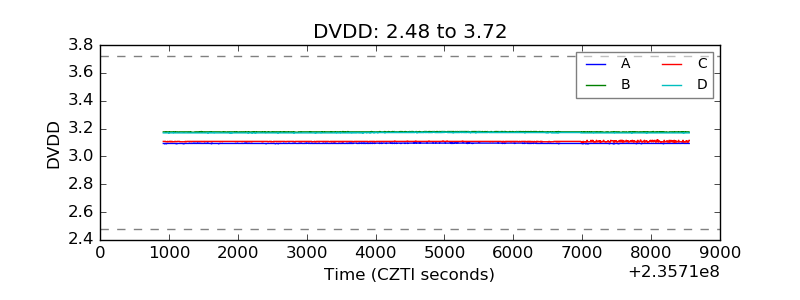 |
| Temperature 1 | 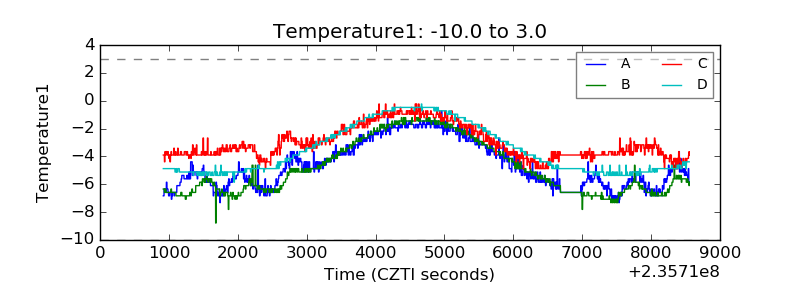 |
| Veto HV Monitor | 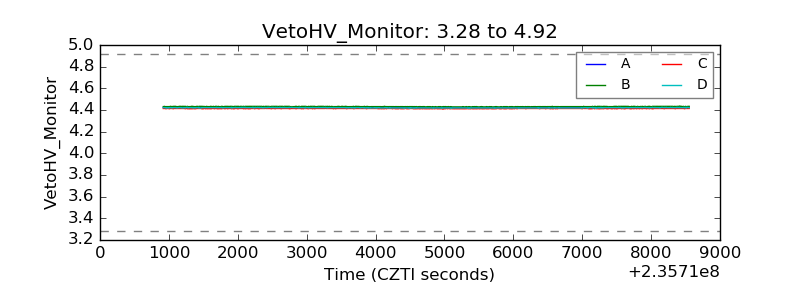 |
| Veto LLD | 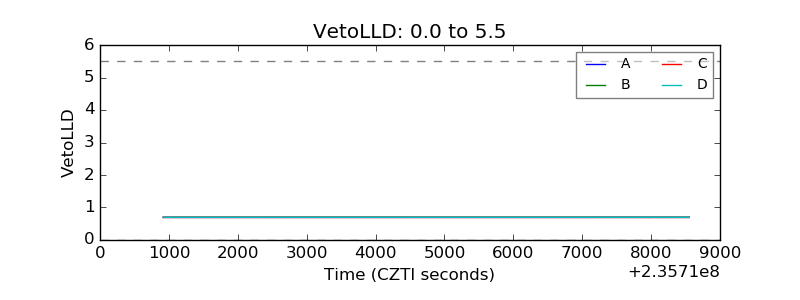 |
| Alpha Counter | 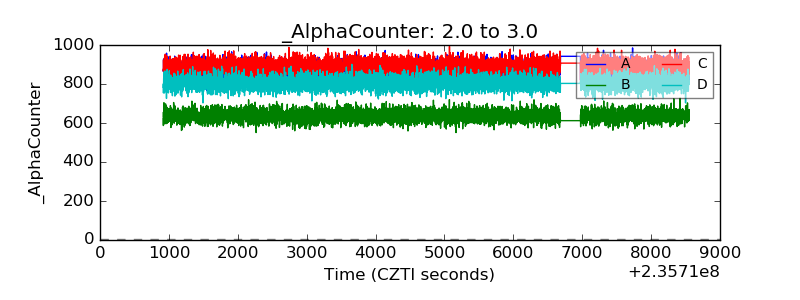 |
| _CPM_Rate | 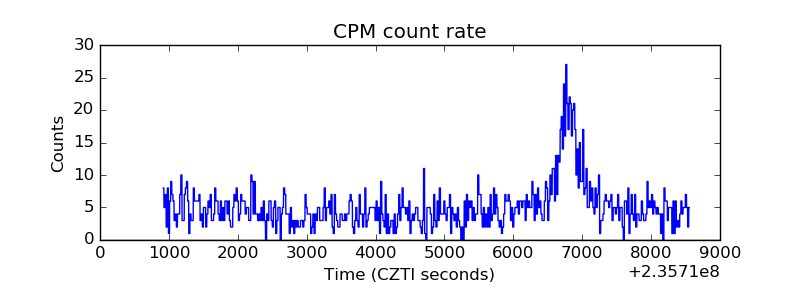 |
| CZT Counter | 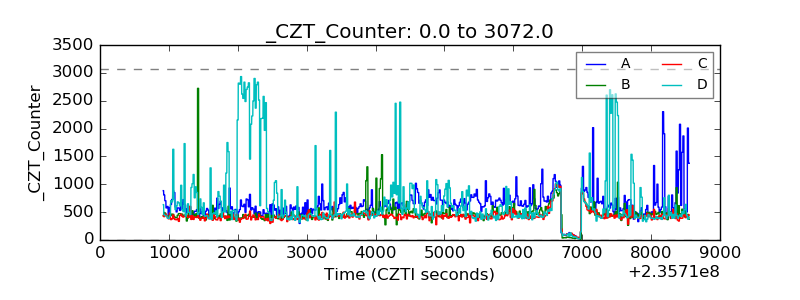 |
| +2.5 Volts monitor |  |
| +5 Volts monitor |  |
| _ROLL_ROT | 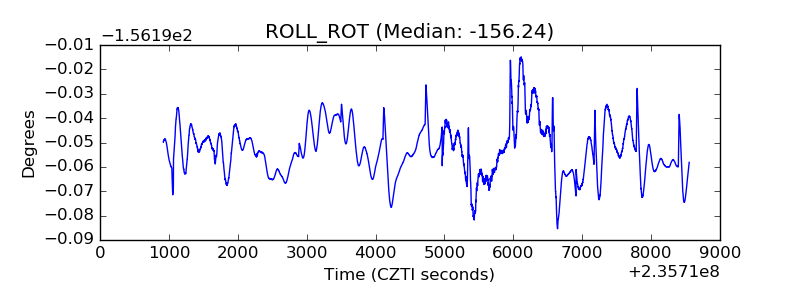 |
| _Roll_DEC | 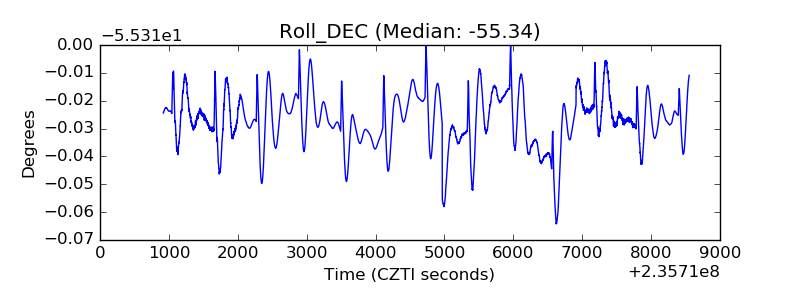 |
| _Roll_RA | 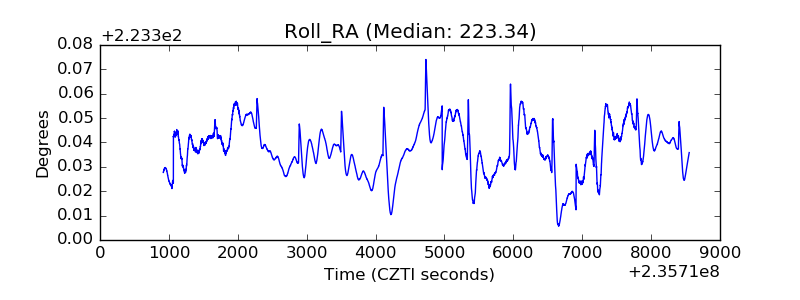 |
| Veto Counter | 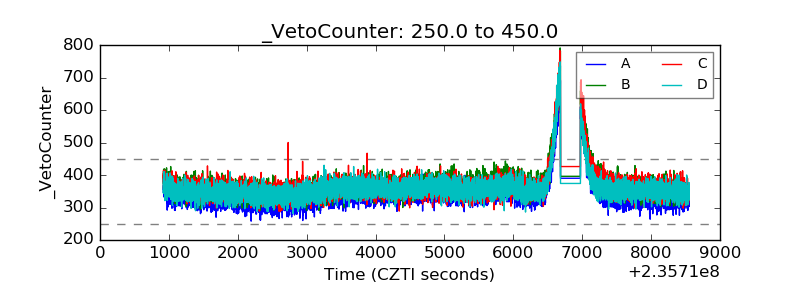 |