| Param | Original file | Final file |
|---|---|---|
| Filename | modeM0/AS1G07_022T01_9000001322_09358cztM0_level2.evt | modeM0/AS1G07_022T01_9000001322_09358cztM0_level2_quad_clean.evt |
| Size (bytes) | 995,904,000 | 168,099,840 |
| Size | 949.8 MB | 160.3 MB |
| Events in quadrant A | 8,955,401 | 1,056,406 |
| Events in quadrant B | 6,151,500 | 1,073,937 |
| Events in quadrant C | 5,713,533 | 1,063,468 |
| Events in quadrant D | 8,482,688 | 1,019,792 |
| Mode M0 | |||
|---|---|---|---|
| Quadrant | BADHDUFLAG | Total packets | Discarded packets |
| A | 0 | 35233 | 9 |
| B | 0 | 26680 | 3 |
| C | 0 | 26116 | 5 |
| D | 0 | 33901 | 7 |
| Mode SS | |||
|---|---|---|---|
| Quadrant | BADHDUFLAG | Total packets | Discarded packets |
| A | 0 | 256 | 0 |
| B | 0 | 256 | 0 |
| C | 0 | 256 | 0 |
| D | 0 | 256 | 0 |
| Mode M9 | |||
|---|---|---|---|
| Quadrant | BADHDUFLAG | Total packets | Discarded packets |
| A | 0 | 14 | 0 |
| B | 0 | 14 | 0 |
| C | 0 | 14 | 0 |
| D | 0 | 15 | 0 |
| Quadrant | Total seconds | Saturated seconds | Saturation percentage |
|---|---|---|---|
| A | 12702 | 271 | 2.133522% |
| B | 12704 | 146 | 1.149244% |
| C | 12703 | 91 | 0.716366% |
| D | 12702 | 731 | 5.754999% |
Noise dominated data is calculated using 1-second bins in cleaned event files. If a bin has >2000 counts, and if more than 50% of those come from <1% of pixels, then it is considered to be noise-dominated and hence unusable.
| Quadrant | # 1 sec bins | Bins with >0 counts | Bins with >2000 counts | High rate bins dominated by noise | Noise dominated (total time) | Noise dominated (detector-on time) | Marked lightcurve |
|---|---|---|---|---|---|---|---|
| A | 14069 | 12706 | 101 | 101 | 0.72% | 0.79% | 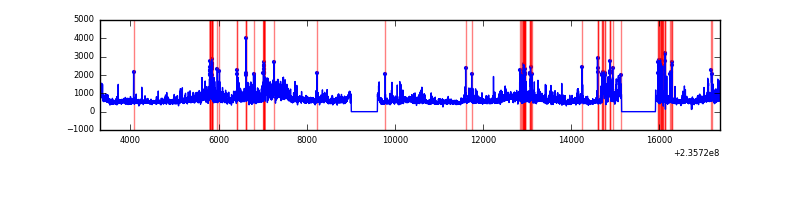 |
| B | 14069 | 12706 | 5 | 5 | 0.04% | 0.04% | 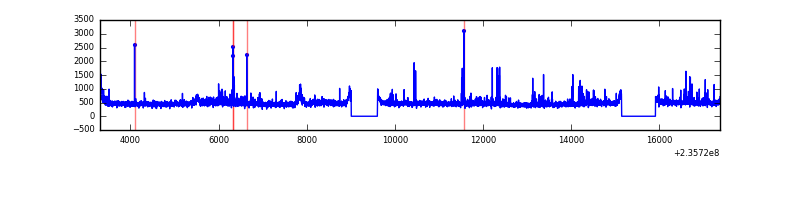 |
| C | 14069 | 12706 | 0 | 0 | 0.00% | 0.00% | 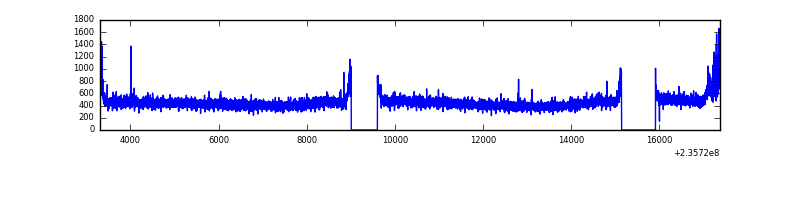 |
| D | 14069 | 12706 | 530 | 530 | 3.77% | 4.17% | 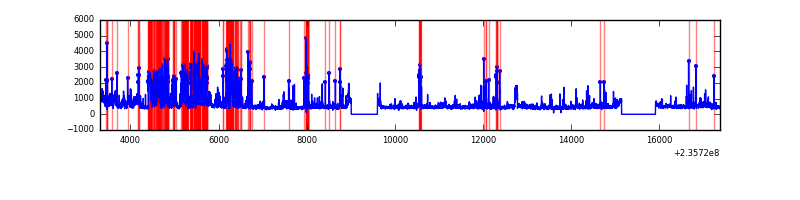 |
Top three noisy pixels from each quadrant. If the there are fewer than three noisy pixels in the level2.evt file, extra rows are filled as -1
| Pixel properties | Quadrant properties | ||||||
|---|---|---|---|---|---|---|---|
| Quadrant | DetID | PixID | Counts | Sigma | Mean | Median | Sigma |
| A | 8 | 5 | 2722807 | 9234.05 | 1459 | 1424 | 294.7 |
| A | 13 | 251 | 171882 | 578.39 | 1459 | 1424 | 294.7 |
| A | 0 | 8 | 154737 | 520.21 | 1459 | 1424 | 294.7 |
| B | 0 | 219 | 112678 | 397.44 | 1469 | 1428 | 279.9 |
| B | 0 | 214 | 84643 | 297.29 | 1469 | 1428 | 279.9 |
| B | 4 | 80 | 57054 | 198.72 | 1469 | 1428 | 279.9 |
| C | 9 | 68 | 149832 | 449.36 | 1422 | 1425 | 330.3 |
| C | 13 | 61 | 10801 | 28.39 | 1422 | 1425 | 330.3 |
| C | 8 | 222 | 8744 | 22.16 | 1422 | 1425 | 330.3 |
| D | 12 | 227 | 2013792 | 5628.56 | 1392 | 1354 | 357.5 |
| D | 1 | 52 | 402002 | 1120.57 | 1392 | 1354 | 357.5 |
| D | 13 | 104 | 157972 | 438.04 | 1392 | 1354 | 357.5 |
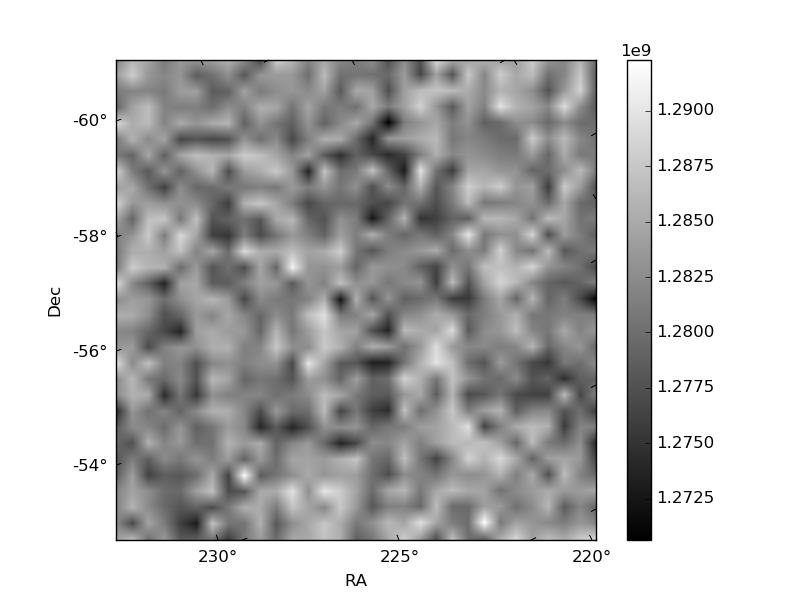
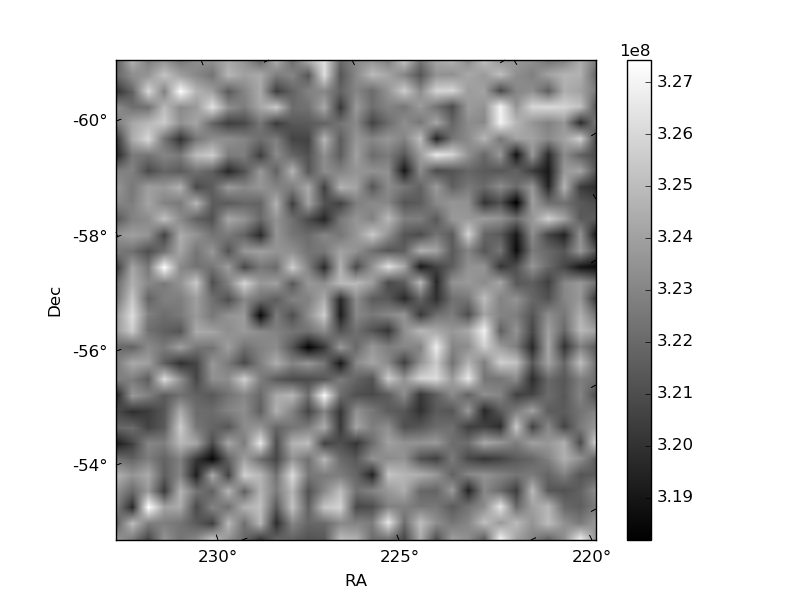
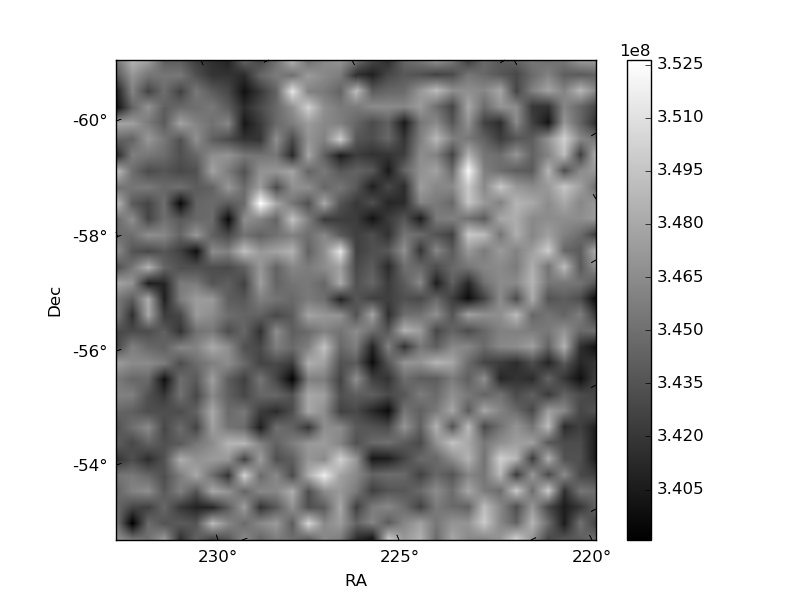
Histogram calculated using DETX and DETY for each event in the final _common_clean file
| Quadrant A | 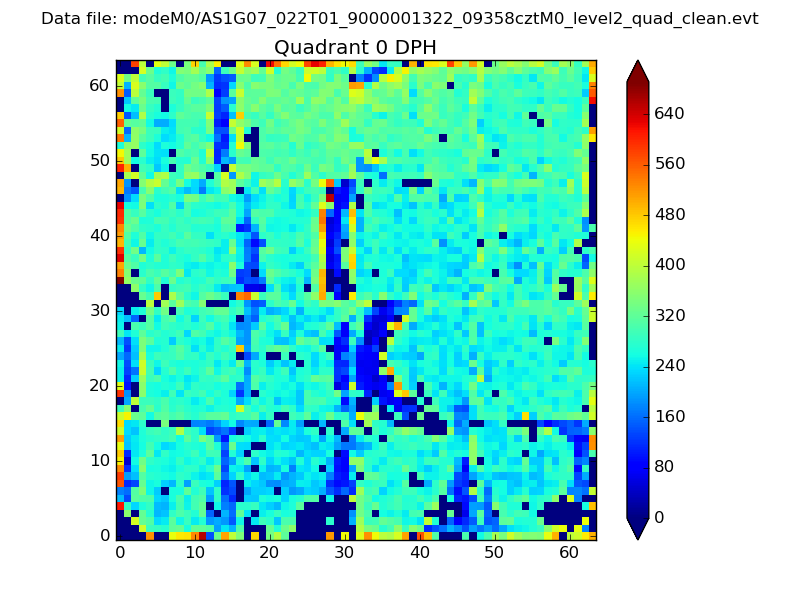 |
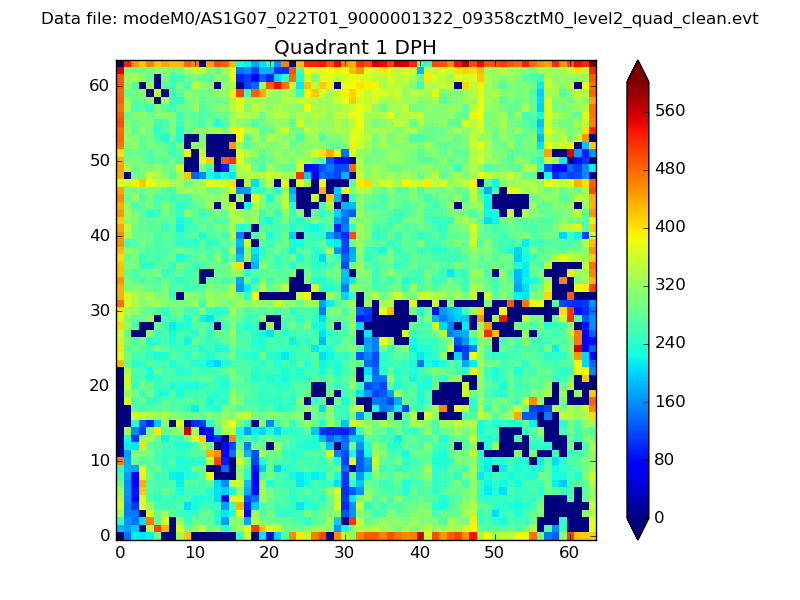 |
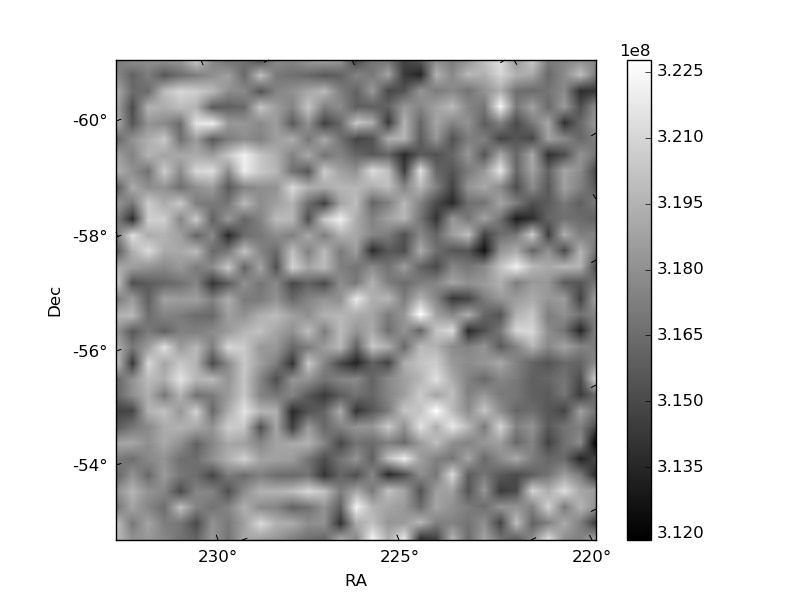
Quadrant B |
|---|---|---|---|
| Quadrant D | 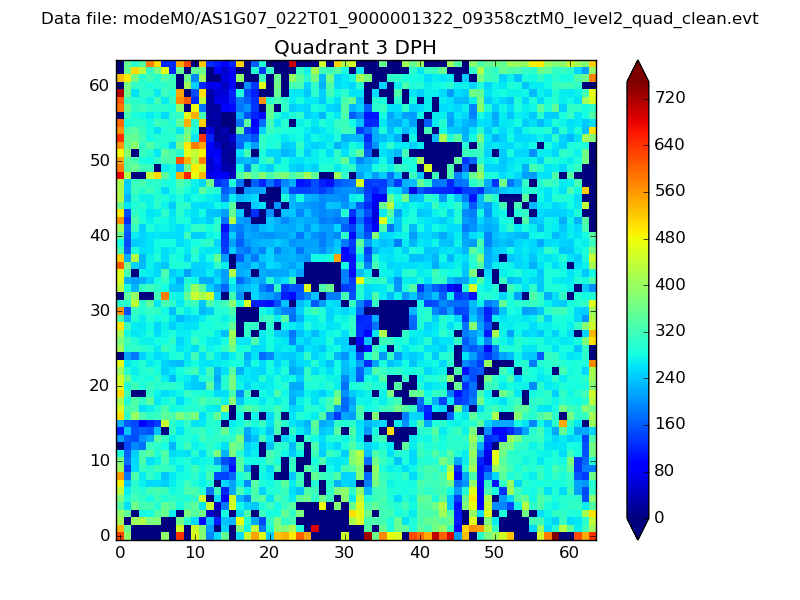 |
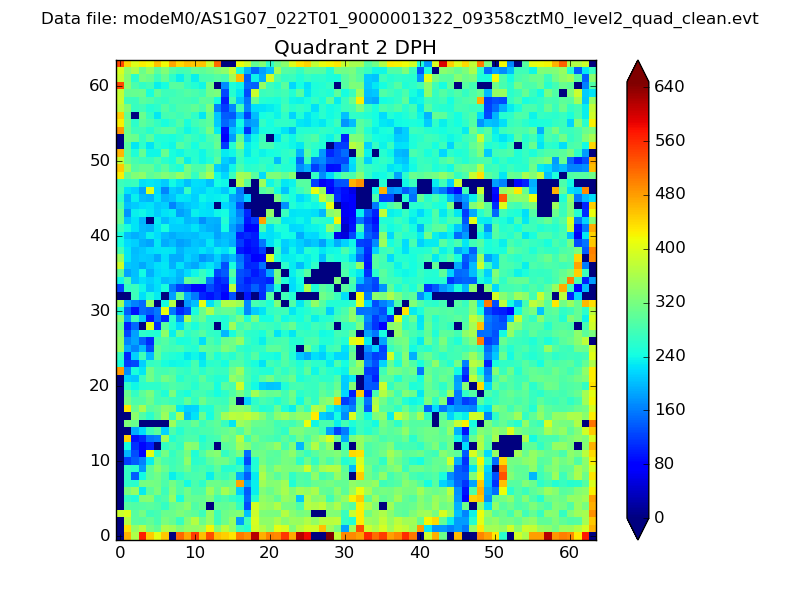 |
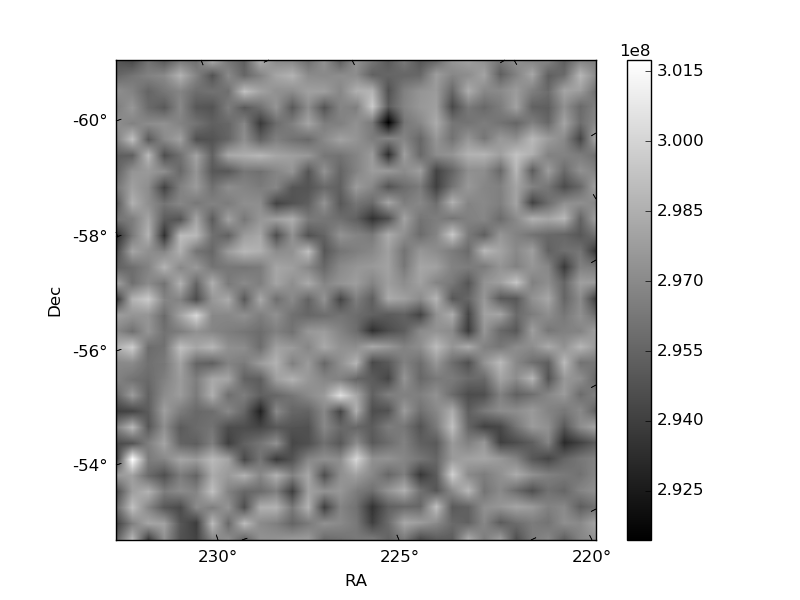
Quadrant C |
| Plot type | Count rate plots | Images |
|---|---|---|
| Comparison with Poisson distribution Blue bars denote a histogram of data divided into 1 sec bins. Red curve is a Poisson curve with rate = median count rate of data. |
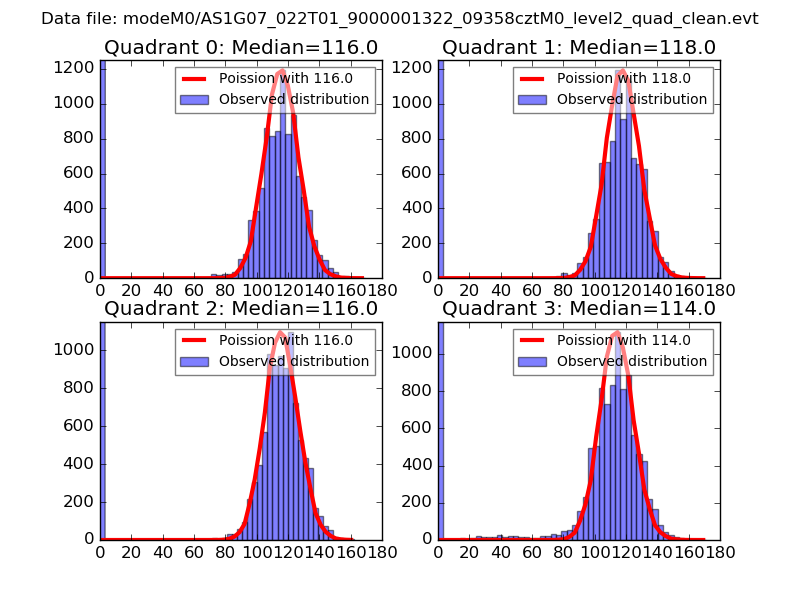 |
 |
| Quadrant-wise count rates Data is divided into 100 sec bins |
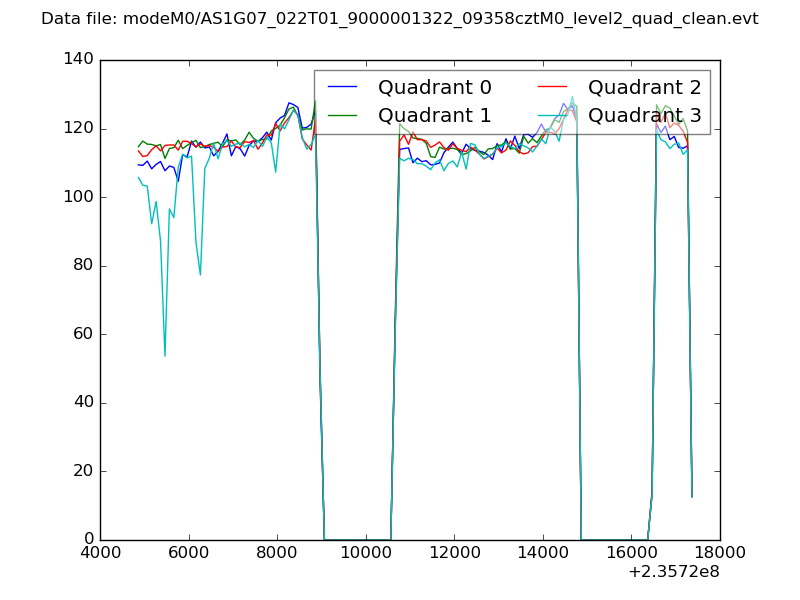 |
|
| Module-wise count rates for Quadrant A Data is divided into 100 sec bins |
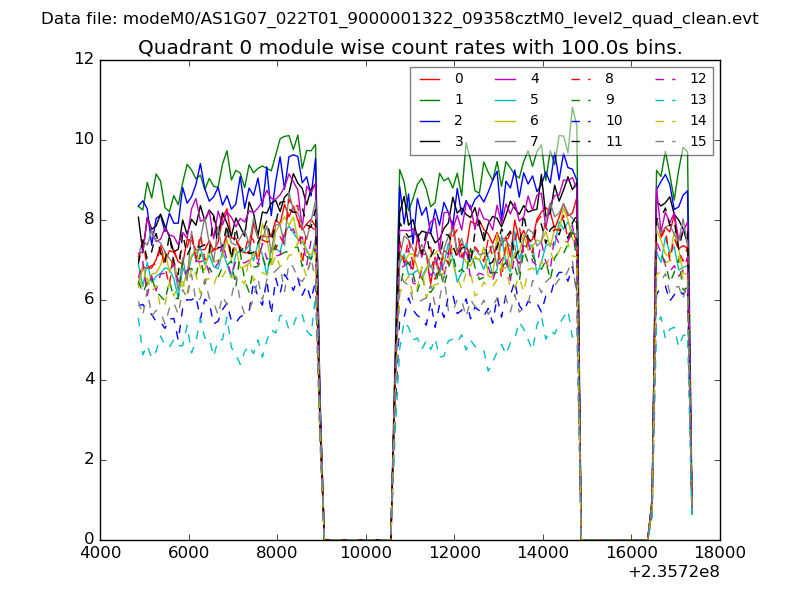 |
 |
| Module-wise count rates for Quadrant B Data is divided into 100 sec bins |
 |
 |
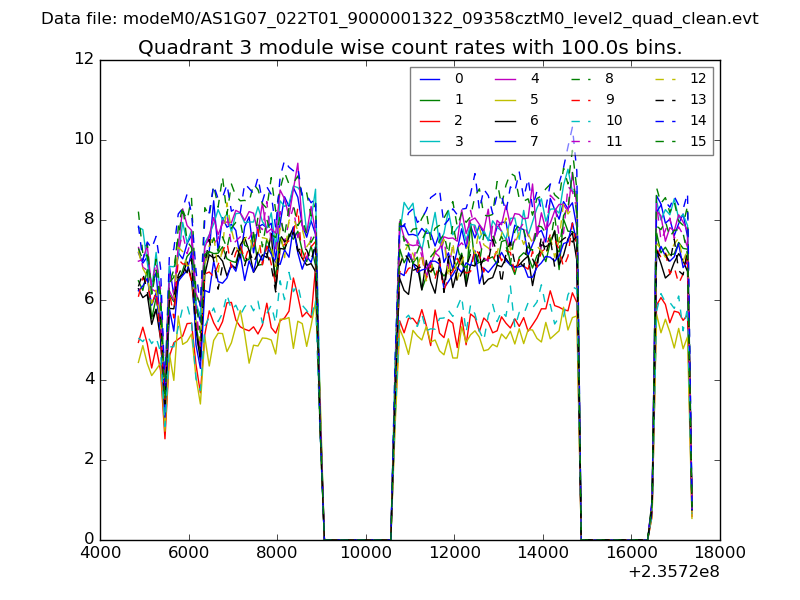
| Module-wise count rates for Quadrant C Data is divided into 100 sec bins |
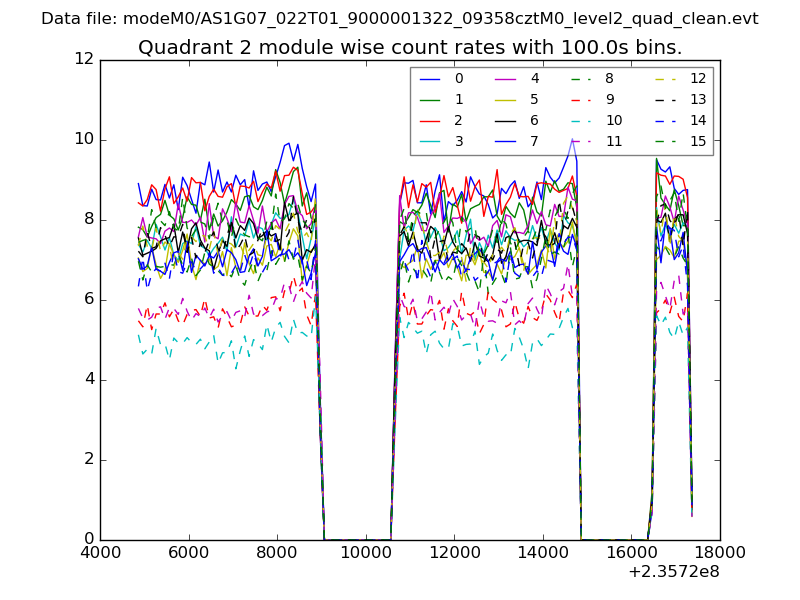 |
 |
| Module-wise count rates for Quadrant D Data is divided into 100 sec bins |
 |
 |
| Parameter | Plot |
|---|---|
| CZT HV Monitor | 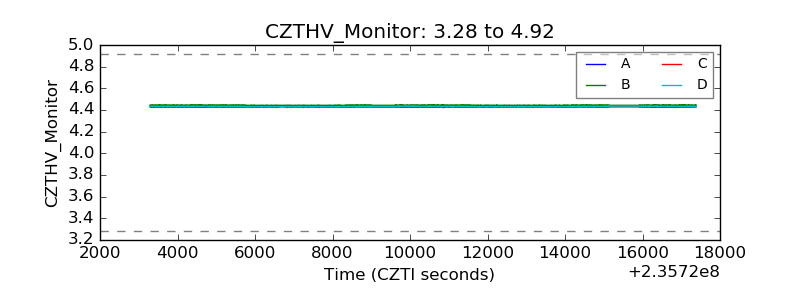 |
| D_VDD | 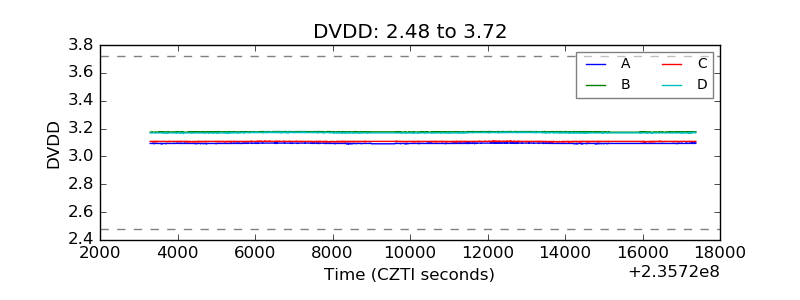 |
| Temperature 1 |  |
| Veto HV Monitor | 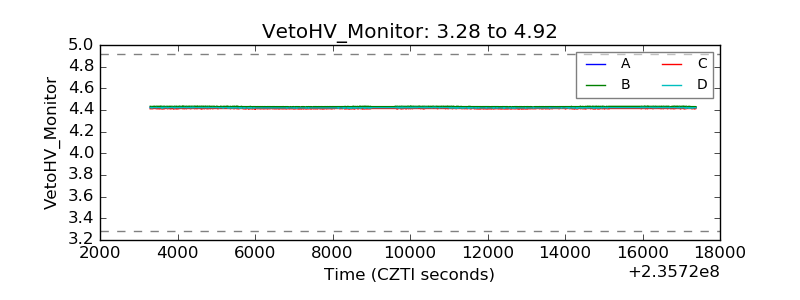 |
| Veto LLD | 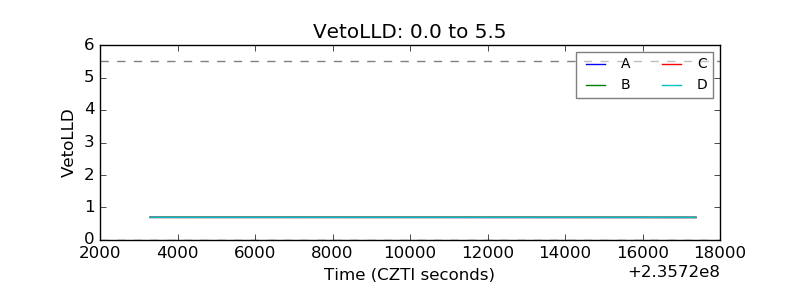 |
| Alpha Counter | 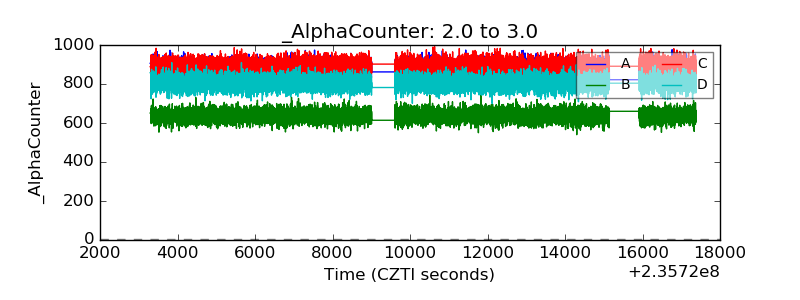 |
| _CPM_Rate | 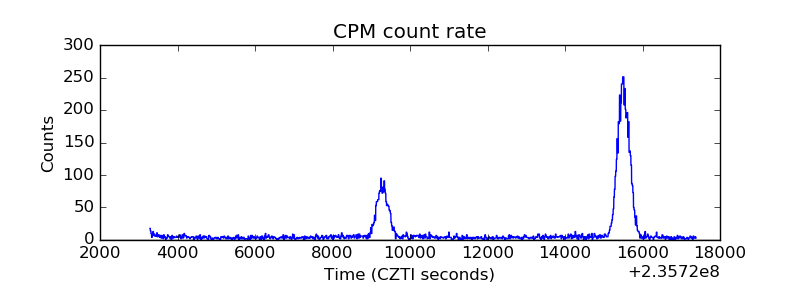 |
| CZT Counter | 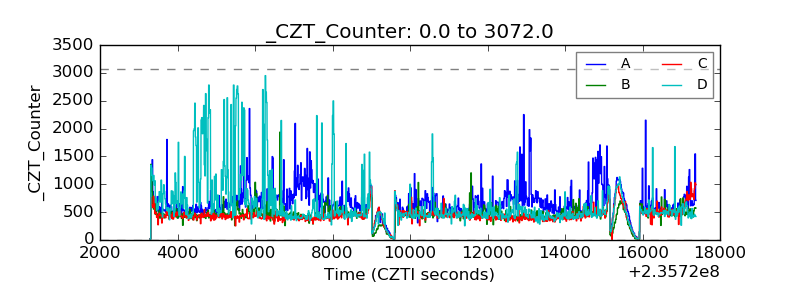 |
| +2.5 Volts monitor |  |
| +5 Volts monitor |  |
| _ROLL_ROT |  |
| _Roll_DEC |  |
| _Roll_RA | 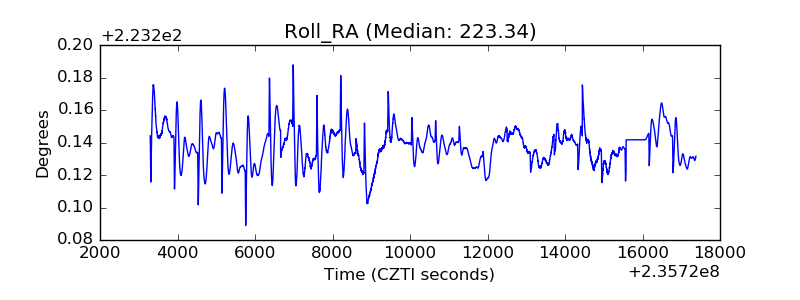 |
| Veto Counter | 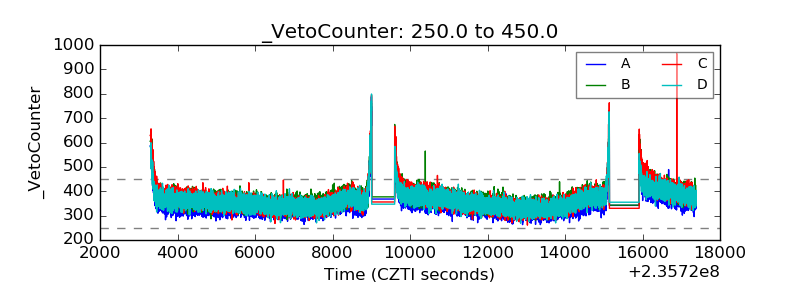 |