| Param | Original file | Final file |
|---|---|---|
| Filename | modeM0/AS1G07_022T01_9000001322_09359cztM0_level2.evt | modeM0/AS1G07_022T01_9000001322_09359cztM0_level2_quad_clean.evt |
| Size (bytes) | 74,658,240 | 15,361,920 |
| Size | 71.2 MB | 14.7 MB |
| Events in quadrant A | 570,995 | 76,945 |
| Events in quadrant B | 555,596 | 109,857 |
| Events in quadrant C | 545,371 | 101,338 |
| Events in quadrant D | 515,146 | 96,969 |
| Mode M0 | |||
|---|---|---|---|
| Quadrant | BADHDUFLAG | Total packets | Discarded packets |
| A | 0 | 10624 | 8392 |
| B | 0 | 7767 | 5418 |
| C | 0 | 8140 | 5758 |
| D | 0 | 8093 | 5863 |
| Mode SS | |||
|---|---|---|---|
| Quadrant | BADHDUFLAG | Total packets | Discarded packets |
| A | 0 | 73 | 55 |
| B | 0 | 73 | 51 |
| C | 0 | 74 | 46 |
| D | 0 | 73 | 53 |
| Mode M9 | |||
|---|---|---|---|
| Quadrant | BADHDUFLAG | Total packets | Discarded packets |
| A | 0 | 3 | 0 |
| B | 0 | 3 | 0 |
| C | 0 | 3 | 1 |
| D | 0 | 4 | 0 |
| Quadrant | Total seconds | Saturated seconds | Saturation percentage |
|---|---|---|---|
| A | 830 | 17 | 2.048193% |
| B | 1125 | 2 | 0.177778% |
| C | 1071 | 2 | 0.186741% |
| D | 1052 | 7 | 0.665399% |
Noise dominated data is calculated using 1-second bins in cleaned event files. If a bin has >2000 counts, and if more than 50% of those come from <1% of pixels, then it is considered to be noise-dominated and hence unusable.
| Quadrant | # 1 sec bins | Bins with >0 counts | Bins with >2000 counts | High rate bins dominated by noise | Noise dominated (total time) | Noise dominated (detector-on time) | Marked lightcurve |
|---|---|---|---|---|---|---|---|
| A | 3691 | 1278 | 2 | 2 | 0.05% | 0.16% | 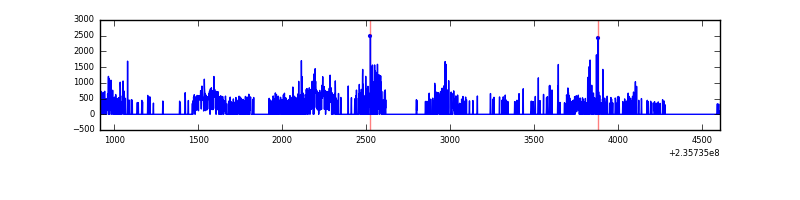 |
| B | 3674 | 1707 | 1 | 1 | 0.03% | 0.06% | 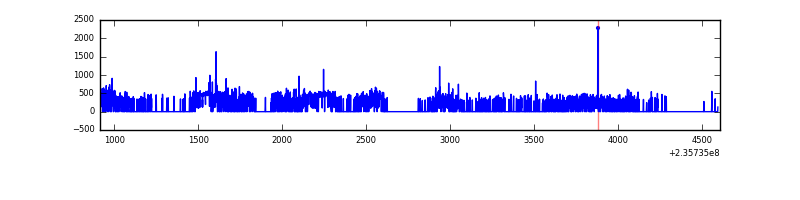 |
| C | 3669 | 1650 | 0 | 0 | 0.00% | 0.00% | 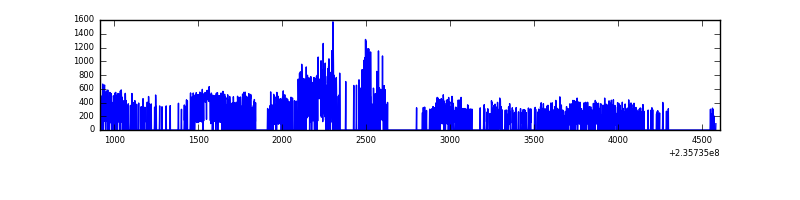 |
| D | 3684 | 1576 | 2 | 2 | 0.05% | 0.13% | 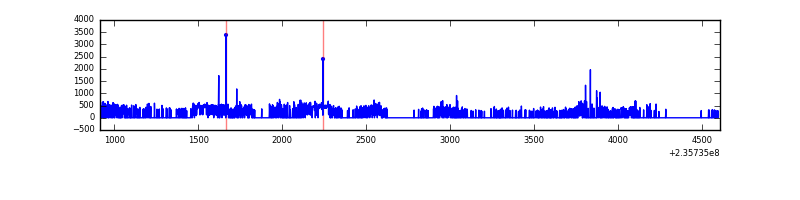 |
Top three noisy pixels from each quadrant. If the there are fewer than three noisy pixels in the level2.evt file, extra rows are filled as -1
| Pixel properties | Quadrant properties | ||||||
|---|---|---|---|---|---|---|---|
| Quadrant | DetID | PixID | Counts | Sigma | Mean | Median | Sigma |
| A | 8 | 5 | 180554 | 8331.07 | 96 | 94 | 21.7 |
| A | 13 | 251 | 9786 | 447.44 | 96 | 94 | 21.7 |
| A | 1 | 162 | 4181 | 188.68 | 96 | 94 | 21.7 |
| B | 4 | 173 | 12546 | 453.59 | 130 | 127 | 27.4 |
| B | 4 | 80 | 6986 | 250.52 | 130 | 127 | 27.4 |
| B | 0 | 219 | 6761 | 242.3 | 130 | 127 | 27.4 |
| C | 9 | 68 | 77229 | 2621.21 | 119 | 119 | 29.4 |
| C | 13 | 61 | 916 | 27.09 | 119 | 119 | 29.4 |
| C | 8 | 222 | 715 | 20.26 | 119 | 119 | 29.4 |
| D | 12 | 227 | 14905 | 471.2 | 119 | 116 | 31.4 |
| D | 1 | 52 | 14291 | 451.64 | 119 | 116 | 31.4 |
| D | 10 | 199 | 9942 | 313.07 | 119 | 116 | 31.4 |
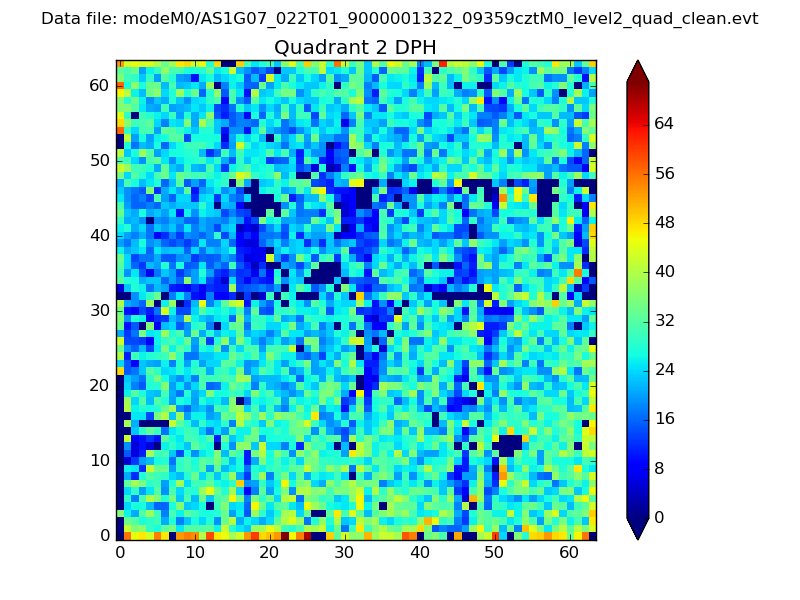
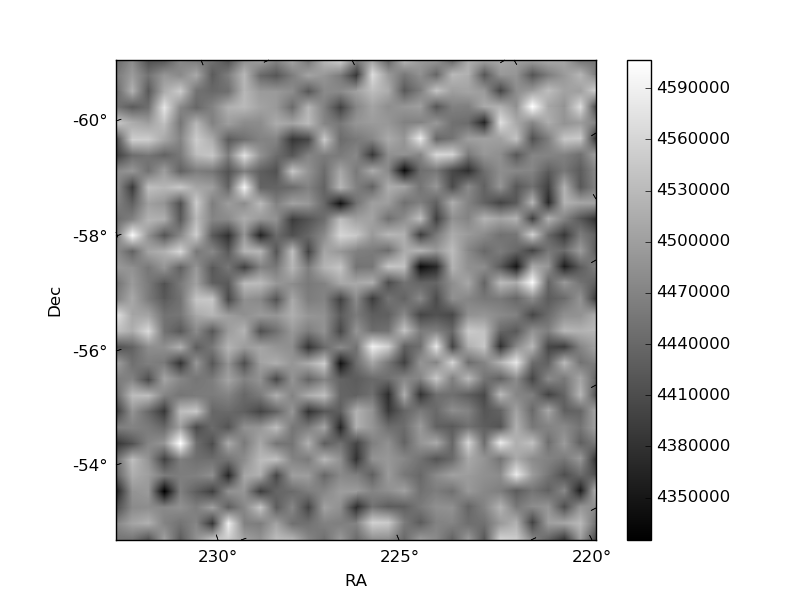
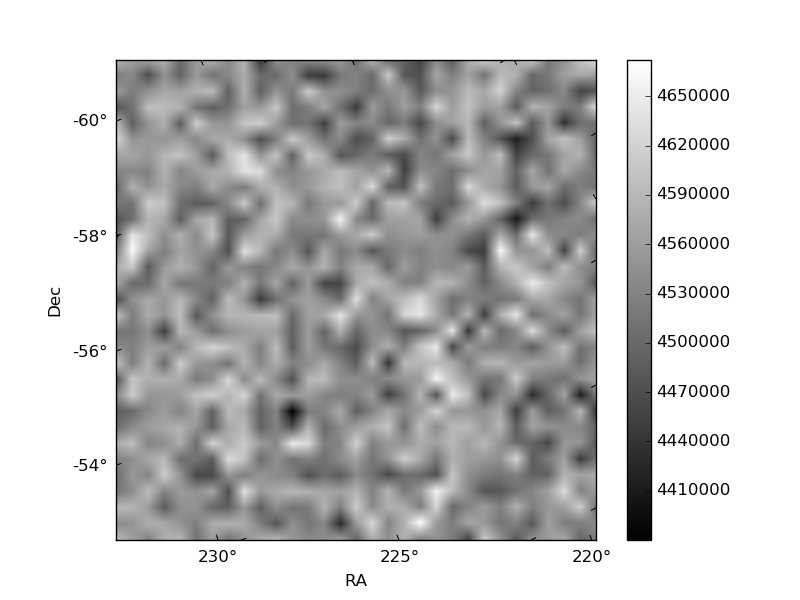
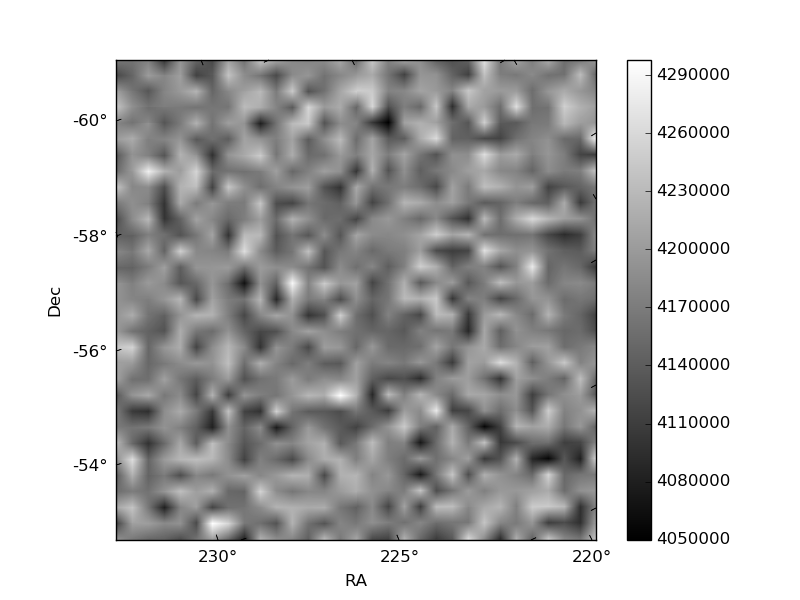
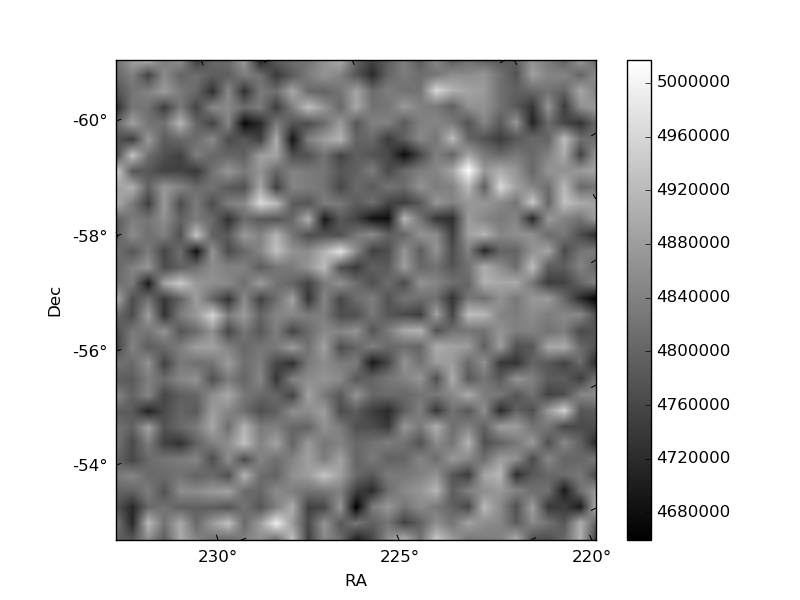
Histogram calculated using DETX and DETY for each event in the final _common_clean file
| Quadrant A | 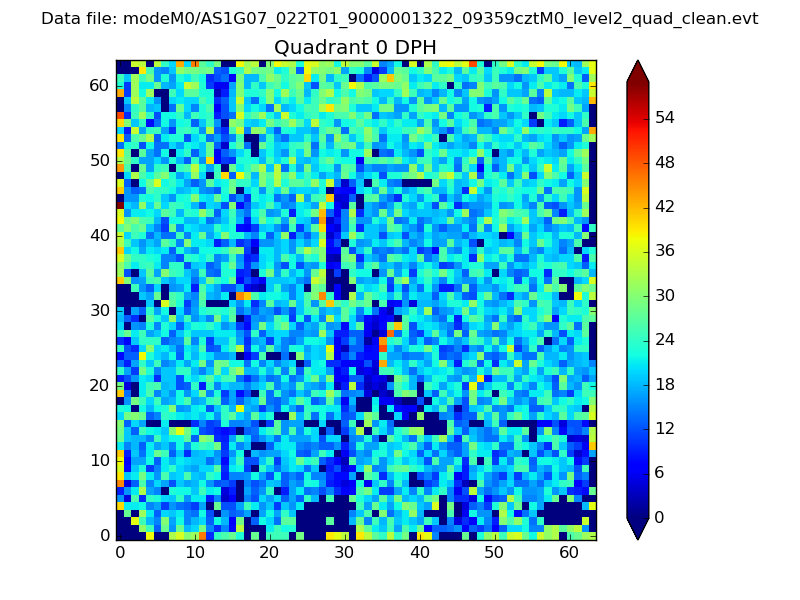 |
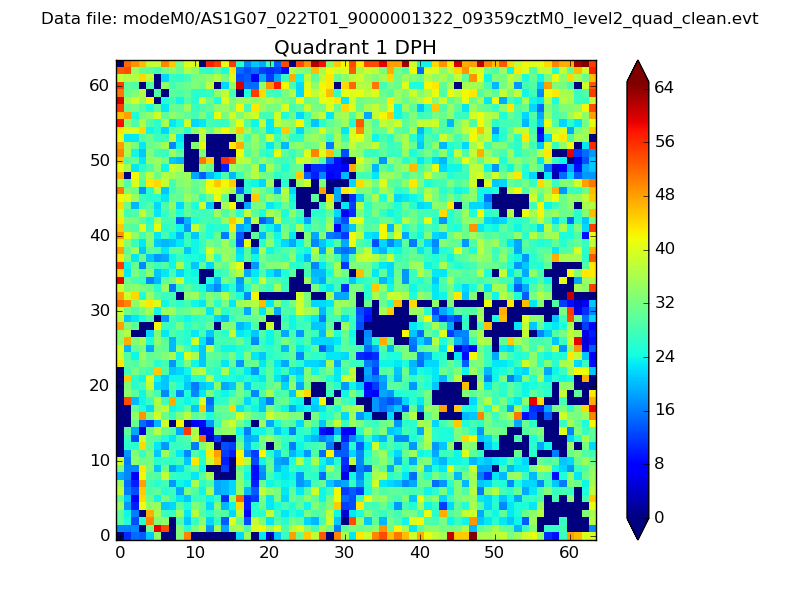 |
Quadrant B |
|---|---|---|---|
| Quadrant D | 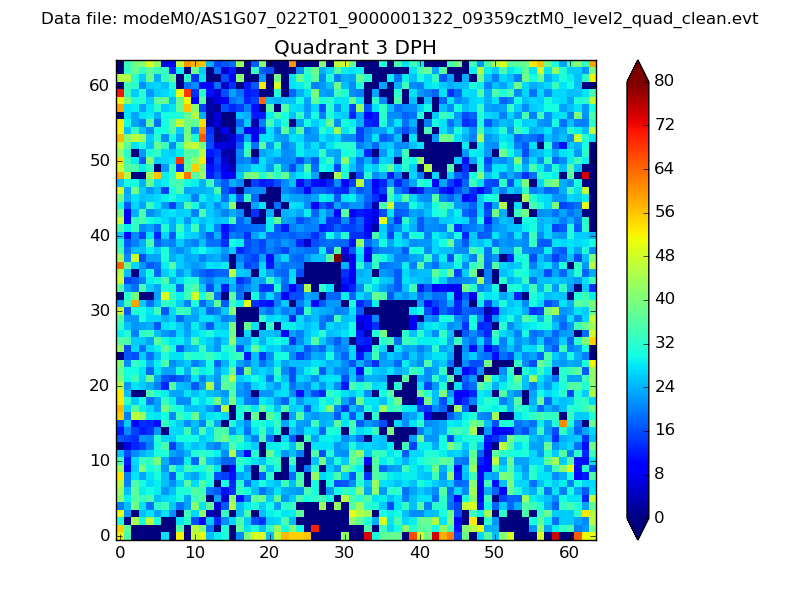 |
 |
Quadrant C |
| Plot type | Count rate plots | Images |
|---|---|---|
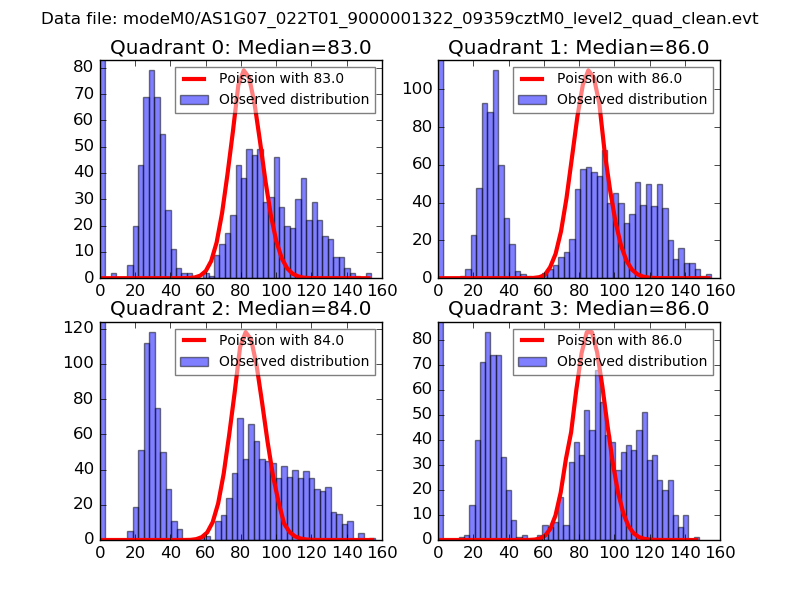
| Comparison with Poisson distribution Blue bars denote a histogram of data divided into 1 sec bins. Red curve is a Poisson curve with rate = median count rate of data. |
 |
 |
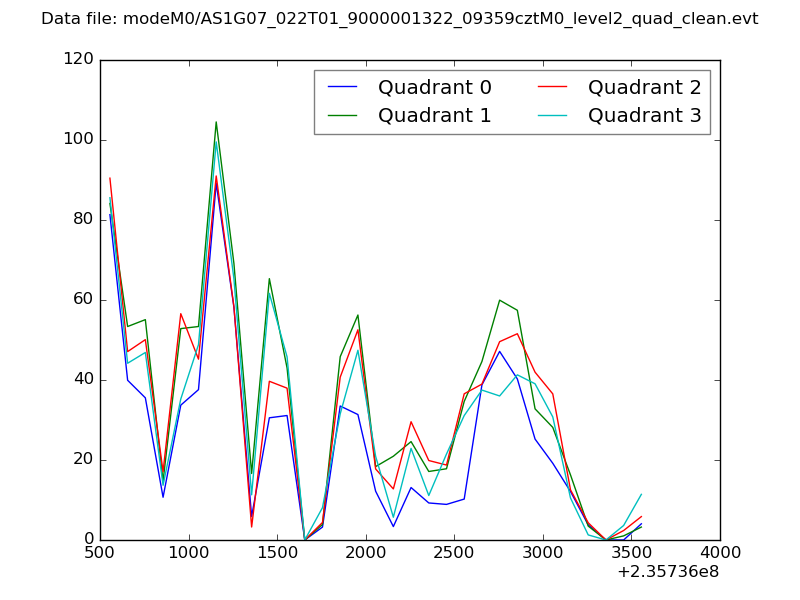
| Quadrant-wise count rates Data is divided into 100 sec bins |
 |
|
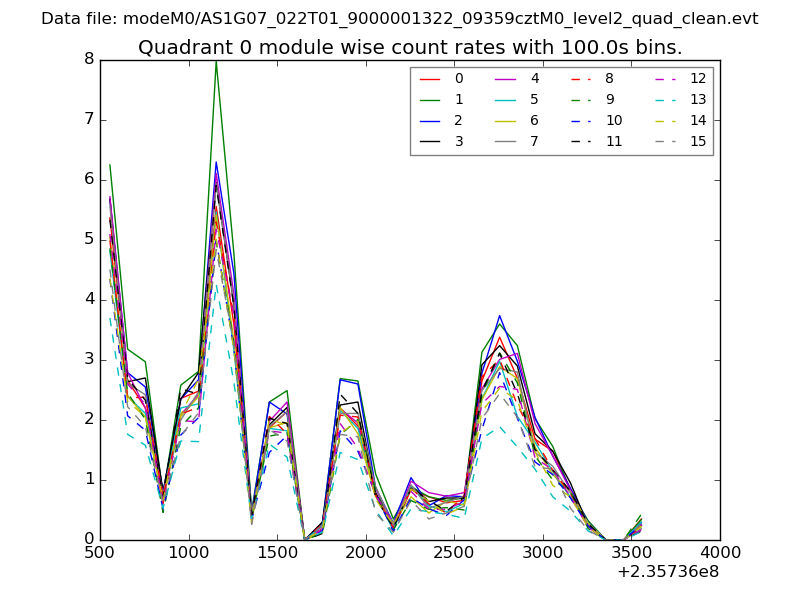
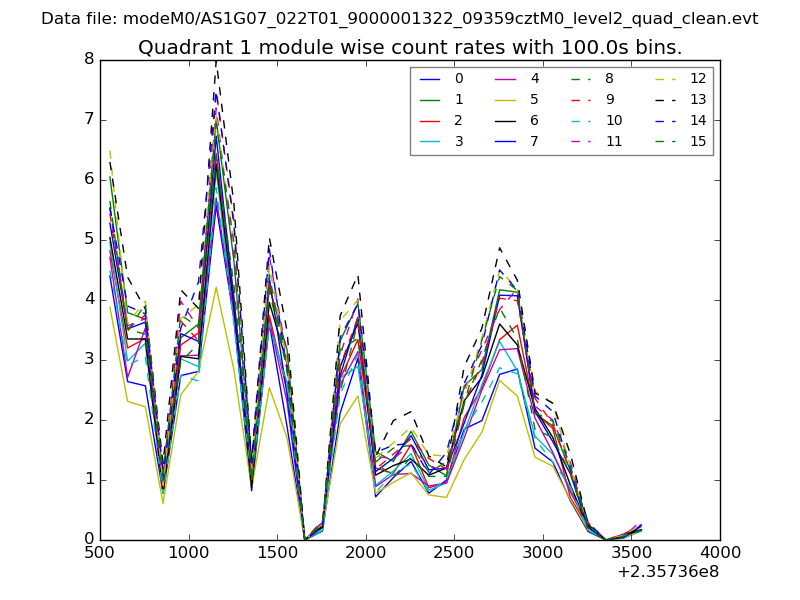
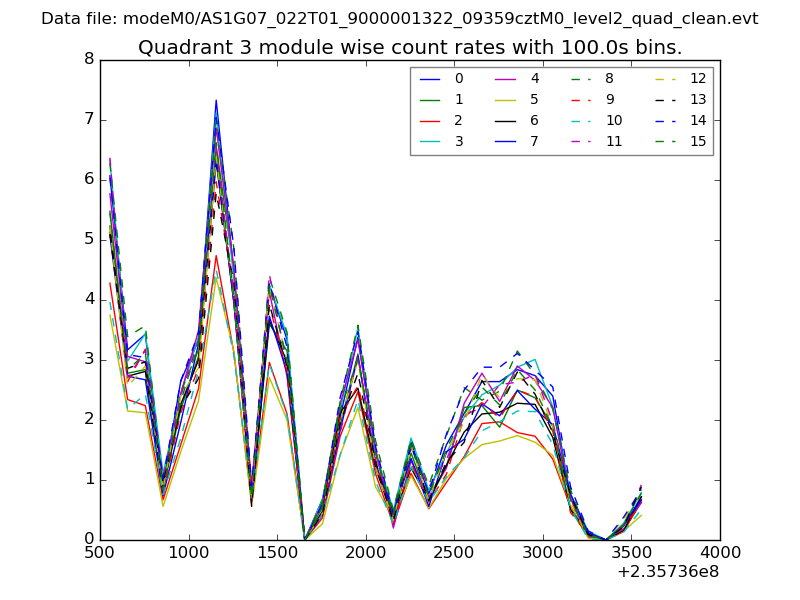
| Module-wise count rates for Quadrant A Data is divided into 100 sec bins |
 |
 |
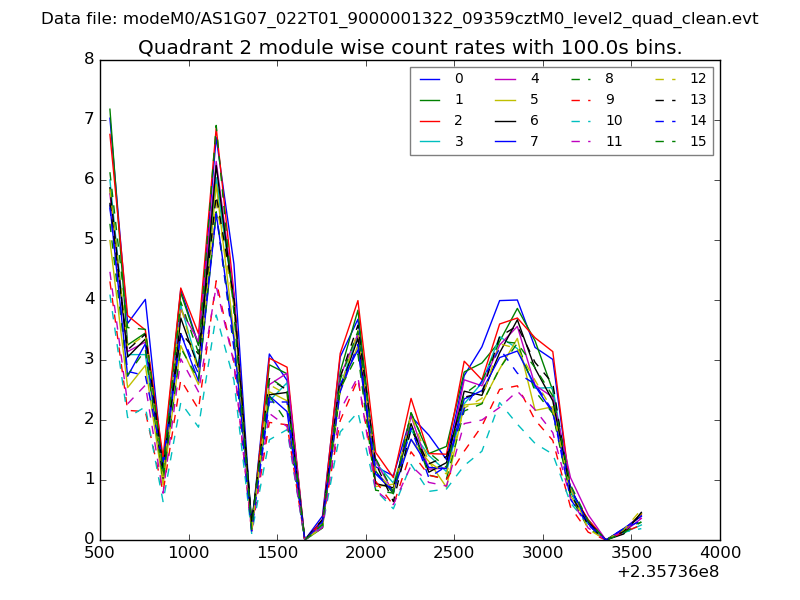
| Module-wise count rates for Quadrant B Data is divided into 100 sec bins |
 |
 |
| Module-wise count rates for Quadrant C Data is divided into 100 sec bins |
 |
 |
| Module-wise count rates for Quadrant D Data is divided into 100 sec bins |
 |
 |
| Parameter | Plot |
|---|---|
| CZT HV Monitor | 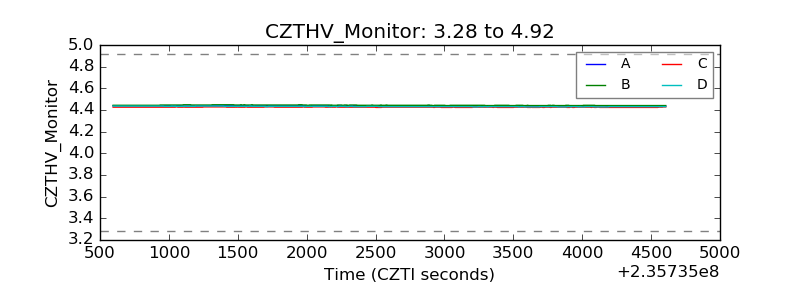 |
| D_VDD | 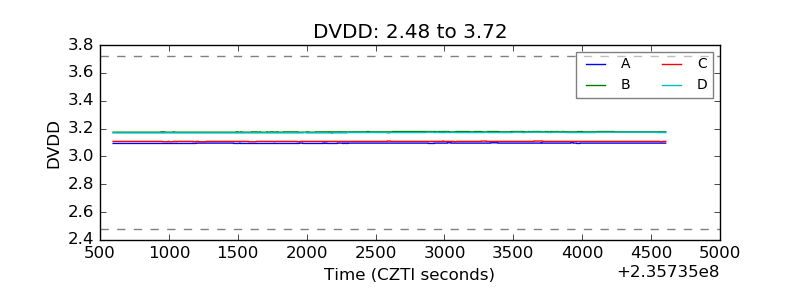 |
| Temperature 1 | 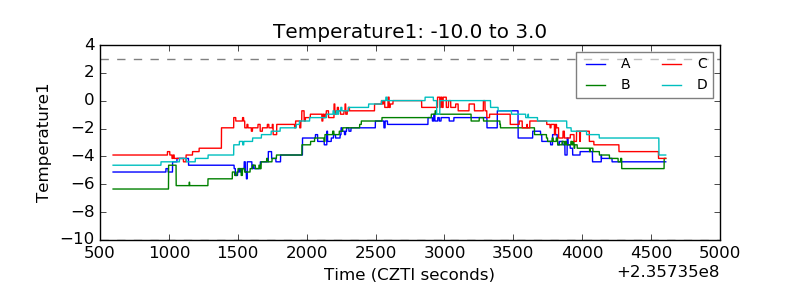 |
| Veto HV Monitor | 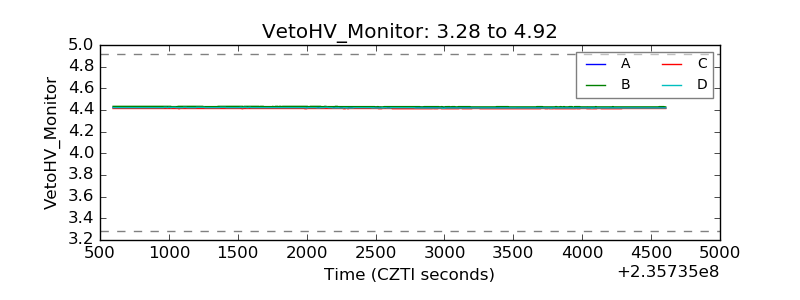 |
| Veto LLD | 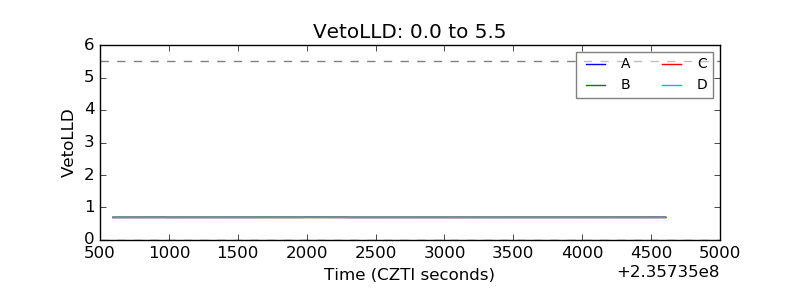 |
| Alpha Counter | 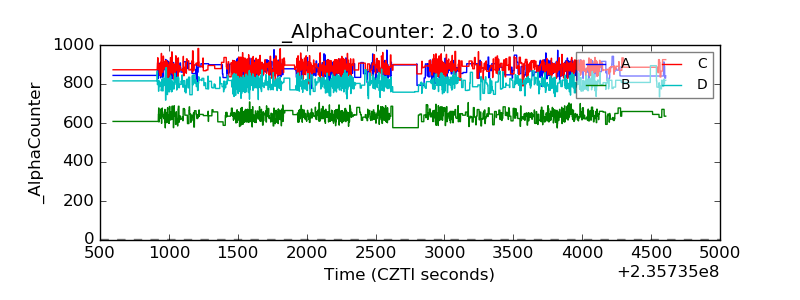 |
| _CPM_Rate | 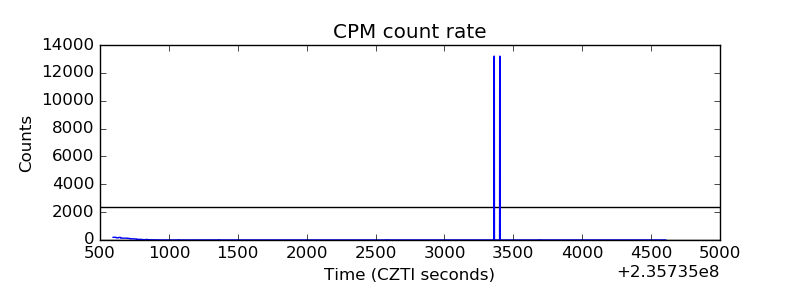 |
| CZT Counter | 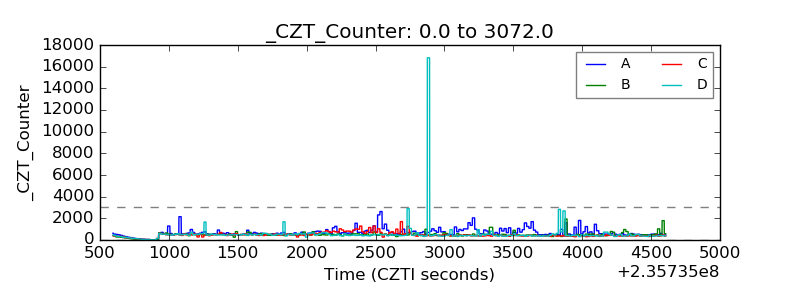 |
| +2.5 Volts monitor |  |
| +5 Volts monitor |  |
| _ROLL_ROT | 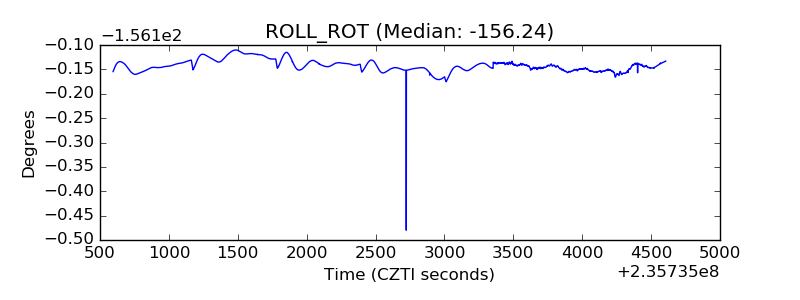 |
| _Roll_DEC | 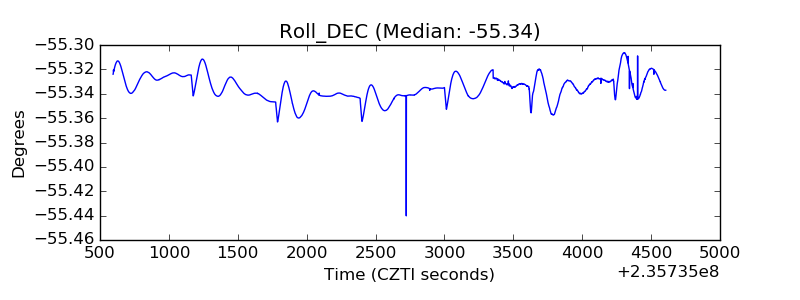 |
| _Roll_RA | 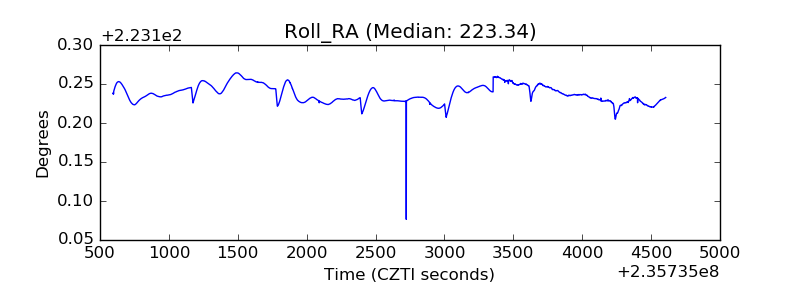 |
| Veto Counter | 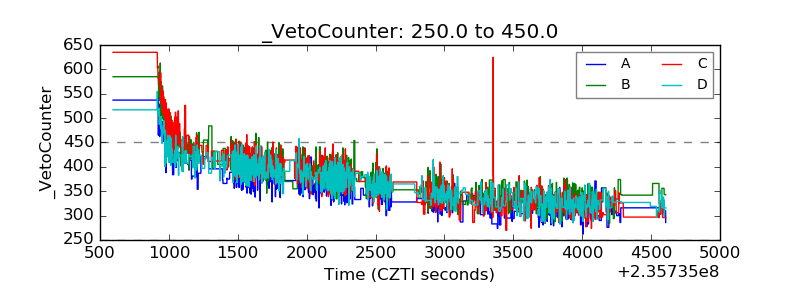 |