| Param | Original file | Final file |
|---|---|---|
| Filename | modeM0/AS1G07_022T01_9000001322_09360cztM0_level2.evt | modeM0/AS1G07_022T01_9000001322_09360cztM0_level2_quad_clean.evt |
| Size (bytes) | 210,697,920 | 46,964,160 |
| Size | 200.9 MB | 44.8 MB |
| Events in quadrant A | 2,110,766 | 306,347 |
| Events in quadrant B | 1,334,136 | 311,109 |
| Events in quadrant C | 1,374,287 | 308,542 |
| Events in quadrant D | 1,376,814 | 302,896 |
| Mode M0 | |||
|---|---|---|---|
| Quadrant | BADHDUFLAG | Total packets | Discarded packets |
| A | 0 | 8146 | 0 |
| B | 0 | 5730 | 0 |
| C | 0 | 6222 | 0 |
| D | 0 | 6084 | 0 |
| Mode SS | |||
|---|---|---|---|
| Quadrant | BADHDUFLAG | Total packets | Discarded packets |
| A | 0 | 54 | 0 |
| B | 0 | 54 | 0 |
| C | 0 | 54 | 0 |
| D | 0 | 54 | 0 |
| Quadrant | Total seconds | Saturated seconds | Saturation percentage |
|---|---|---|---|
| A | 2696 | 74 | 2.744807% |
| B | 2696 | 10 | 0.370920% |
| C | 2696 | 5 | 0.185460% |
| D | 2696 | 46 | 1.706231% |
Noise dominated data is calculated using 1-second bins in cleaned event files. If a bin has >2000 counts, and if more than 50% of those come from <1% of pixels, then it is considered to be noise-dominated and hence unusable.
| Quadrant | # 1 sec bins | Bins with >0 counts | Bins with >2000 counts | High rate bins dominated by noise | Noise dominated (total time) | Noise dominated (detector-on time) | Marked lightcurve |
|---|---|---|---|---|---|---|---|
| A | 2696 | 2696 | 51 | 51 | 1.89% | 1.89% | 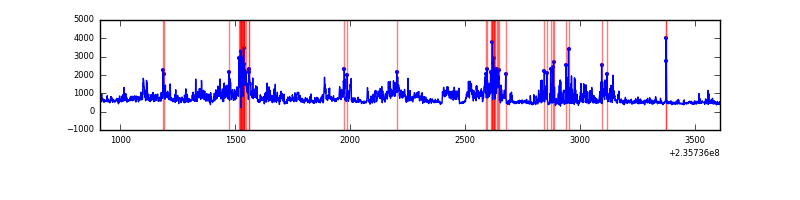 |
| B | 2696 | 2696 | 5 | 5 | 0.19% | 0.19% | 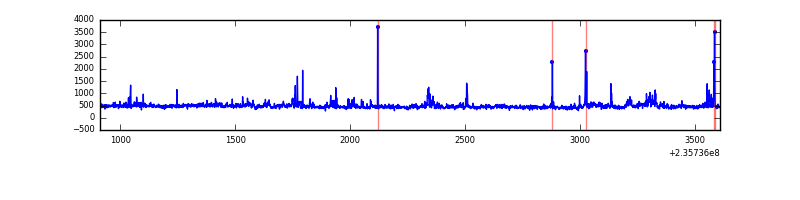 |
| C | 2696 | 2696 | 1 | 1 | 0.04% | 0.04% | 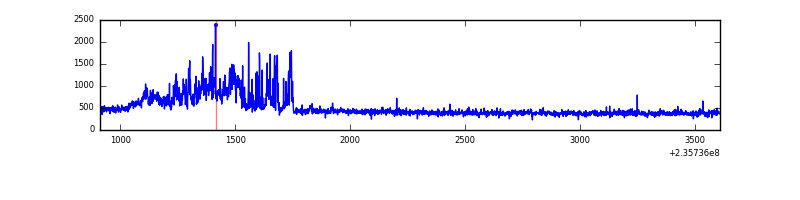 |
| D | 2696 | 2696 | 45 | 45 | 1.67% | 1.67% | 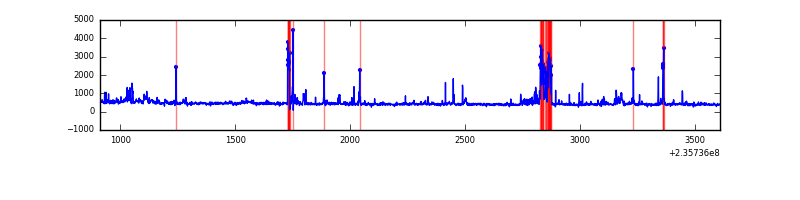 |
Top three noisy pixels from each quadrant. If the there are fewer than three noisy pixels in the level2.evt file, extra rows are filled as -1
| Pixel properties | Quadrant properties | ||||||
|---|---|---|---|---|---|---|---|
| Quadrant | DetID | PixID | Counts | Sigma | Mean | Median | Sigma |
| A | 8 | 5 | 922005 | 15122.32 | 292 | 285 | 61.0 |
| A | 13 | 251 | 21513 | 348.28 | 292 | 285 | 61.0 |
| A | 15 | 174 | 17265 | 278.58 | 292 | 285 | 61.0 |
| B | 0 | 214 | 35129 | 607.27 | 290 | 284 | 57.4 |
| B | 0 | 219 | 32506 | 561.55 | 290 | 284 | 57.4 |
| B | 4 | 173 | 31116 | 537.33 | 290 | 284 | 57.4 |
| C | 9 | 68 | 280965 | 4298.65 | 277 | 277 | 65.3 |
| C | 14 | 234 | 8533 | 126.44 | 277 | 277 | 65.3 |
| C | 13 | 61 | 2133 | 28.42 | 277 | 277 | 65.3 |
| D | 10 | 199 | 111078 | 1446.38 | 278 | 272 | 76.6 |
| D | 7 | 71 | 45930 | 595.99 | 278 | 272 | 76.6 |
| D | 12 | 227 | 35617 | 461.37 | 278 | 272 | 76.6 |
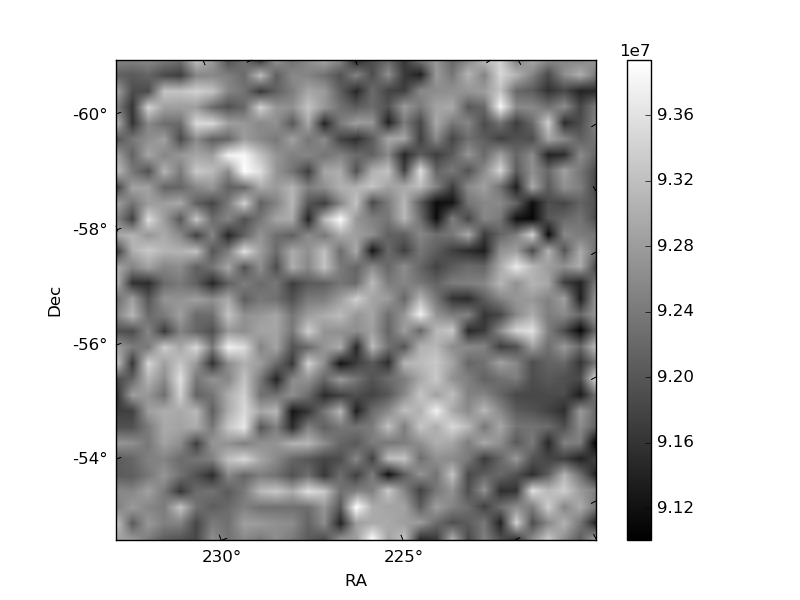
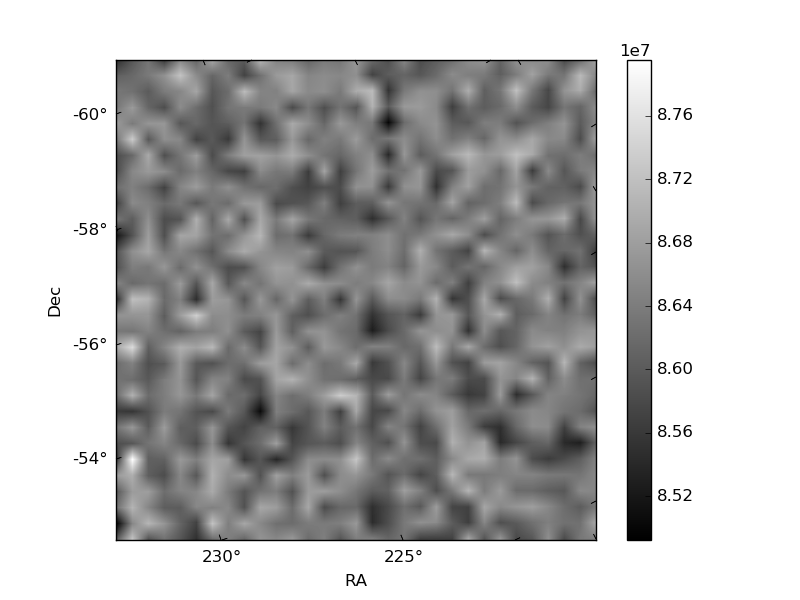
Histogram calculated using DETX and DETY for each event in the final _common_clean file
| Quadrant A | 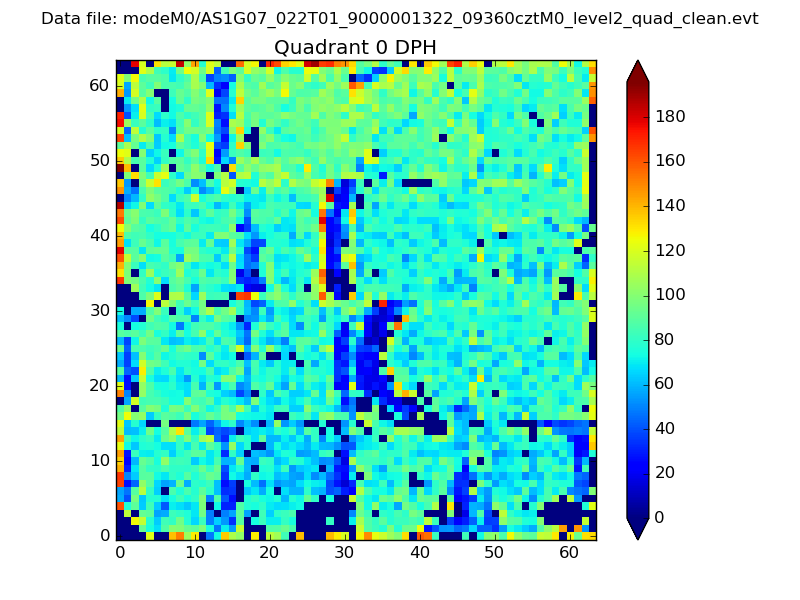 |
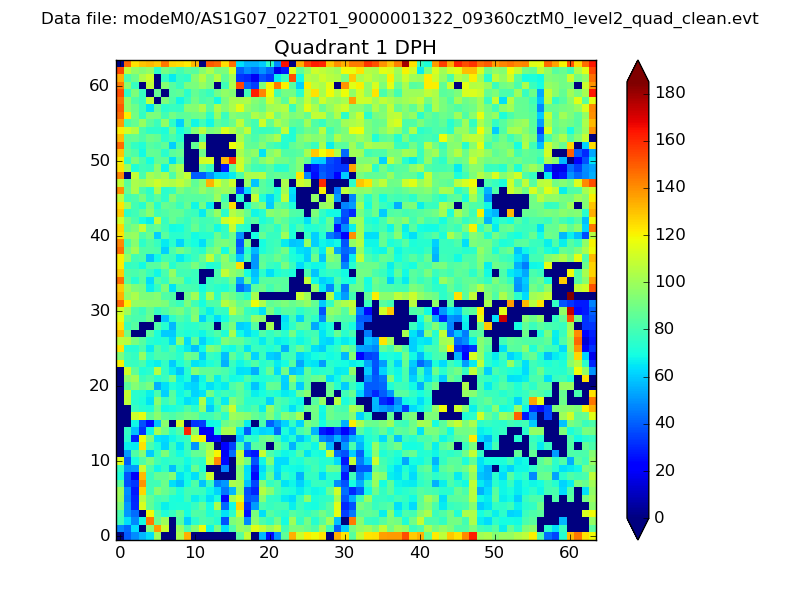 |
Quadrant B |
|---|---|---|---|
| Quadrant D | 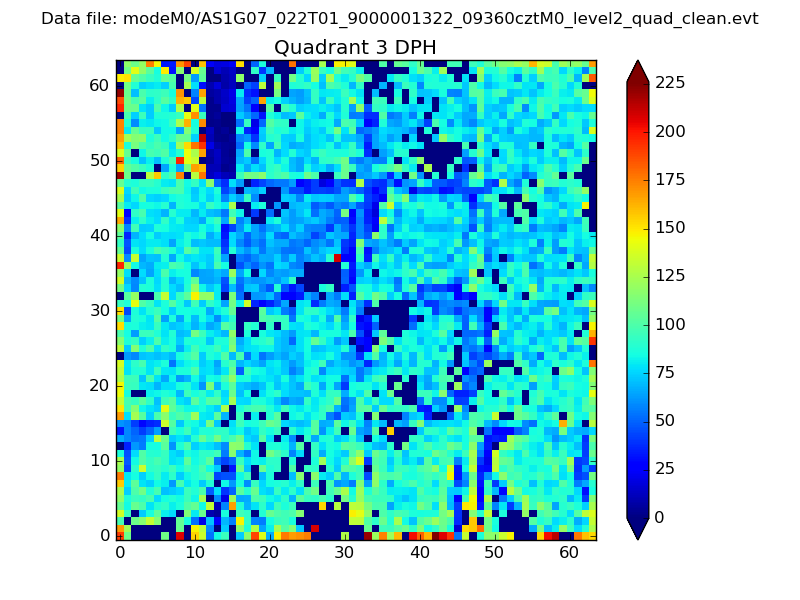 |
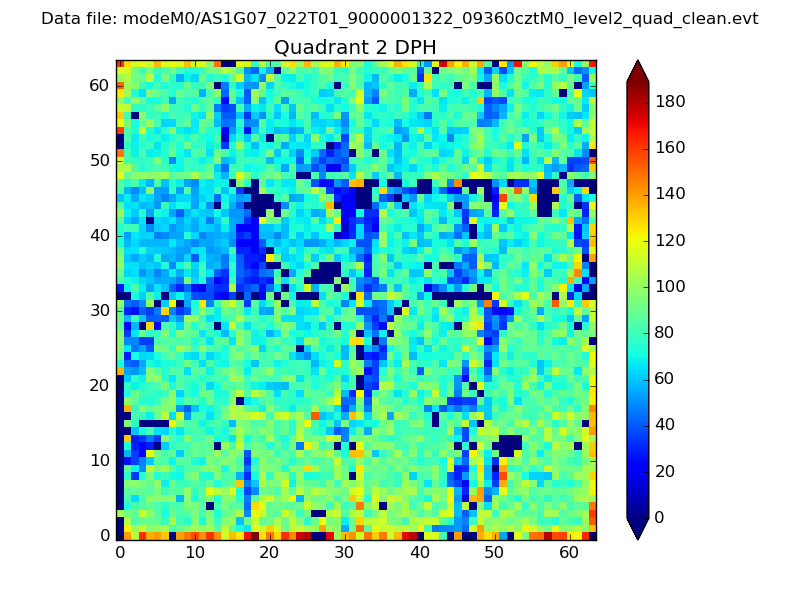 |
Quadrant C |
| Plot type | Count rate plots | Images |
|---|---|---|
| Comparison with Poisson distribution Blue bars denote a histogram of data divided into 1 sec bins. Red curve is a Poisson curve with rate = median count rate of data. |
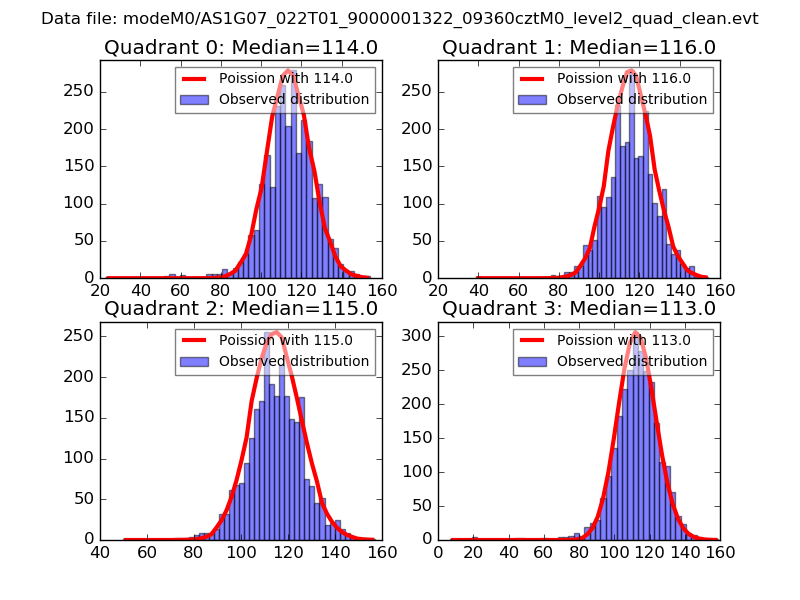 |
 |
| Quadrant-wise count rates Data is divided into 100 sec bins |
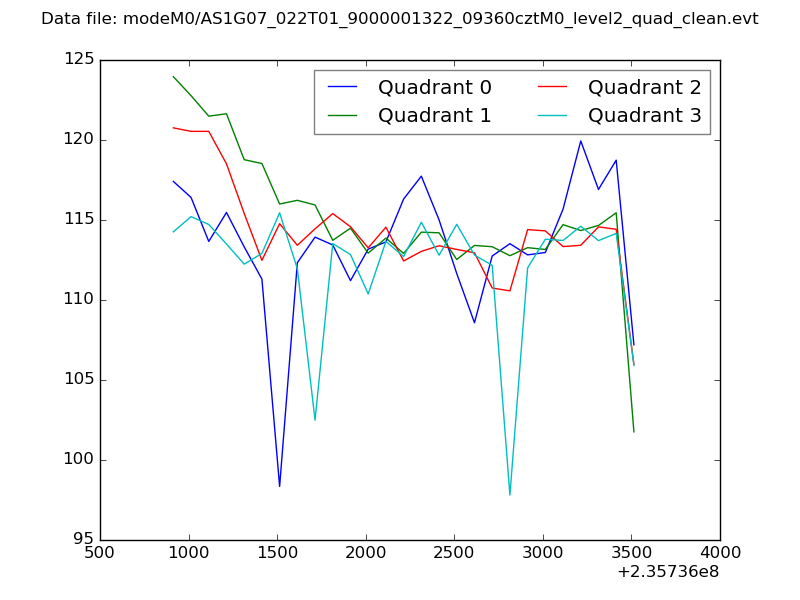 |
|
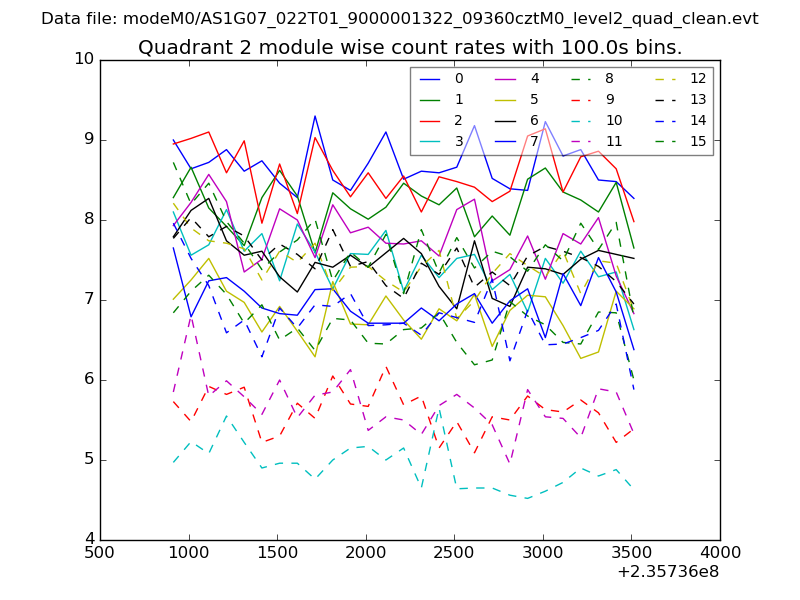
| Module-wise count rates for Quadrant A Data is divided into 100 sec bins |
 |
 |
| Module-wise count rates for Quadrant B Data is divided into 100 sec bins |
 |
 |
| Module-wise count rates for Quadrant C Data is divided into 100 sec bins |
 |
 |
| Module-wise count rates for Quadrant D Data is divided into 100 sec bins |
 |
 |
| Parameter | Plot |
|---|---|
| CZT HV Monitor | 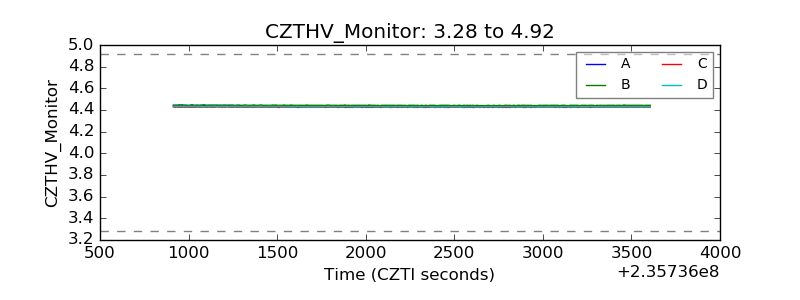 |
| D_VDD | 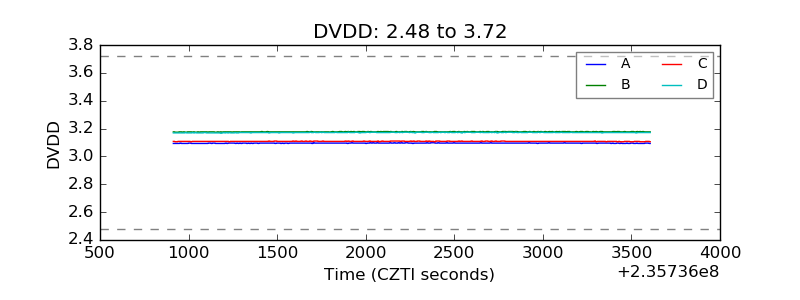 |
| Temperature 1 | 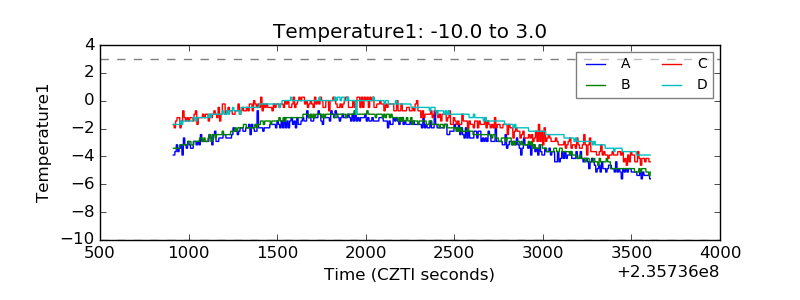 |
| Veto HV Monitor | 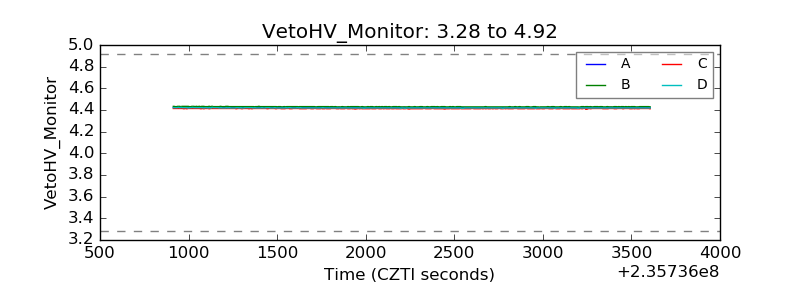 |
| Veto LLD | 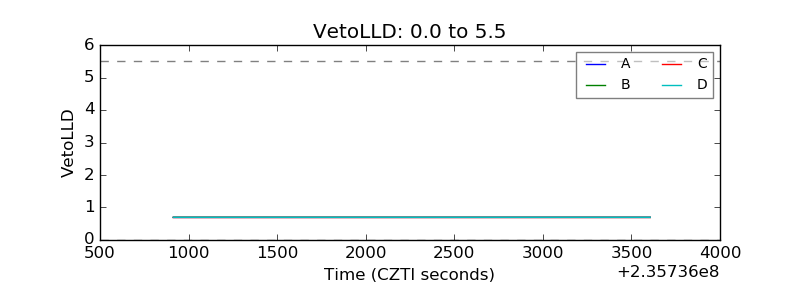 |
| Alpha Counter | 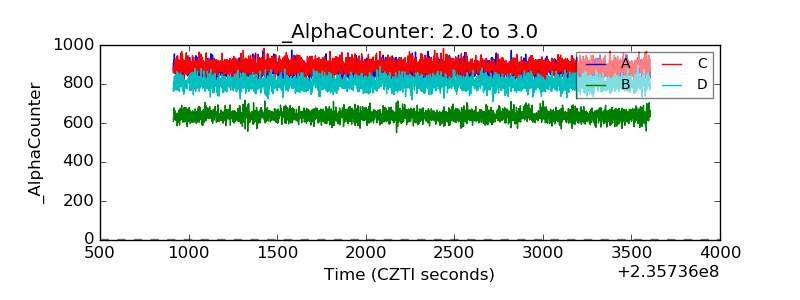 |
| _CPM_Rate | 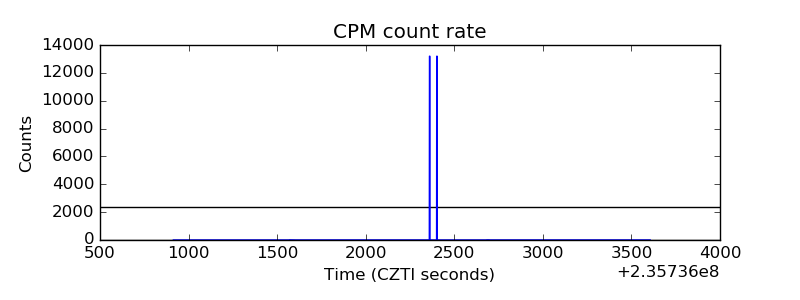 |
| CZT Counter | 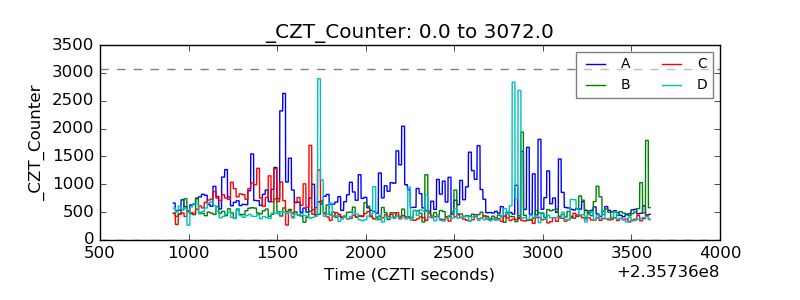 |
| +2.5 Volts monitor | 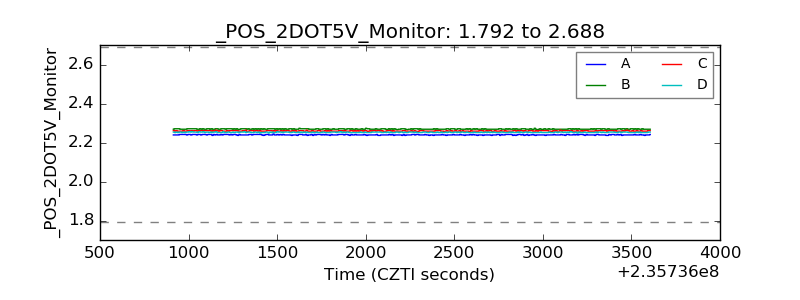 |
| +5 Volts monitor |  |
| _ROLL_ROT | 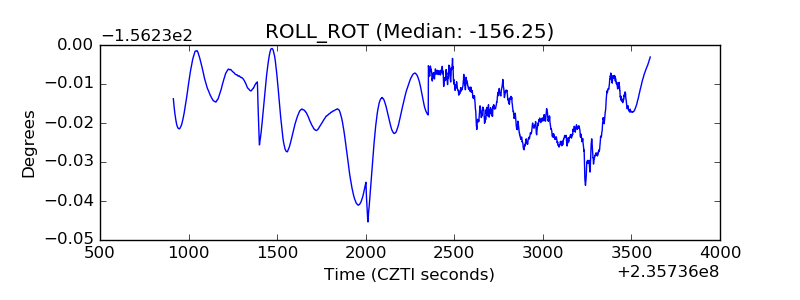 |
| _Roll_DEC | 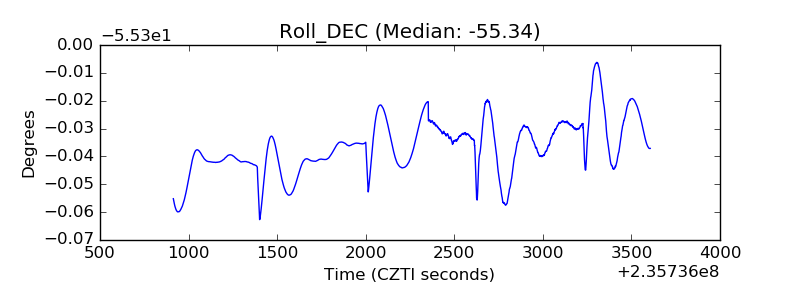 |
| _Roll_RA | 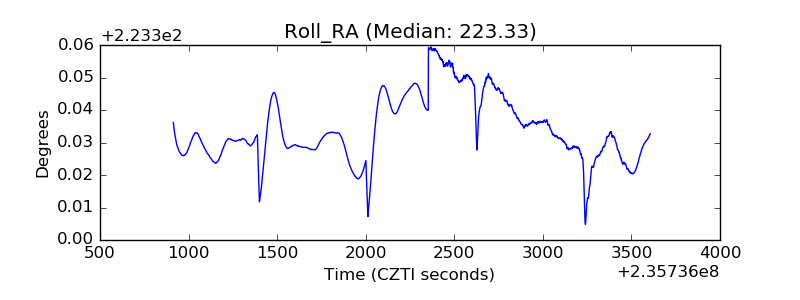 |
| Veto Counter | 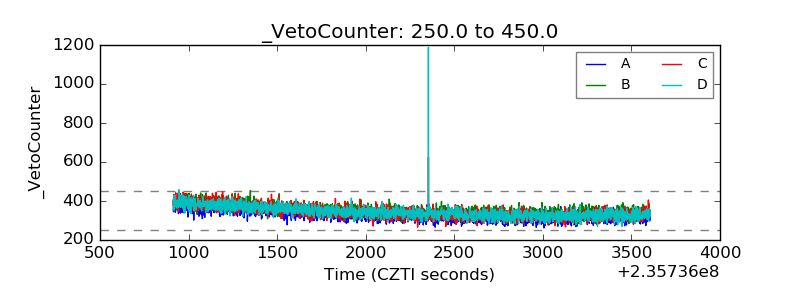 |