| Param | Original file | Final file |
|---|---|---|
| Filename | modeM0/AS1G07_076T02_9000001320cztM0_level2.fits | modeM0/AS1G07_076T02_9000001320cztM0_level2_quad_clean.evt |
| Size (bytes) | 119,059,200 | 88,980,480 |
| Size | 113.5 MB | 84.9 MB |
| Events in quadrant A | 732,866 | 500,785 |
| Events in quadrant B | 707,768 | 507,457 |
| Events in quadrant C | 715,100 | 478,808 |
| Events in quadrant D | 567,734 | 325,539 |
| Mode M9 | |||
|---|---|---|---|
| Quadrant | BADHDUFLAG | Total packets | Discarded packets |
| A | 0 | 27 | 0 |
| B | 0 | 27 | 0 |
| C | 0 | 25 | 0 |
| D | 0 | 25 | 0 |
| Mode M0 | |||
|---|---|---|---|
| Quadrant | BADHDUFLAG | Total packets | Discarded packets |
| A | 0 | 34283 | 0 |
| B | 0 | 27301 | 0 |
| C | 0 | 29009 | 0 |
| D | 0 | 41873 | 0 |
| Mode SS | |||
|---|---|---|---|
| Quadrant | BADHDUFLAG | Total packets | Discarded packets |
| A | 0 | 269 | 0 |
| B | 0 | 262 | 0 |
| C | 0 | 262 | 0 |
| D | 0 | 262 | 0 |
| Quadrant | Total seconds | Saturated seconds | Saturation percentage |
|---|---|---|---|
| A | 12689 | 287 | 2.261802% |
| B | 12745 | 163 | 1.278933% |
| C | 12766 | 286 | 2.240326% |
| D | 12719 | 2142 | 16.840947% |
Noise dominated data is calculated using 1-second bins in cleaned event files. If a bin has >2000 counts, and if more than 50% of those come from <1% of pixels, then it is considered to be noise-dominated and hence unusable.
| Quadrant | # 1 sec bins | Bins with >0 counts | Bins with >2000 counts | High rate bins dominated by noise | Noise dominated (total time) | Noise dominated (detector-on time) | Marked lightcurve |
|---|---|---|---|---|---|---|---|
| A | 16434 | 13059 | 0 | 0 | 0.00% | 0.00% |  |
| B | 16434 | 13114 | 0 | 0 | 0.00% | 0.00% |  |
| C | 16432 | 13142 | 0 | 0 | 0.00% | 0.00% |  |
| D | 16434 | 12960 | 0 | 0 | 0.00% | 0.00% |  |
Top three noisy pixels from each quadrant. If the there are fewer than three noisy pixels in the level2.evt file, extra rows are filled as -1
| Pixel properties | Quadrant properties | ||||||
|---|---|---|---|---|---|---|---|
| Quadrant | DetID | PixID | Counts | Sigma | Mean | Median | Sigma |
| A | 14 | 188 | 748 | 11.47 | 190 | 178 | 49.7 |
| A | 0 | 29 | 733 | 11.17 | 190 | 178 | 49.7 |
| A | 14 | 204 | 660 | 9.7 | 190 | 178 | 49.7 |
| B | 2 | 9 | 656 | 12.08 | 186 | 178 | 39.6 |
| B | 3 | 17 | 487 | 7.81 | 186 | 178 | 39.6 |
| B | 2 | 8 | 485 | 7.76 | 186 | 178 | 39.6 |
| C | 7 | 111 | 509 | 6.45 | 188 | 175 | 51.8 |
| C | 2 | 191 | 508 | 6.43 | 188 | 175 | 51.8 |
| C | 3 | 126 | 491 | 6.1 | 188 | 175 | 51.8 |
| D | 6 | 67 | 415 | 5.84 | 161 | 147 | 45.9 |
| D | 4 | 160 | 408 | 5.69 | 161 | 147 | 45.9 |
| D | 6 | 231 | 405 | 5.63 | 161 | 147 | 45.9 |
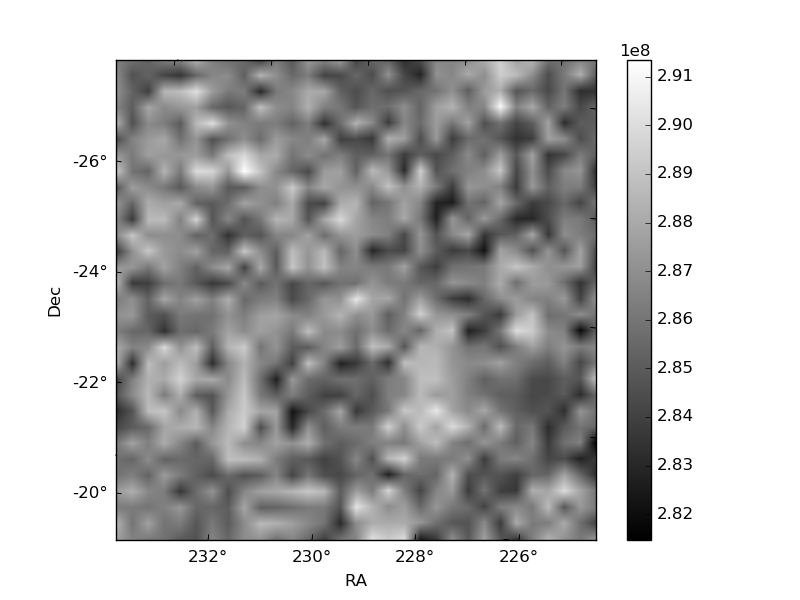
Histogram calculated using DETX and DETY for each event in the final _common_clean file
| Quadrant A |  |
 |
Quadrant B |
|---|---|---|---|
| Quadrant D |  |
 |
Quadrant C |
| Plot type | Count rate plots | Images |
|---|---|---|
| Comparison with Poisson distribution Blue bars denote a histogram of data divided into 1 sec bins. Red curve is a Poisson curve with rate = median count rate of data. |
 |
 |
| Quadrant-wise count rates Data is divided into 100 sec bins |
 |
|
| Module-wise count rates for Quadrant A Data is divided into 100 sec bins |
 |
 |
| Module-wise count rates for Quadrant B Data is divided into 100 sec bins |
 |
 |
| Module-wise count rates for Quadrant C Data is divided into 100 sec bins |
 |
 |
| Module-wise count rates for Quadrant D Data is divided into 100 sec bins |
 |
 |
| Parameter | Plot |
|---|---|
| CZT HV Monitor |  |
| D_VDD |  |
| Temperature 1 | 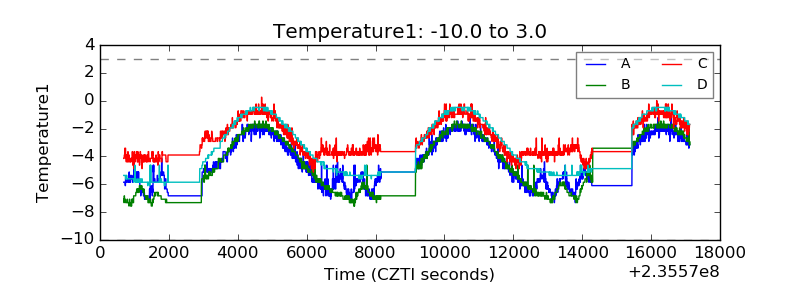 |
| Veto HV Monitor |  |
| Veto LLD |  |
| Alpha Counter |  |
| _CPM_Rate | 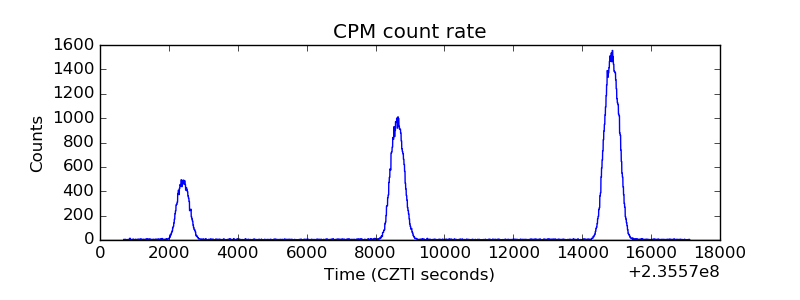 |
| CZT Counter |  |
| +2.5 Volts monitor |  |
| +5 Volts monitor |  |
| _ROLL_ROT |  |
| _Roll_DEC |  |
| _Roll_RA |  |
| Veto Counter |  |