| Param | Original file | Final file |
|---|---|---|
| Filename | modeM0/AS1G07_076T02_9000001320_09334cztM0_level2.evt | modeM0/AS1G07_076T02_9000001320_09334cztM0_level2_quad_clean.evt |
| Size (bytes) | 1,029,369,600 | 168,312,960 |
| Size | 981.7 MB | 160.5 MB |
| Events in quadrant A | 7,935,914 | 1,133,116 |
| Events in quadrant B | 5,751,886 | 1,141,622 |
| Events in quadrant C | 6,200,122 | 1,096,605 |
| Events in quadrant D | 10,511,200 | 931,282 |
| Mode M9 | |||
|---|---|---|---|
| Quadrant | BADHDUFLAG | Total packets | Discarded packets |
| A | 0 | 21 | 0 |
| B | 0 | 21 | 0 |
| C | 0 | 21 | 0 |
| D | 0 | 21 | 0 |
| Mode M0 | |||
|---|---|---|---|
| Quadrant | BADHDUFLAG | Total packets | Discarded packets |
| A | 0 | 31569 | 2 |
| B | 0 | 24701 | 2 |
| C | 0 | 26356 | 2 |
| D | 0 | 39235 | 2 |
| Mode SS | |||
|---|---|---|---|
| Quadrant | BADHDUFLAG | Total packets | Discarded packets |
| A | 0 | 234 | 0 |
| B | 0 | 234 | 0 |
| C | 0 | 234 | 0 |
| D | 0 | 234 | 0 |
| Quadrant | Total seconds | Saturated seconds | Saturation percentage |
|---|---|---|---|
| A | 11478 | 255 | 2.221641% |
| B | 11478 | 146 | 1.271999% |
| C | 11478 | 256 | 2.230354% |
| D | 11478 | 2123 | 18.496254% |
Noise dominated data is calculated using 1-second bins in cleaned event files. If a bin has >2000 counts, and if more than 50% of those come from <1% of pixels, then it is considered to be noise-dominated and hence unusable.
| Quadrant | # 1 sec bins | Bins with >0 counts | Bins with >2000 counts | High rate bins dominated by noise | Noise dominated (total time) | Noise dominated (detector-on time) | Marked lightcurve |
|---|---|---|---|---|---|---|---|
| A | 13608 | 11479 | 47 | 47 | 0.35% | 0.41% | 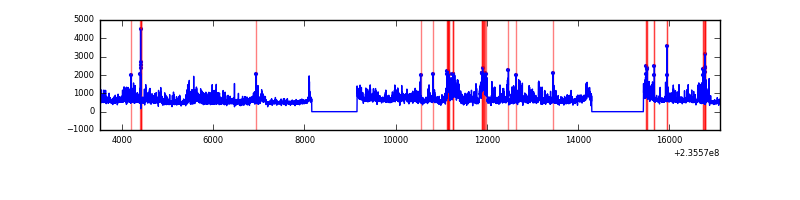 |
| B | 13608 | 11480 | 9 | 9 | 0.07% | 0.08% | 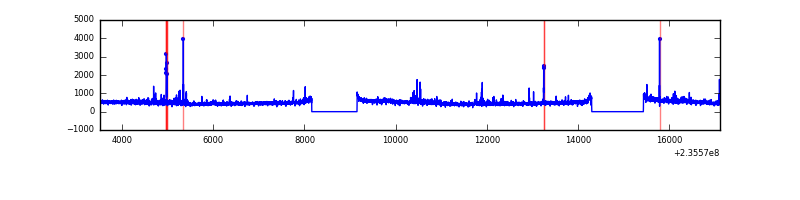 |
| C | 13608 | 11480 | 116 | 116 | 0.85% | 1.01% | 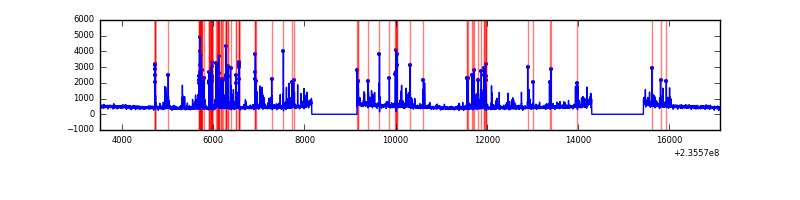 |
| D | 13608 | 11480 | 1852 | 1852 | 13.61% | 16.13% | 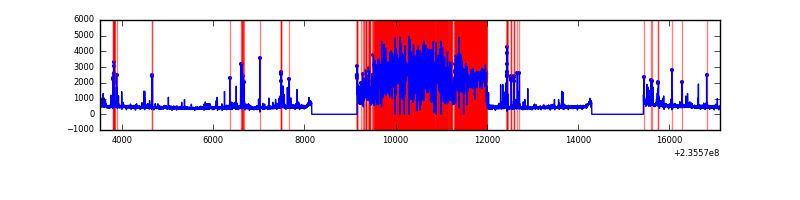 |
Top three noisy pixels from each quadrant. If the there are fewer than three noisy pixels in the level2.evt file, extra rows are filled as -1
| Pixel properties | Quadrant properties | ||||||
|---|---|---|---|---|---|---|---|
| Quadrant | DetID | PixID | Counts | Sigma | Mean | Median | Sigma |
| A | 8 | 5 | 2346652 | 8345.47 | 1393 | 1366 | 281.0 |
| A | 1 | 162 | 81811 | 286.26 | 1393 | 1366 | 281.0 |
| A | 15 | 174 | 63322 | 220.46 | 1393 | 1366 | 281.0 |
| B | 0 | 214 | 115363 | 431.03 | 1388 | 1358 | 264.5 |
| B | 10 | 245 | 62959 | 232.9 | 1388 | 1358 | 264.5 |
| B | 0 | 187 | 49062 | 180.36 | 1388 | 1358 | 264.5 |
| C | 4 | 254 | 991951 | 3222.06 | 1326 | 1333 | 307.4 |
| C | 8 | 128 | 12655 | 36.83 | 1326 | 1333 | 307.4 |
| C | 13 | 61 | 10140 | 28.65 | 1326 | 1333 | 307.4 |
| D | 1 | 52 | 4394611 | 14720.69 | 1212 | 1182 | 298.5 |
| D | 7 | 71 | 1039857 | 3480.2 | 1212 | 1182 | 298.5 |
| D | 12 | 233 | 186359 | 620.46 | 1212 | 1182 | 298.5 |
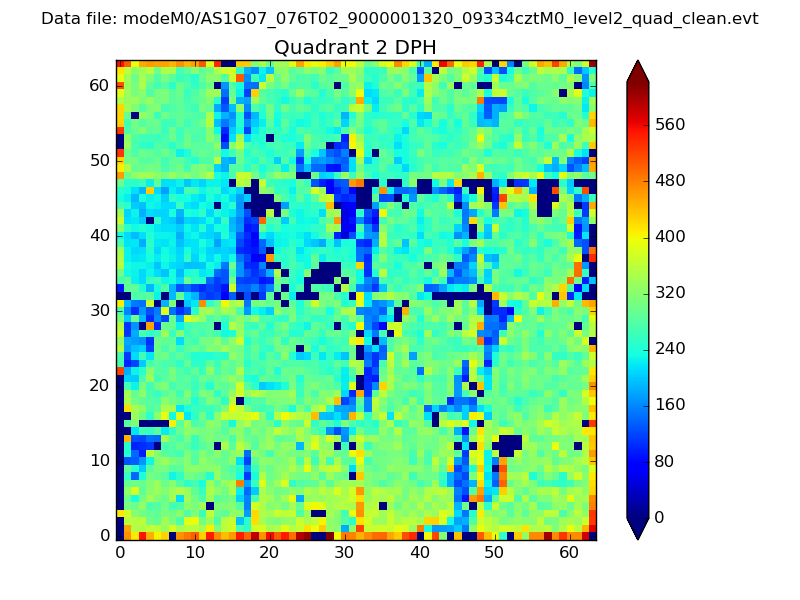
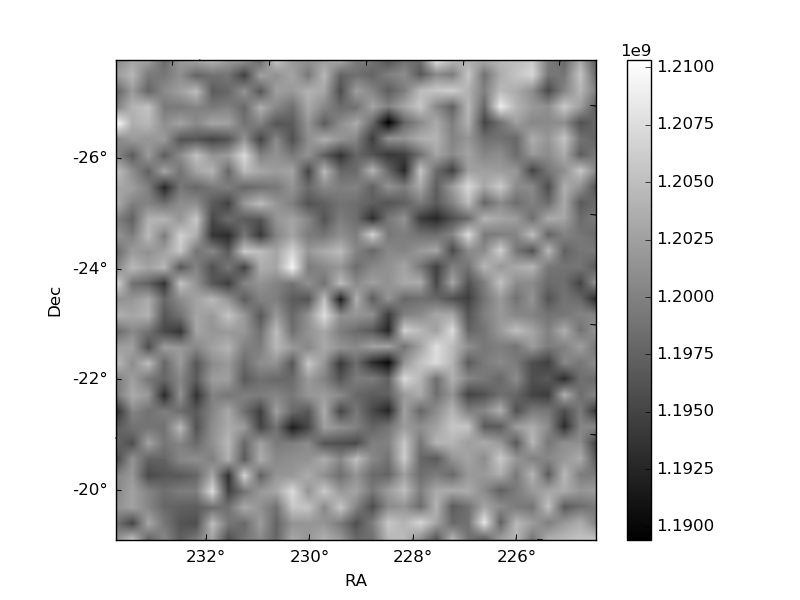
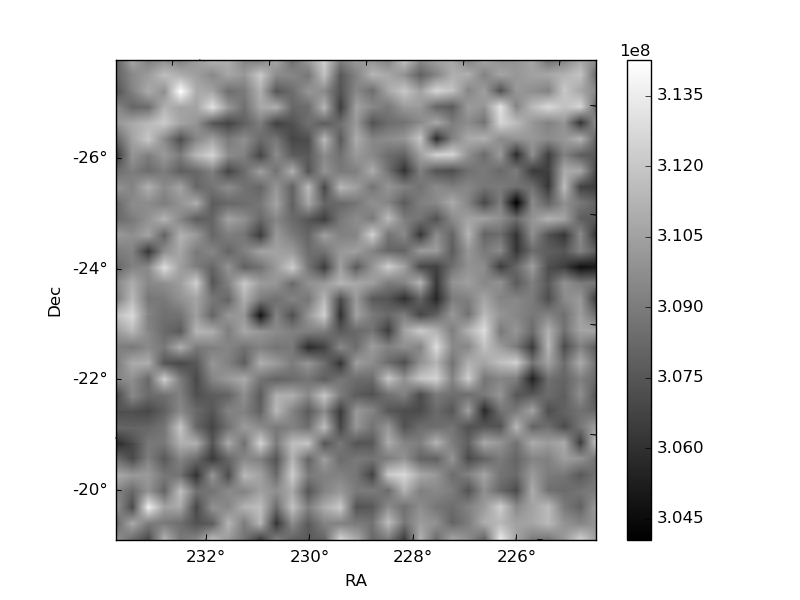
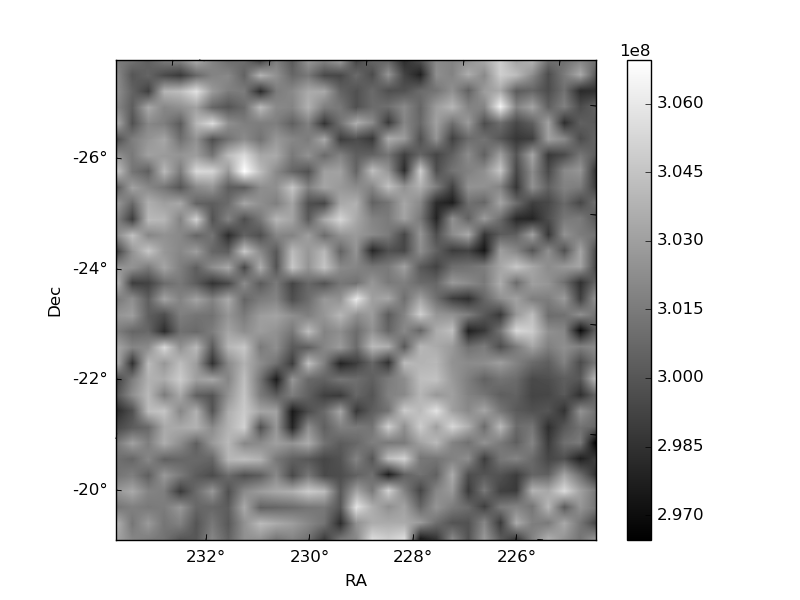
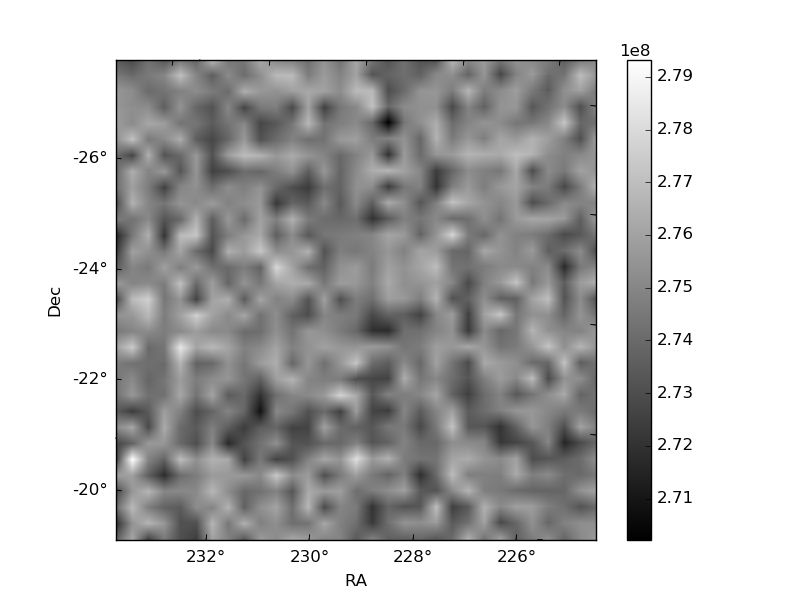
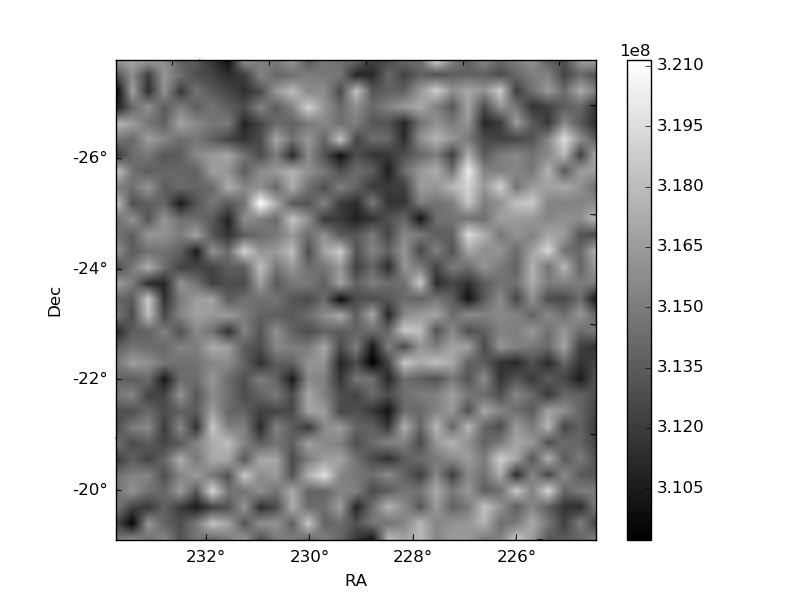
Histogram calculated using DETX and DETY for each event in the final _common_clean file
| Quadrant A | 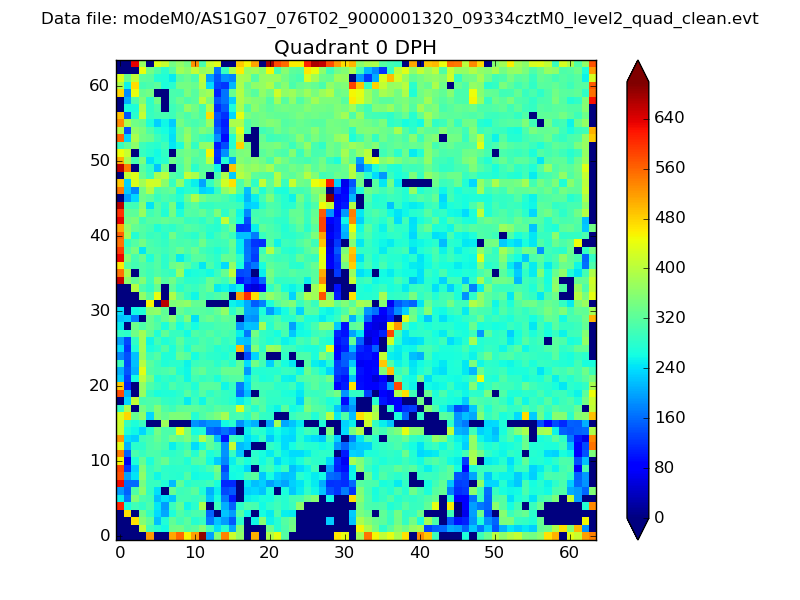 |
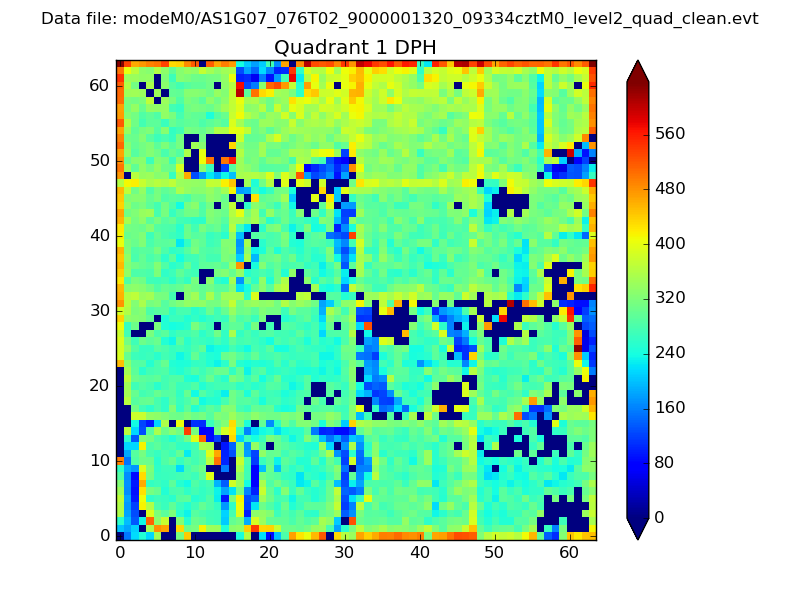 |
Quadrant B |
|---|---|---|---|
| Quadrant D | 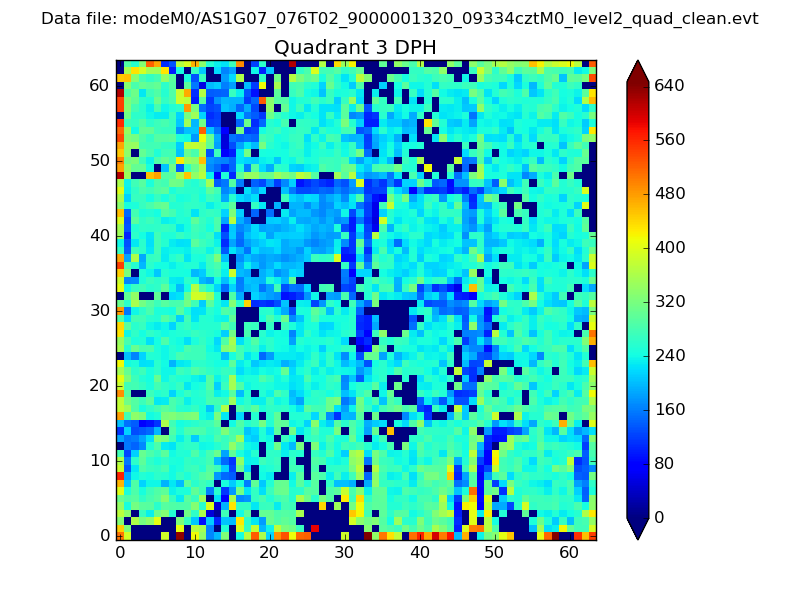 |
 |
Quadrant C |
| Plot type | Count rate plots | Images |
|---|---|---|
| Comparison with Poisson distribution Blue bars denote a histogram of data divided into 1 sec bins. Red curve is a Poisson curve with rate = median count rate of data. |
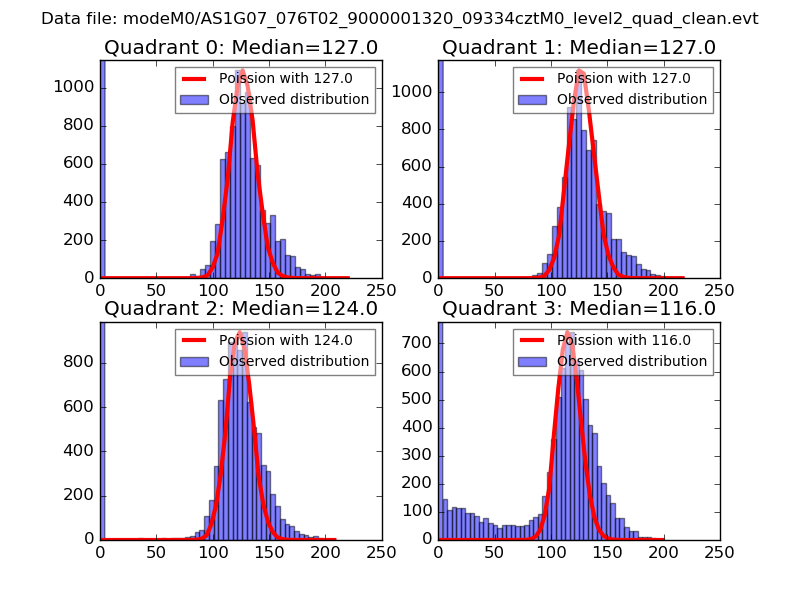 |
 |
| Quadrant-wise count rates Data is divided into 100 sec bins |
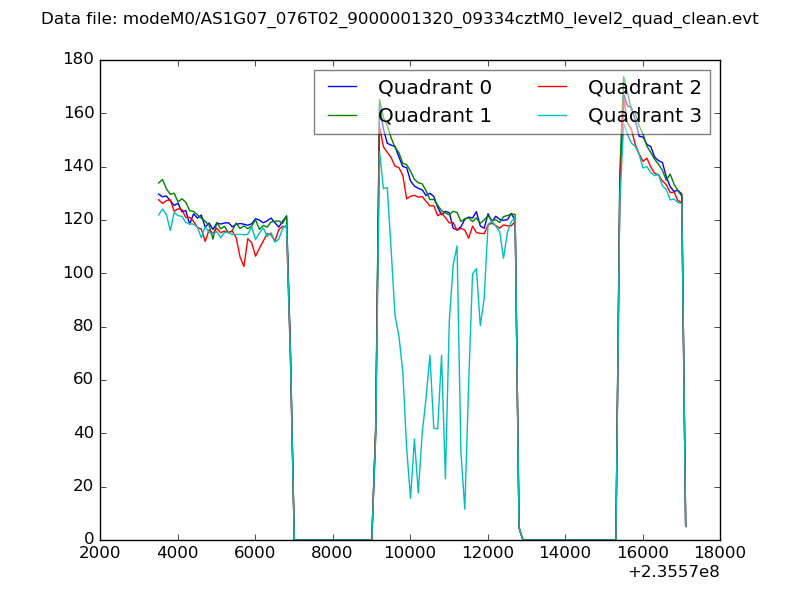 |
|
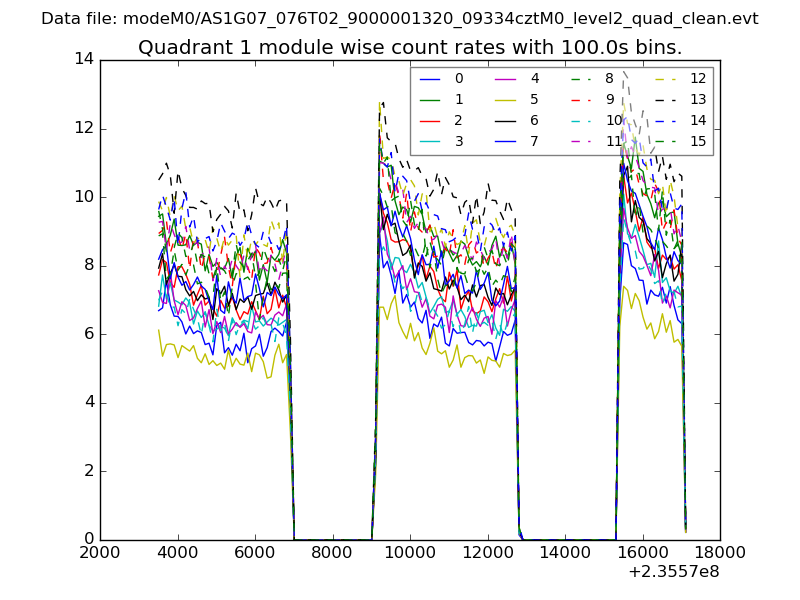
| Module-wise count rates for Quadrant A Data is divided into 100 sec bins |
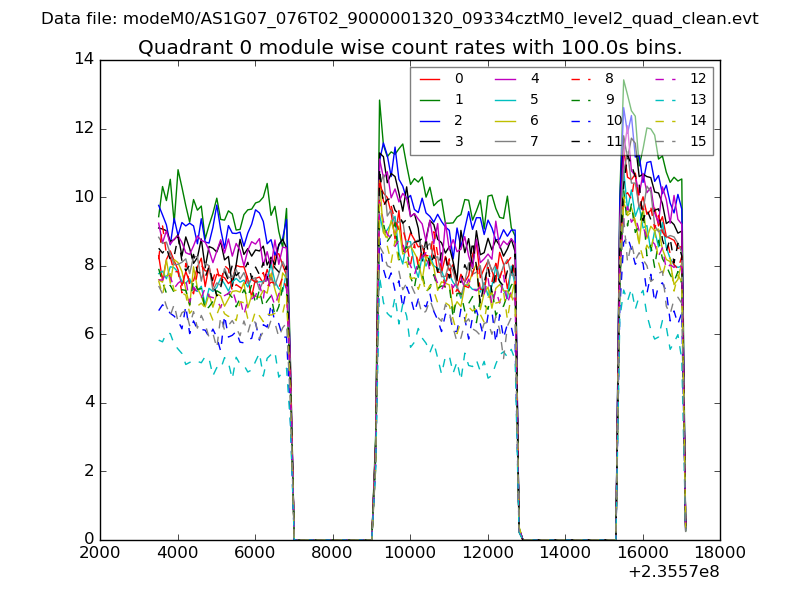 |
 |
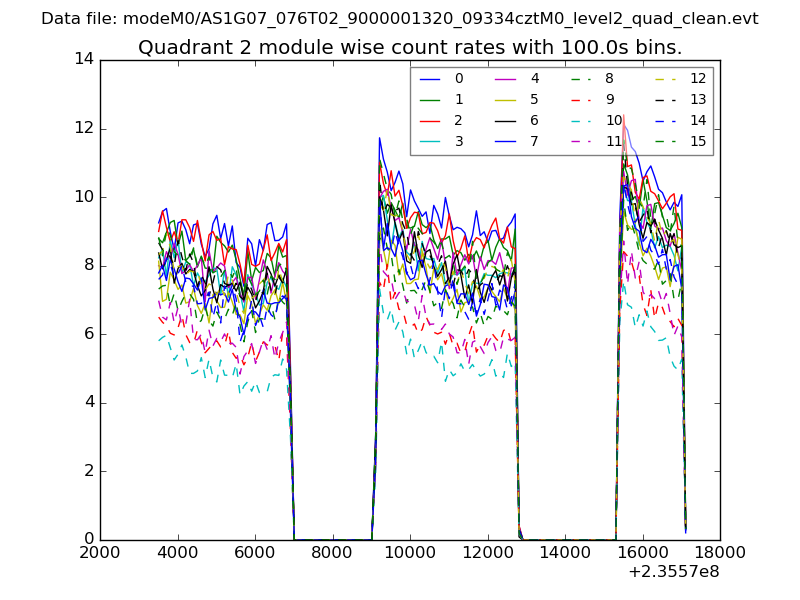
| Module-wise count rates for Quadrant B Data is divided into 100 sec bins |
 |
 |
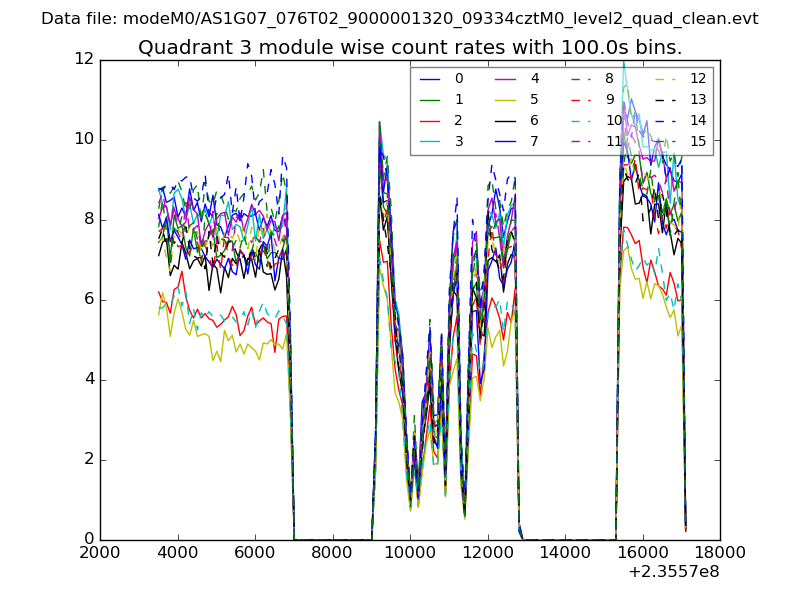
| Module-wise count rates for Quadrant C Data is divided into 100 sec bins |
 |
 |
| Module-wise count rates for Quadrant D Data is divided into 100 sec bins |
 |
 |
| Parameter | Plot |
|---|---|
| CZT HV Monitor | 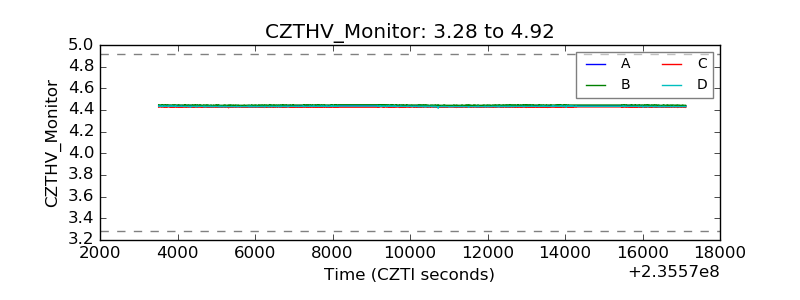 |
| D_VDD | 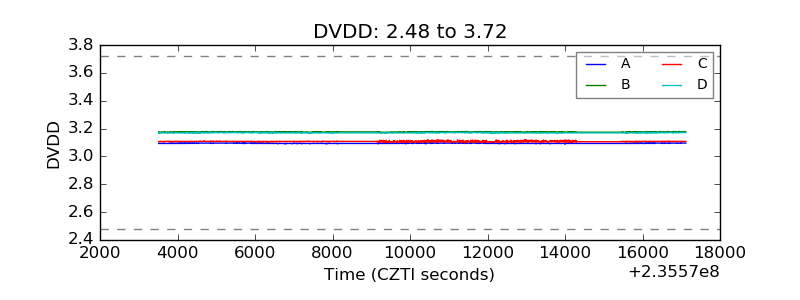 |
| Temperature 1 | 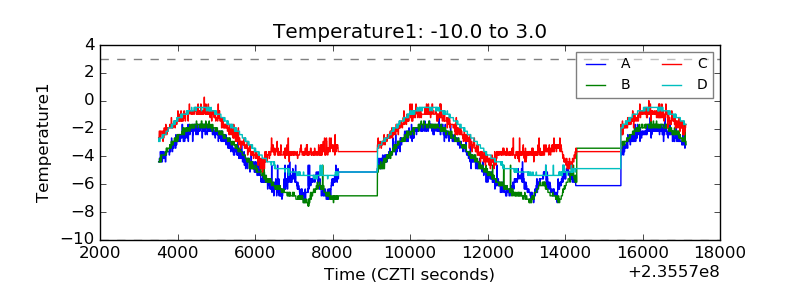 |
| Veto HV Monitor | 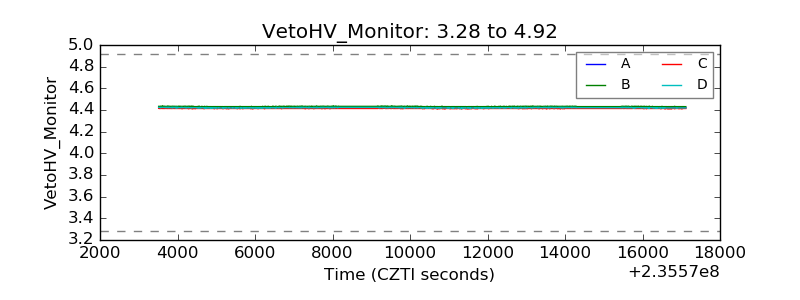 |
| Veto LLD | 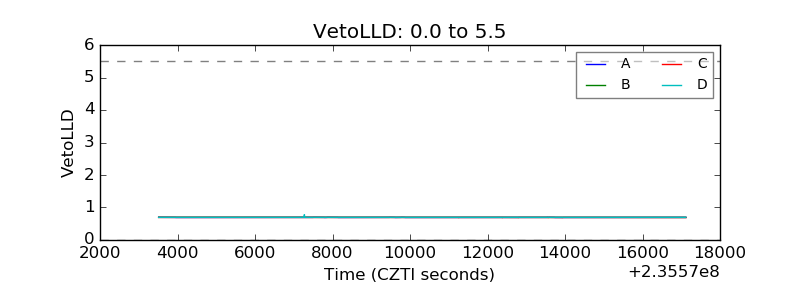 |
| Alpha Counter | 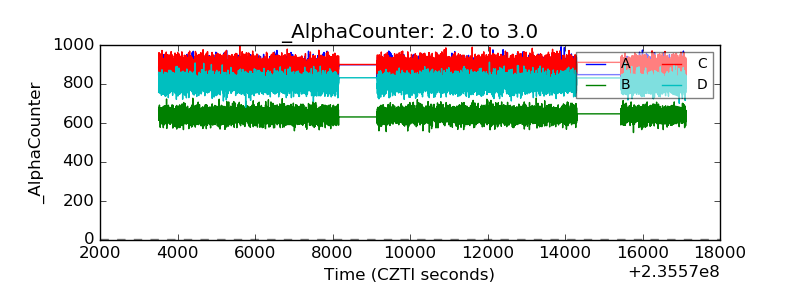 |
| _CPM_Rate | 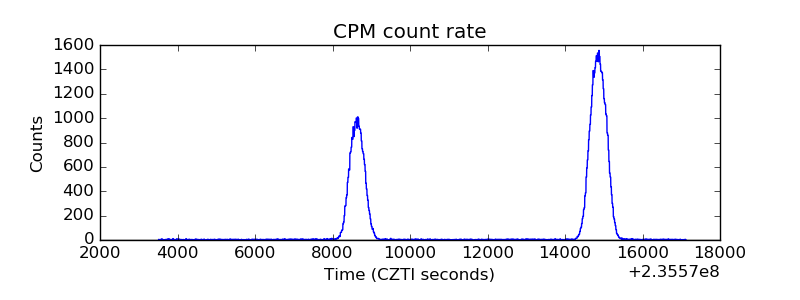 |
| CZT Counter | 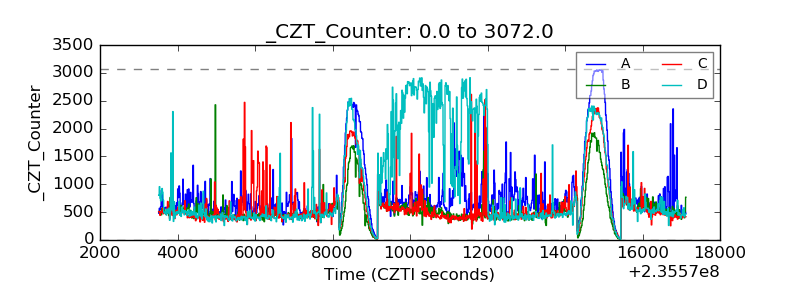 |
| +2.5 Volts monitor |  |
| +5 Volts monitor |  |
| _ROLL_ROT | 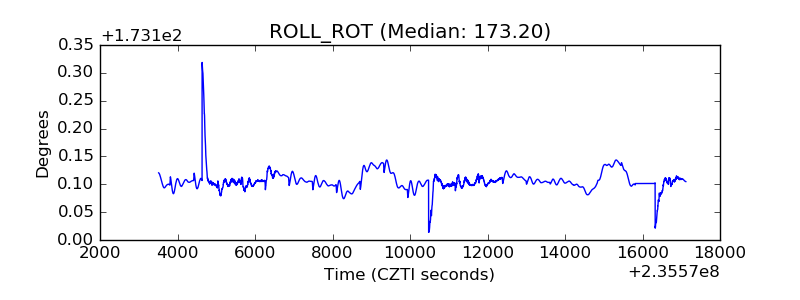 |
| _Roll_DEC | 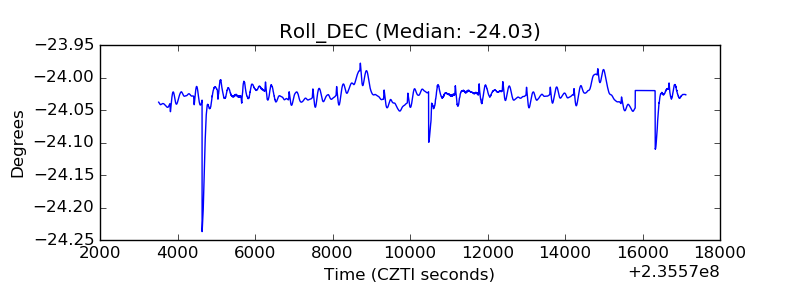 |
| _Roll_RA | 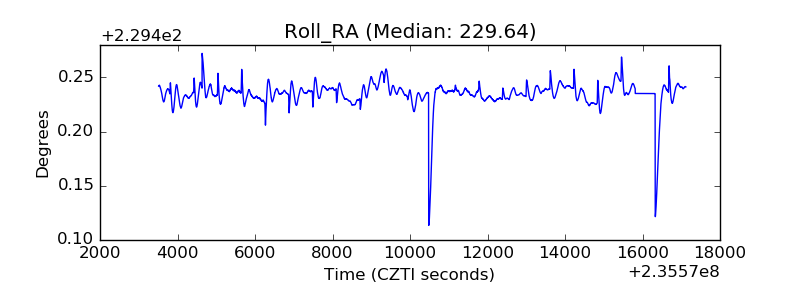 |
| Veto Counter | 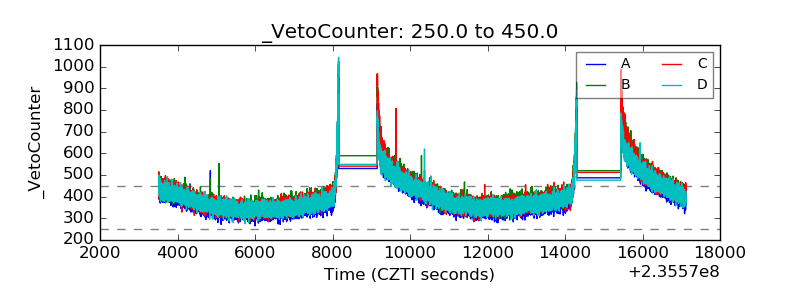 |