| Param | Original file | Final file |
|---|---|---|
| Filename | modeM0/AS1A03_069T02_9000001324cztM0_level2.fits | modeM0/AS1A03_069T02_9000001324cztM0_level2_quad_clean.evt |
| Size (bytes) | 77,443,200 | 54,892,800 |
| Size | 73.9 MB | 52.3 MB |
| Events in quadrant A | 459,900 | 280,320 |
| Events in quadrant B | 445,156 | 277,872 |
| Events in quadrant C | 466,456 | 273,181 |
| Events in quadrant D | 394,088 | 250,477 |
| Mode SS | |||
|---|---|---|---|
| Quadrant | BADHDUFLAG | Total packets | Discarded packets |
| A | 0 | 172 | 0 |
| B | 0 | 176 | 0 |
| C | 0 | 172 | 0 |
| D | 0 | 172 | 0 |
| Mode M0 | |||
|---|---|---|---|
| Quadrant | BADHDUFLAG | Total packets | Discarded packets |
| A | 0 | 19178 | 0 |
| B | 0 | 17758 | 0 |
| C | 0 | 17043 | 0 |
| D | 0 | 21405 | 0 |
| Mode M9 | |||
|---|---|---|---|
| Quadrant | BADHDUFLAG | Total packets | Discarded packets |
| A | 0 | 19 | 0 |
| B | 0 | 19 | 0 |
| C | 0 | 19 | 0 |
| D | 0 | 18 | 0 |
| Quadrant | Total seconds | Saturated seconds | Saturation percentage |
|---|---|---|---|
| A | 8317 | 148 | 1.779488% |
| B | 8327 | 121 | 1.453104% |
| C | 8353 | 87 | 1.041542% |
| D | 8343 | 348 | 4.171161% |
Noise dominated data is calculated using 1-second bins in cleaned event files. If a bin has >2000 counts, and if more than 50% of those come from <1% of pixels, then it is considered to be noise-dominated and hence unusable.
| Quadrant | # 1 sec bins | Bins with >0 counts | Bins with >2000 counts | High rate bins dominated by noise | Noise dominated (total time) | Noise dominated (detector-on time) | Marked lightcurve |
|---|---|---|---|---|---|---|---|
| A | 10791 | 8542 | 0 | 0 | 0.00% | 0.00% | 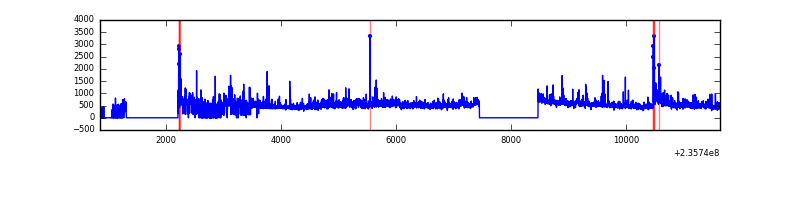 |
| B | 10791 | 8554 | 0 | 0 | 0.00% | 0.00% | 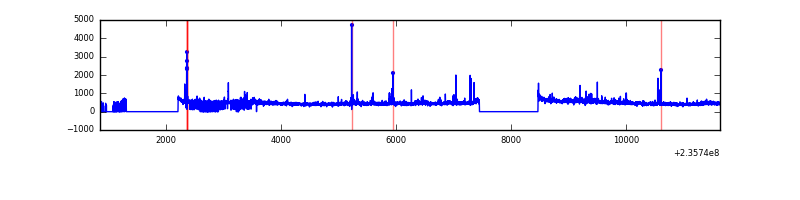 |
| C | 10787 | 8565 | 0 | 0 | 0.00% | 0.00% |  |
| D | 10780 | 8534 | 0 | 0 | 0.00% | 0.00% |  |
Top three noisy pixels from each quadrant. If the there are fewer than three noisy pixels in the level2.evt file, extra rows are filled as -1
| Pixel properties | Quadrant properties | ||||||
|---|---|---|---|---|---|---|---|
| Quadrant | DetID | PixID | Counts | Sigma | Mean | Median | Sigma |
| A | 0 | 29 | 462 | 10.92 | 119 | 112 | 32.1 |
| A | 7 | 110 | 377 | 8.27 | 119 | 112 | 32.1 |
| A | 12 | 254 | 343 | 7.21 | 119 | 112 | 32.1 |
| B | 2 | 9 | 390 | 10.94 | 117 | 112 | 25.4 |
| B | 5 | 128 | 314 | 7.95 | 117 | 112 | 25.4 |
| B | 3 | 17 | 310 | 7.79 | 117 | 112 | 25.4 |
| C | 1 | 80 | 372 | 7.65 | 123 | 114 | 33.7 |
| C | 1 | 81 | 368 | 7.53 | 123 | 114 | 33.7 |
| C | 3 | 126 | 329 | 6.38 | 123 | 114 | 33.7 |
| D | 1 | 3 | 291 | 6.02 | 112 | 102 | 31.4 |
| D | 7 | 3 | 284 | 5.8 | 112 | 102 | 31.4 |
| D | 6 | 38 | 282 | 5.73 | 112 | 102 | 31.4 |
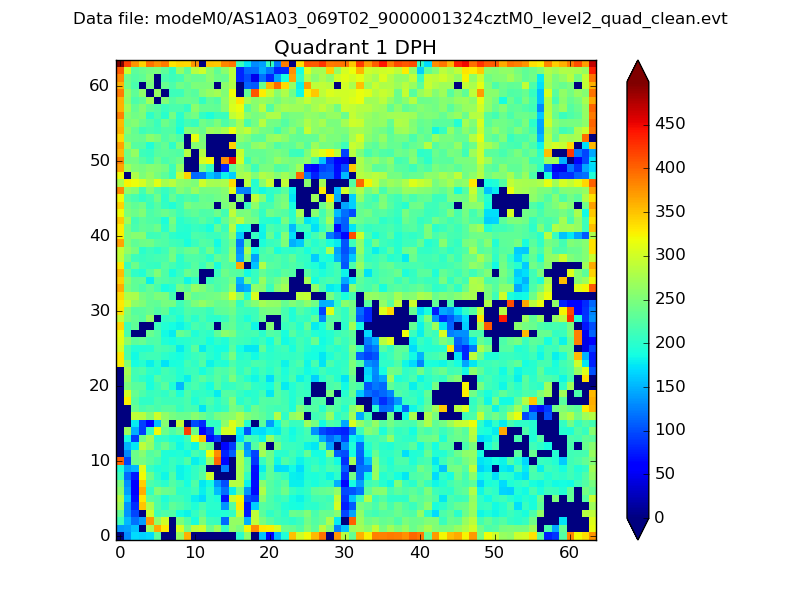
Histogram calculated using DETX and DETY for each event in the final _common_clean file
| Quadrant A |  |
 |
Quadrant B |
|---|---|---|---|
| Quadrant D | 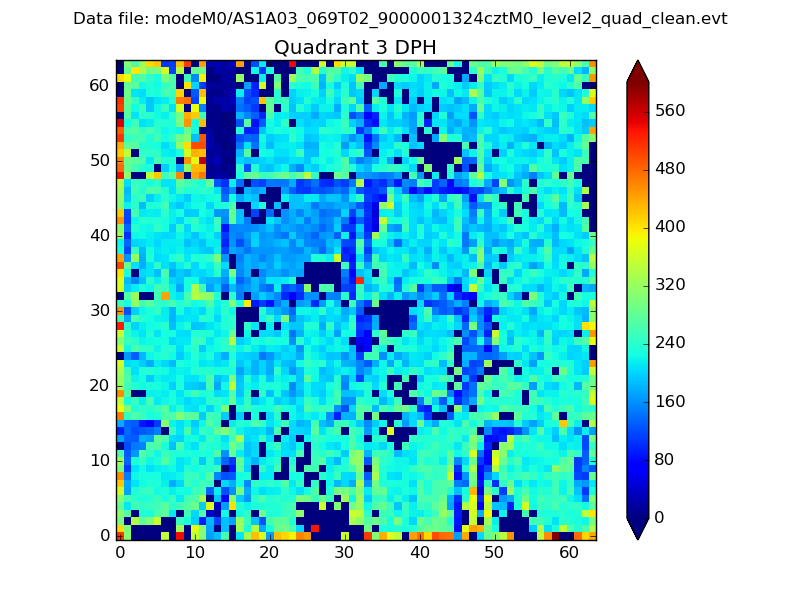 |
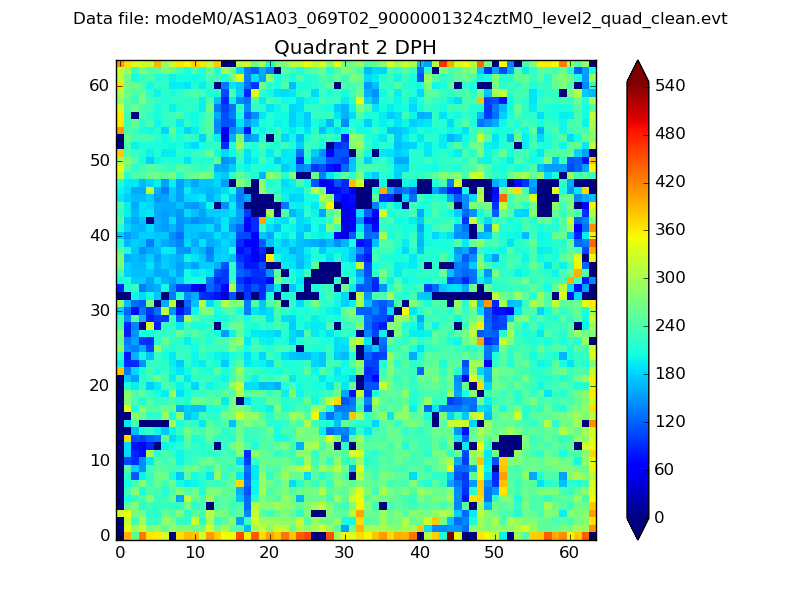 |
Quadrant C |
| Plot type | Count rate plots | Images |
|---|---|---|
| Comparison with Poisson distribution Blue bars denote a histogram of data divided into 1 sec bins. Red curve is a Poisson curve with rate = median count rate of data. |
 |
 |
| Quadrant-wise count rates Data is divided into 100 sec bins |
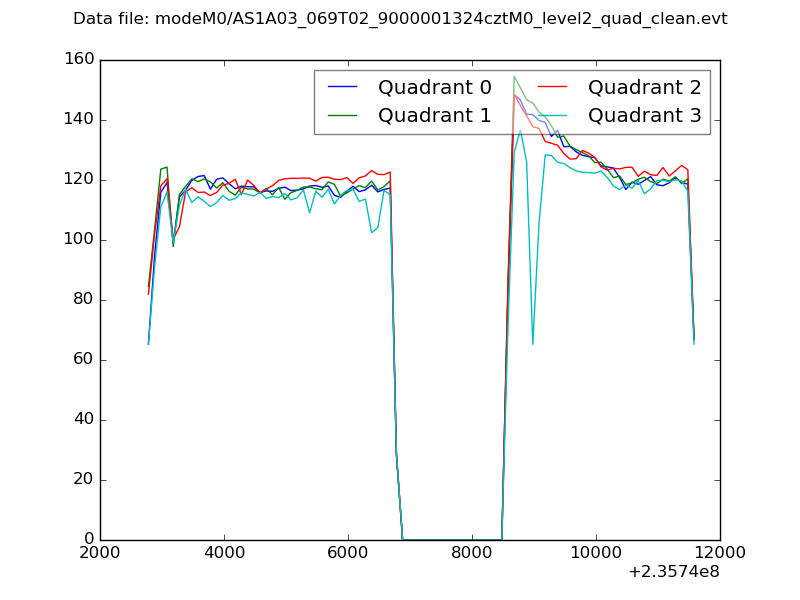 |
|
| Module-wise count rates for Quadrant A Data is divided into 100 sec bins |
 |
 |
| Module-wise count rates for Quadrant B Data is divided into 100 sec bins |
 |
 |
| Module-wise count rates for Quadrant C Data is divided into 100 sec bins |
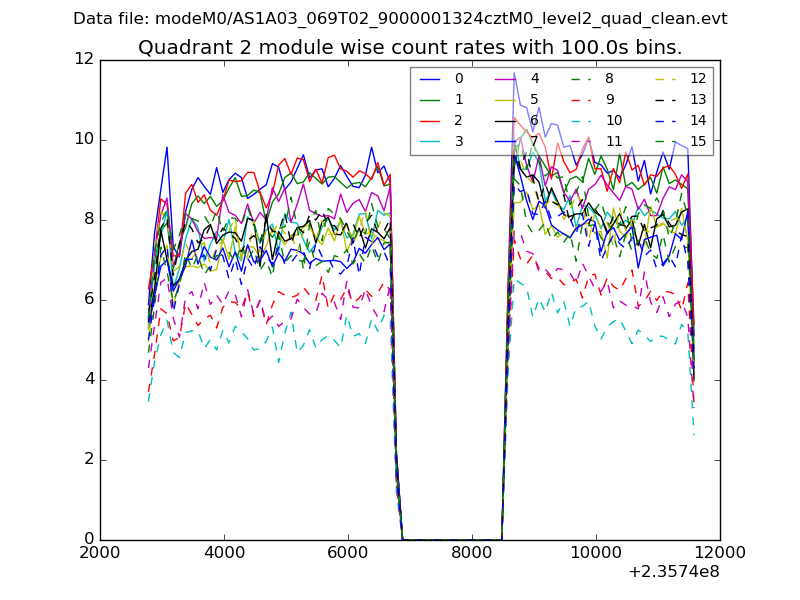 |
 |
| Module-wise count rates for Quadrant D Data is divided into 100 sec bins |
 |
 |
| Parameter | Plot |
|---|---|
| CZT HV Monitor | 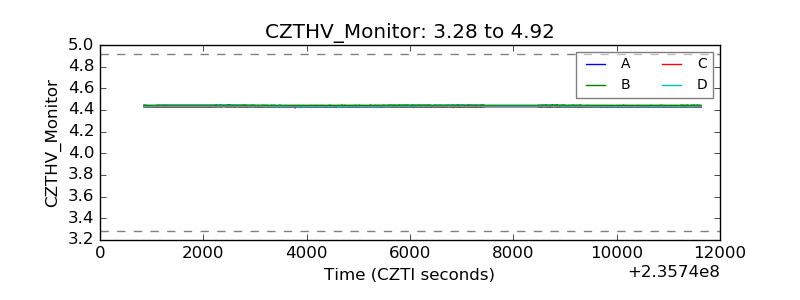 |
| D_VDD | 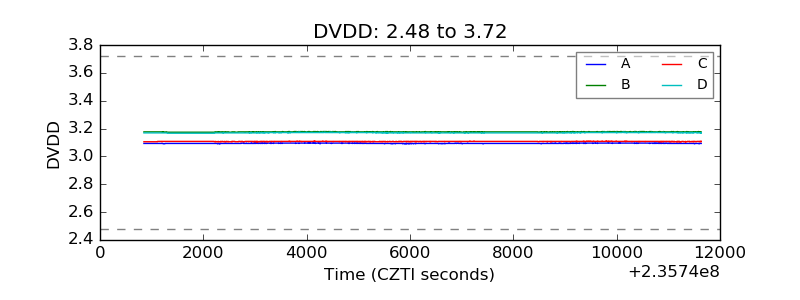 |
| Temperature 1 | 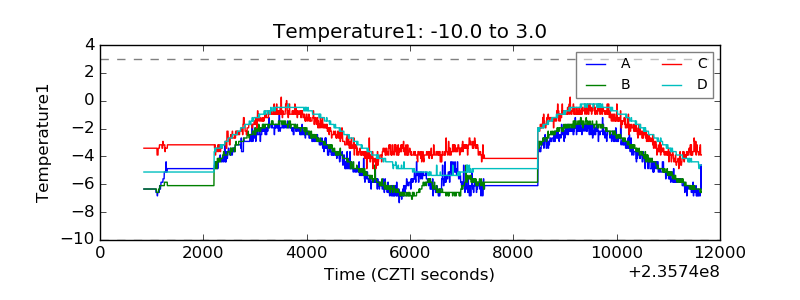 |
| Veto HV Monitor |  |
| Veto LLD |  |
| Alpha Counter |  |
| _CPM_Rate | 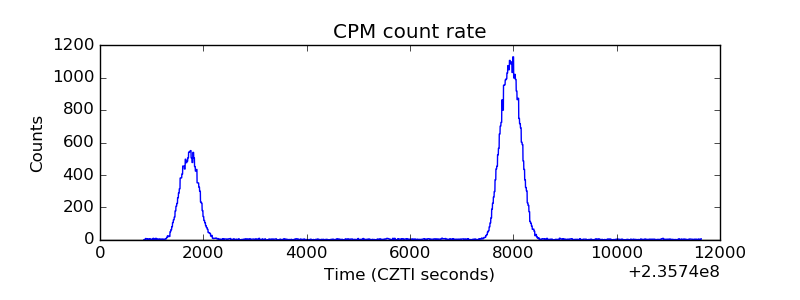 |
| CZT Counter | 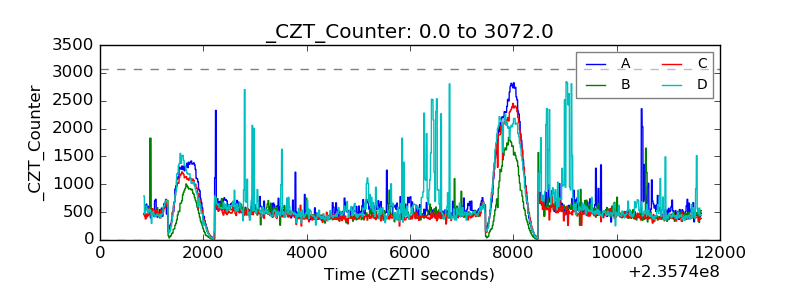 |
| +2.5 Volts monitor |  |
| +5 Volts monitor | 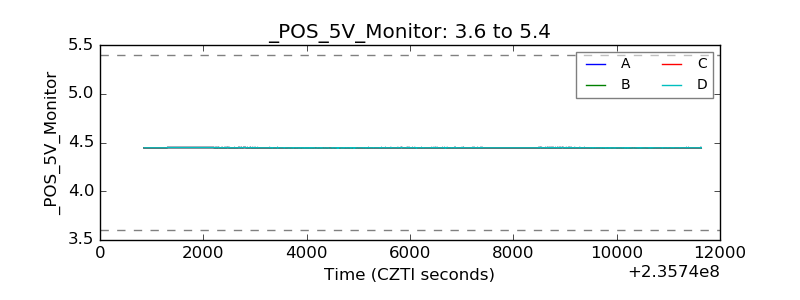 |
| _ROLL_ROT |  |
| _Roll_DEC |  |
| _Roll_RA | 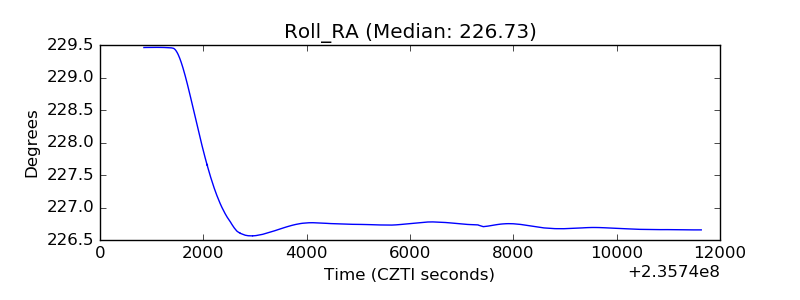 |
| Veto Counter |  |