| Param | Original file | Final file |
|---|---|---|
| Filename | modeM0/AS1A03_069T02_9000001324_09359cztM0_level2.evt | modeM0/AS1A03_069T02_9000001324_09359cztM0_level2_quad_clean.evt |
| Size (bytes) | 103,495,680 | 15,540,480 |
| Size | 98.7 MB | 14.8 MB |
| Events in quadrant A | 813,215 | 91,220 |
| Events in quadrant B | 750,610 | 95,379 |
| Events in quadrant C | 674,205 | 92,536 |
| Events in quadrant D | 800,622 | 89,272 |
| Mode SS | |||
|---|---|---|---|
| Quadrant | BADHDUFLAG | Total packets | Discarded packets |
| A | 0 | 40 | 10 |
| B | 0 | 40 | 6 |
| C | 0 | 40 | 10 |
| D | 0 | 40 | 10 |
| Mode M0 | |||
|---|---|---|---|
| Quadrant | BADHDUFLAG | Total packets | Discarded packets |
| A | 0 | 4587 | 1301 |
| B | 0 | 4181 | 1172 |
| C | 0 | 3876 | 1046 |
| D | 0 | 4594 | 1300 |
| Mode M9 | |||
|---|---|---|---|
| Quadrant | BADHDUFLAG | Total packets | Discarded packets |
| A | 0 | 9 | 0 |
| B | 0 | 9 | 0 |
| C | 0 | 9 | 0 |
| D | 0 | 9 | 1 |
| Quadrant | Total seconds | Saturated seconds | Saturation percentage |
|---|---|---|---|
| A | 1335 | 71 | 5.318352% |
| B | 1345 | 55 | 4.089219% |
| C | 1371 | 33 | 2.407002% |
| D | 1361 | 56 | 4.114622% |
Noise dominated data is calculated using 1-second bins in cleaned event files. If a bin has >2000 counts, and if more than 50% of those come from <1% of pixels, then it is considered to be noise-dominated and hence unusable.
| Quadrant | # 1 sec bins | Bins with >0 counts | Bins with >2000 counts | High rate bins dominated by noise | Noise dominated (total time) | Noise dominated (detector-on time) | Marked lightcurve |
|---|---|---|---|---|---|---|---|
| A | 2789 | 1561 | 4 | 4 | 0.14% | 0.26% | 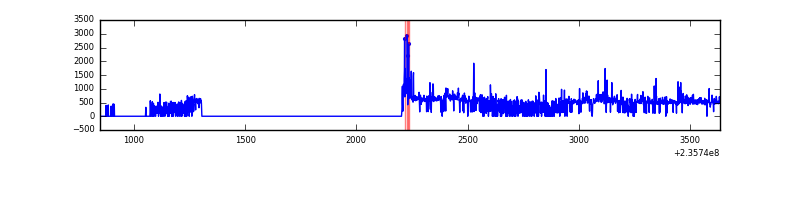 |
| B | 2789 | 1573 | 4 | 4 | 0.14% | 0.25% | 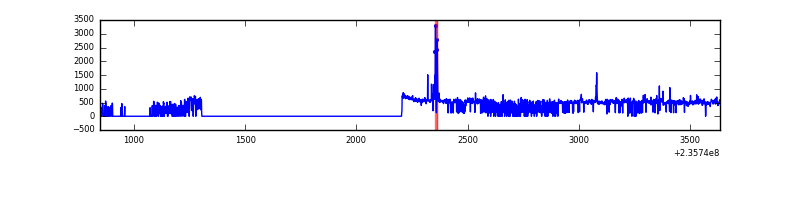 |
| C | 2785 | 1584 | 0 | 0 | 0.00% | 0.00% | 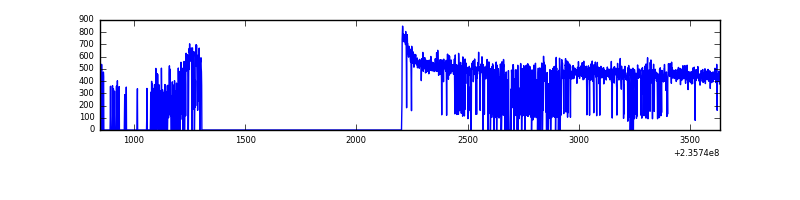 |
| D | 2778 | 1556 | 8 | 8 | 0.29% | 0.51% | 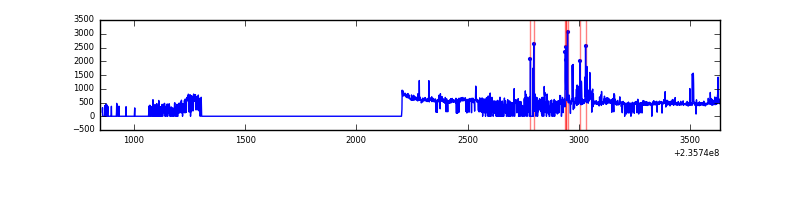 |
Top three noisy pixels from each quadrant. If the there are fewer than three noisy pixels in the level2.evt file, extra rows are filled as -1
| Pixel properties | Quadrant properties | ||||||
|---|---|---|---|---|---|---|---|
| Quadrant | DetID | PixID | Counts | Sigma | Mean | Median | Sigma |
| A | 8 | 5 | 126871 | 3336.58 | 175 | 170 | 38.0 |
| A | 13 | 251 | 3951 | 99.57 | 175 | 170 | 38.0 |
| A | 1 | 162 | 3470 | 86.9 | 175 | 170 | 38.0 |
| B | 0 | 214 | 33566 | 916.46 | 175 | 170 | 36.4 |
| B | 0 | 219 | 9174 | 247.09 | 175 | 170 | 36.4 |
| B | 0 | 230 | 6538 | 174.75 | 175 | 170 | 36.4 |
| C | 13 | 61 | 1298 | 27.4 | 172 | 172 | 41.1 |
| C | 8 | 222 | 818 | 15.72 | 172 | 172 | 41.1 |
| C | 14 | 67 | 652 | 11.68 | 172 | 172 | 41.1 |
| D | 1 | 52 | 58151 | 1260.44 | 172 | 166 | 46.0 |
| D | 12 | 227 | 38678 | 837.15 | 172 | 166 | 46.0 |
| D | 13 | 104 | 23057 | 497.59 | 172 | 166 | 46.0 |
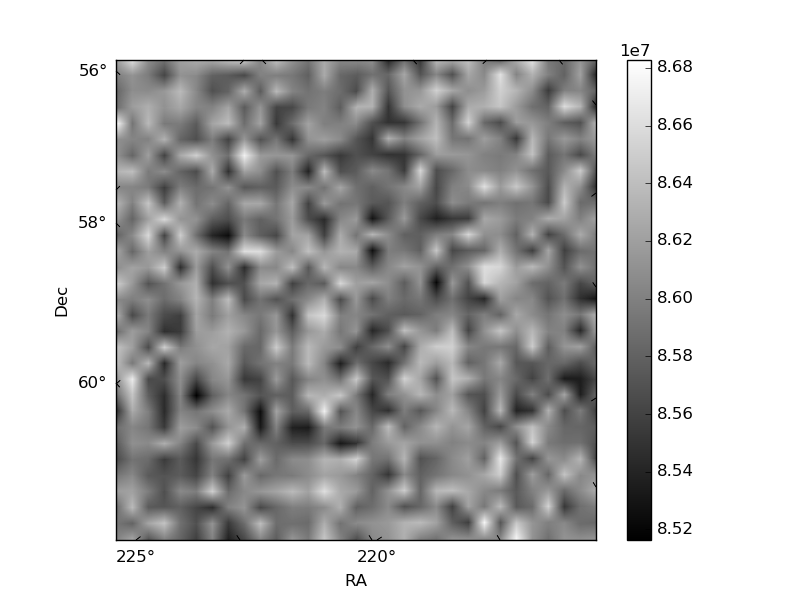
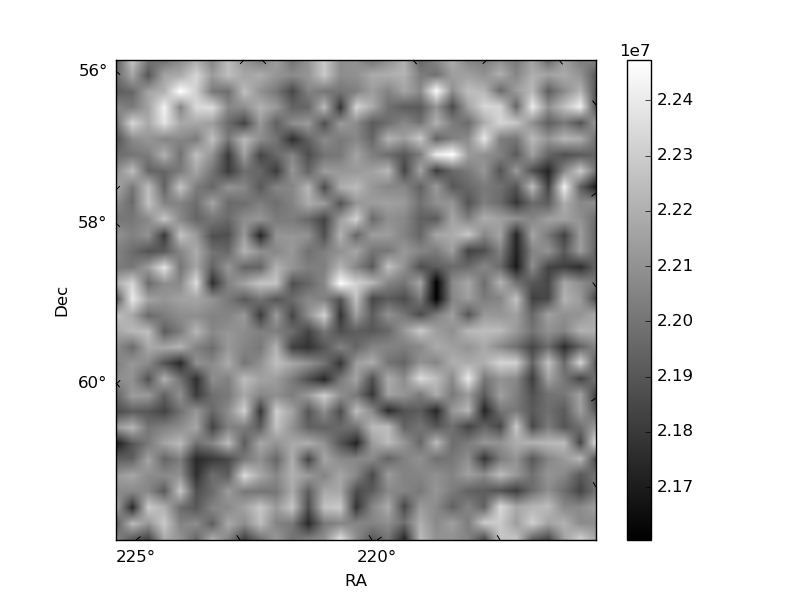
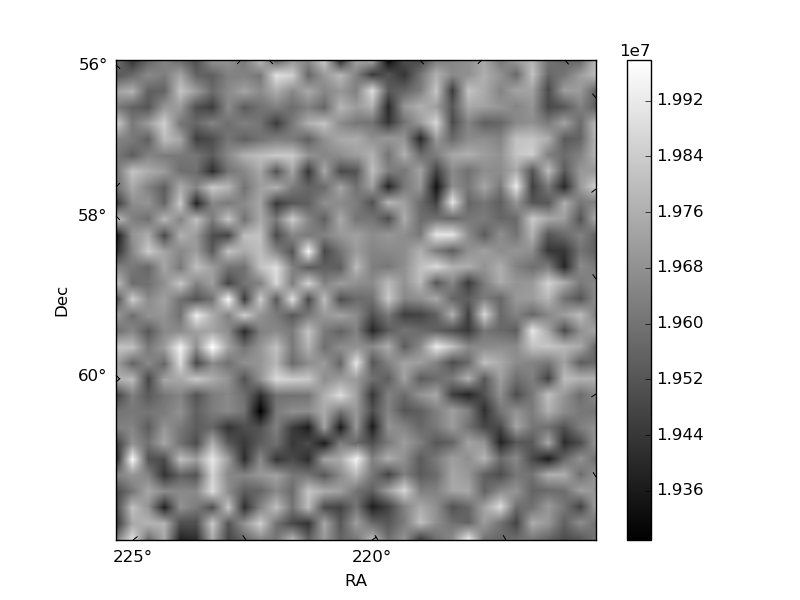
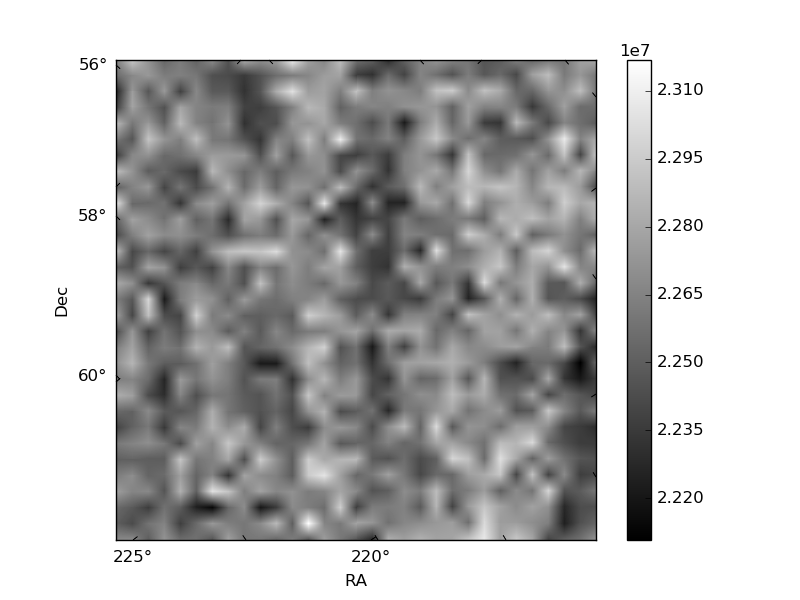
Histogram calculated using DETX and DETY for each event in the final _common_clean file
| Quadrant A |  |
 |
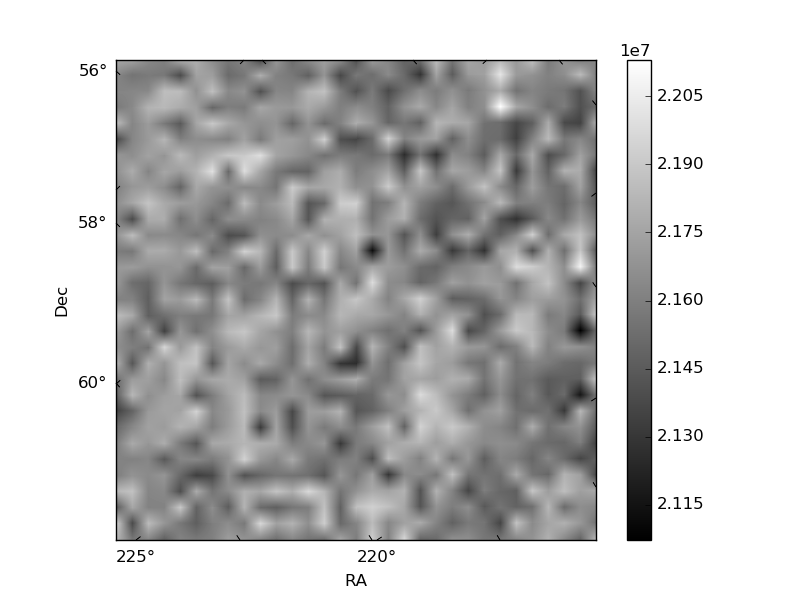
Quadrant B |
|---|---|---|---|
| Quadrant D |  |
 |
Quadrant C |
| Plot type | Count rate plots | Images |
|---|---|---|
| Comparison with Poisson distribution Blue bars denote a histogram of data divided into 1 sec bins. Red curve is a Poisson curve with rate = median count rate of data. |
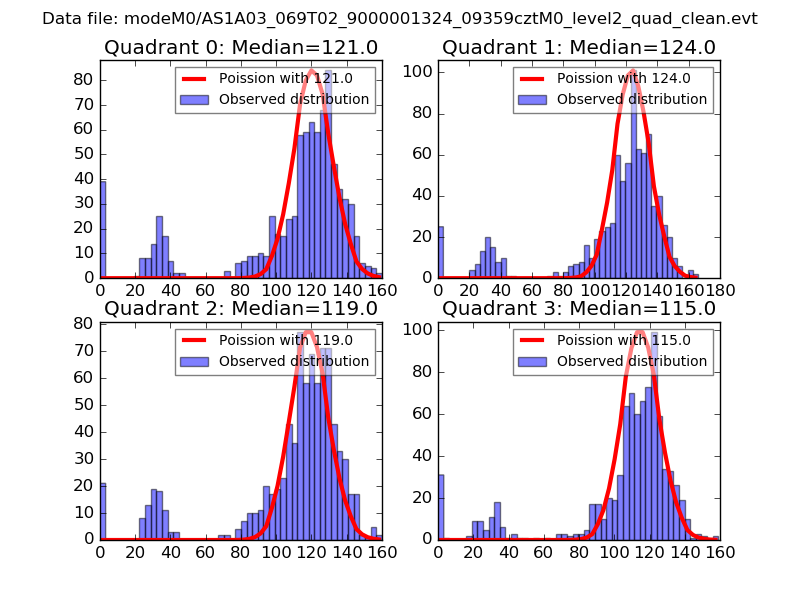 |
 |
| Quadrant-wise count rates Data is divided into 100 sec bins |
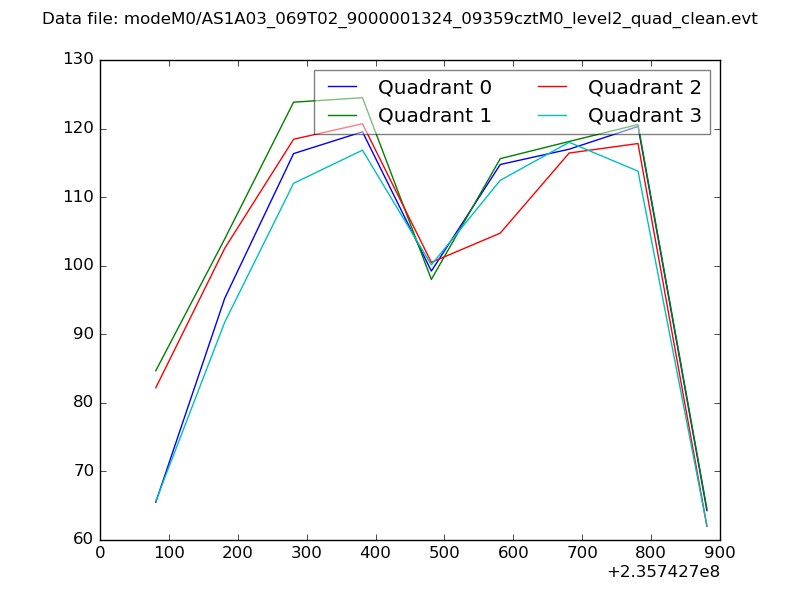 |
|
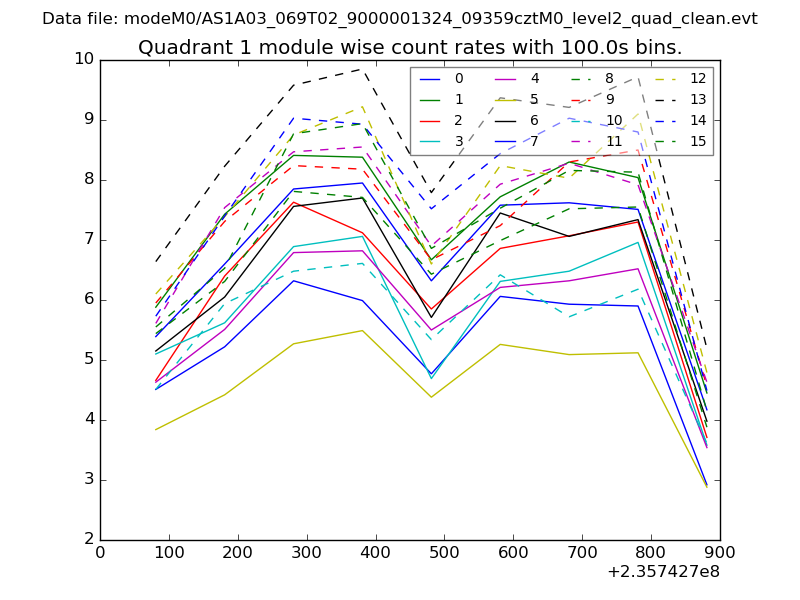
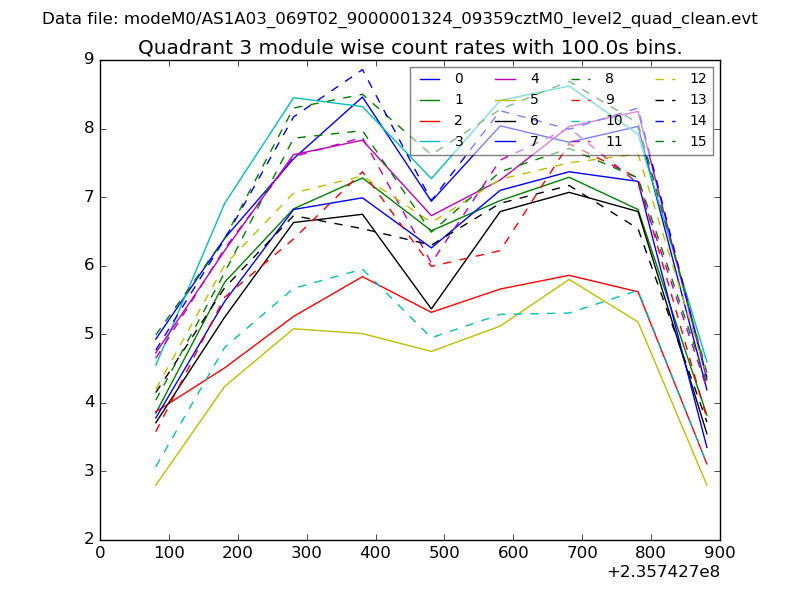
| Module-wise count rates for Quadrant A Data is divided into 100 sec bins |
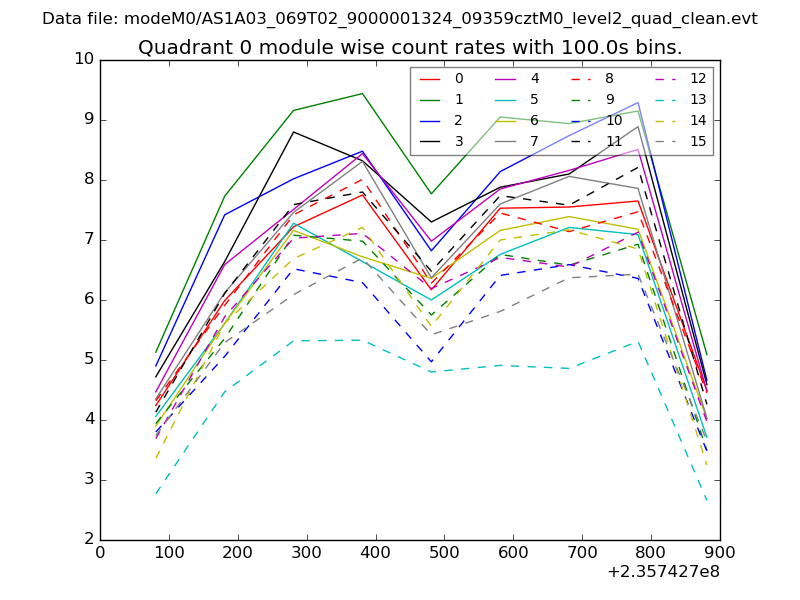 |
 |
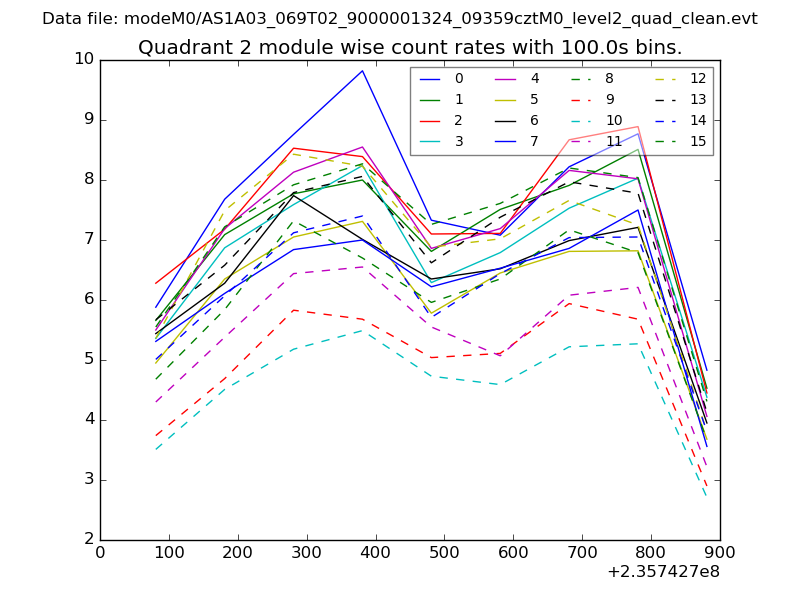
| Module-wise count rates for Quadrant B Data is divided into 100 sec bins |
 |
 |
| Module-wise count rates for Quadrant C Data is divided into 100 sec bins |
 |
 |
| Module-wise count rates for Quadrant D Data is divided into 100 sec bins |
 |
 |
| Parameter | Plot |
|---|---|
| CZT HV Monitor | 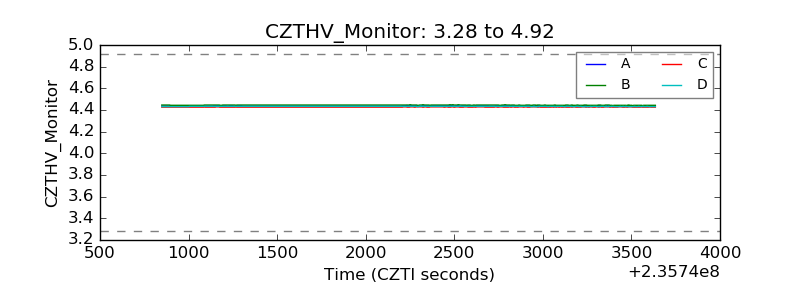 |
| D_VDD | 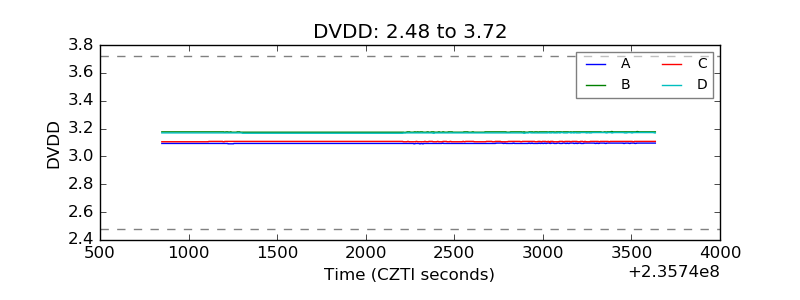 |
| Temperature 1 | 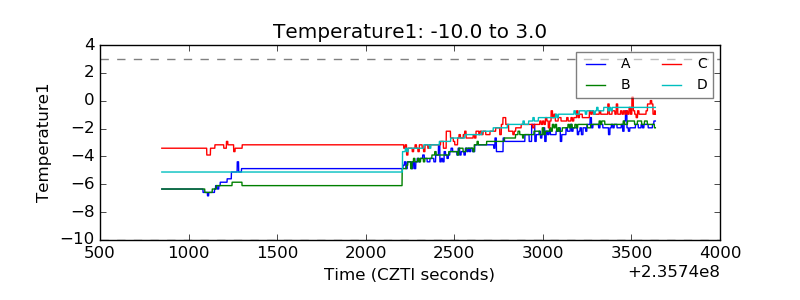 |
| Veto HV Monitor | 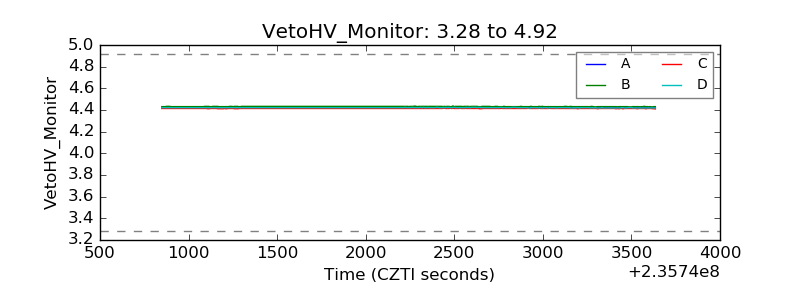 |
| Veto LLD | 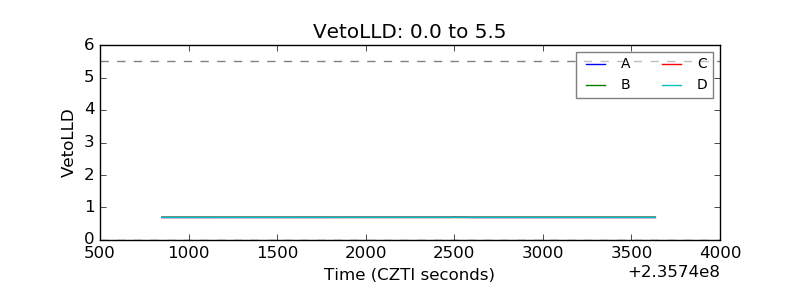 |
| Alpha Counter | 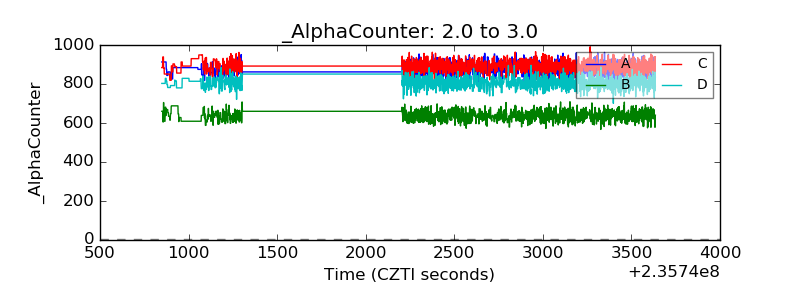 |
| _CPM_Rate | 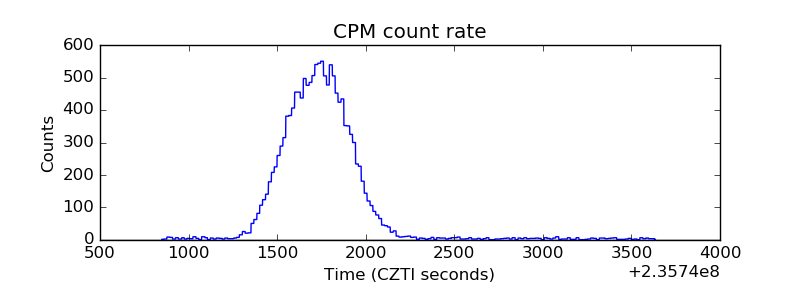 |
| CZT Counter | 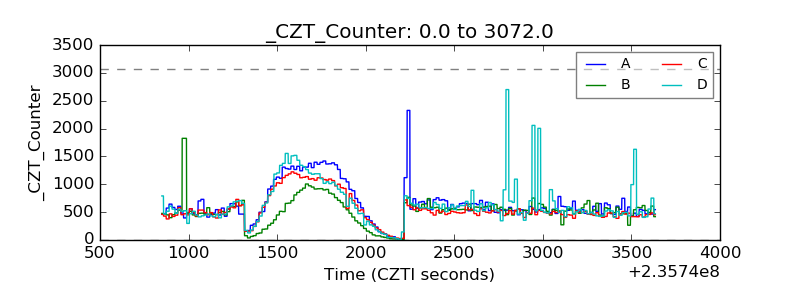 |
| +2.5 Volts monitor |  |
| +5 Volts monitor | 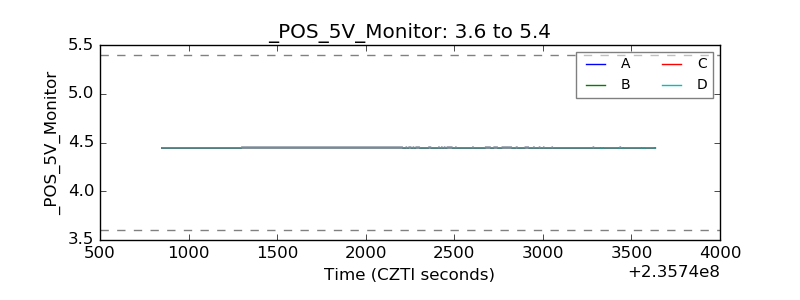 |
| _ROLL_ROT | 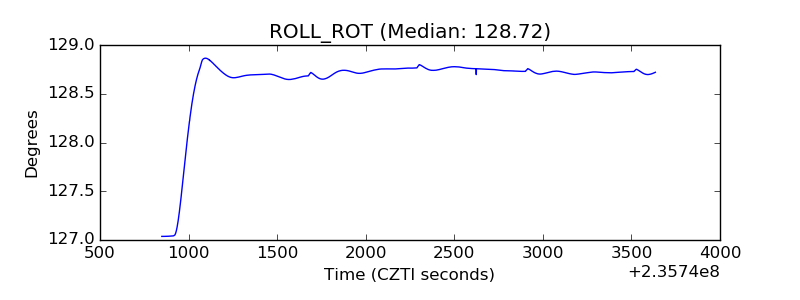 |
| _Roll_DEC | 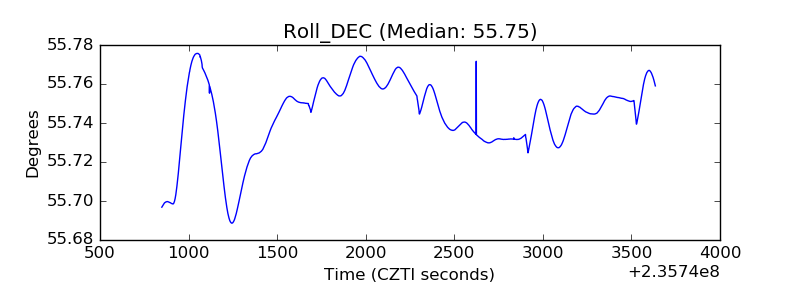 |
| _Roll_RA | 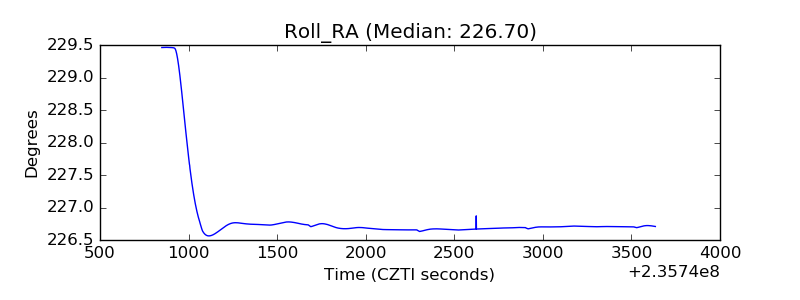 |
| Veto Counter | 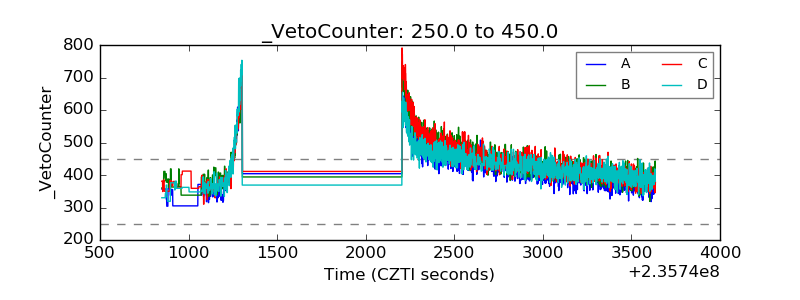 |