| Param | Original file | Final file |
|---|---|---|
| Filename | modeM0/AS1A03_069T02_9000001324_09362cztM0_level2.evt | modeM0/AS1A03_069T02_9000001324_09362cztM0_level2_quad_clean.evt |
| Size (bytes) | 528,287,040 | 122,276,160 |
| Size | 503.8 MB | 116.6 MB |
| Events in quadrant A | 4,017,829 | 805,495 |
| Events in quadrant B | 3,536,425 | 808,782 |
| Events in quadrant C | 3,260,003 | 811,533 |
| Events in quadrant D | 4,684,596 | 764,545 |
| Mode SS | |||
|---|---|---|---|
| Quadrant | BADHDUFLAG | Total packets | Discarded packets |
| A | 0 | 150 | 0 |
| B | 0 | 150 | 0 |
| C | 0 | 150 | 0 |
| D | 0 | 150 | 0 |
| Mode M0 | |||
|---|---|---|---|
| Quadrant | BADHDUFLAG | Total packets | Discarded packets |
| A | 0 | 16762 | 1 |
| B | 0 | 15584 | 1 |
| C | 0 | 14990 | 1 |
| D | 0 | 18928 | 1 |
| Mode M9 | |||
|---|---|---|---|
| Quadrant | BADHDUFLAG | Total packets | Discarded packets |
| A | 0 | 10 | 0 |
| B | 0 | 10 | 0 |
| C | 0 | 10 | 0 |
| D | 0 | 10 | 0 |
| Quadrant | Total seconds | Saturated seconds | Saturation percentage |
|---|---|---|---|
| A | 7370 | 79 | 1.071913% |
| B | 7370 | 67 | 0.909091% |
| C | 7370 | 54 | 0.732700% |
| D | 7370 | 293 | 3.975577% |
Noise dominated data is calculated using 1-second bins in cleaned event files. If a bin has >2000 counts, and if more than 50% of those come from <1% of pixels, then it is considered to be noise-dominated and hence unusable.
| Quadrant | # 1 sec bins | Bins with >0 counts | Bins with >2000 counts | High rate bins dominated by noise | Noise dominated (total time) | Noise dominated (detector-on time) | Marked lightcurve |
|---|---|---|---|---|---|---|---|
| A | 8390 | 7371 | 6 | 6 | 0.07% | 0.08% | 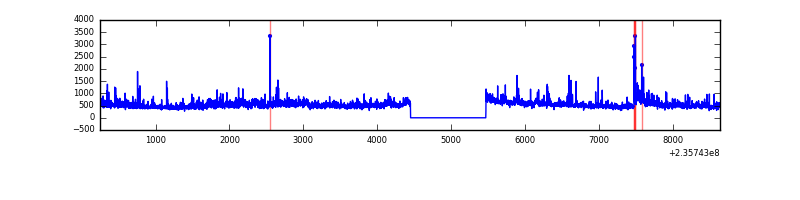 |
| B | 8390 | 7371 | 4 | 4 | 0.05% | 0.05% | 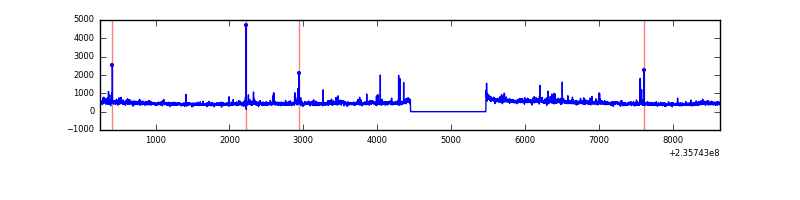 |
| C | 8390 | 7371 | 0 | 0 | 0.00% | 0.00% | 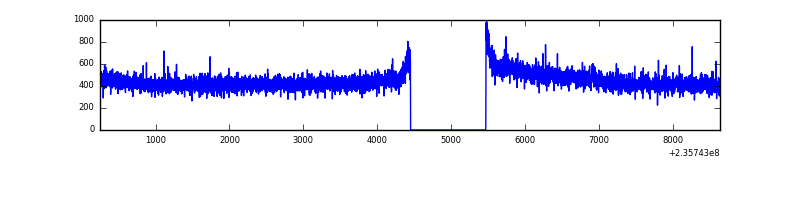 |
| D | 8390 | 7371 | 206 | 206 | 2.46% | 2.79% | 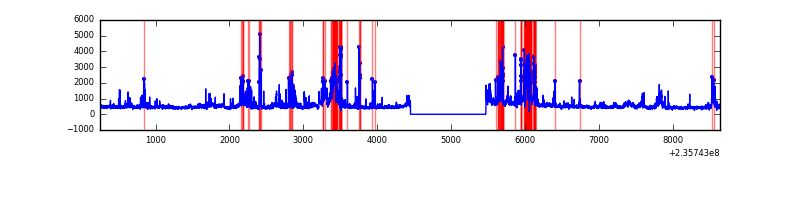 |
Top three noisy pixels from each quadrant. If the there are fewer than three noisy pixels in the level2.evt file, extra rows are filled as -1
| Pixel properties | Quadrant properties | ||||||
|---|---|---|---|---|---|---|---|
| Quadrant | DetID | PixID | Counts | Sigma | Mean | Median | Sigma |
| A | 8 | 5 | 642001 | 3699.15 | 839 | 821 | 173.3 |
| A | 13 | 251 | 73594 | 419.85 | 839 | 821 | 173.3 |
| A | 1 | 162 | 29066 | 162.95 | 839 | 821 | 173.3 |
| B | 0 | 214 | 67287 | 415.94 | 840 | 818 | 159.8 |
| B | 0 | 219 | 56713 | 349.77 | 840 | 818 | 159.8 |
| B | 5 | 255 | 55796 | 344.03 | 840 | 818 | 159.8 |
| C | 8 | 222 | 7408 | 34.46 | 831 | 834 | 190.8 |
| C | 13 | 61 | 6383 | 29.09 | 831 | 834 | 190.8 |
| C | 14 | 67 | 4013 | 16.67 | 831 | 834 | 190.8 |
| D | 1 | 52 | 583335 | 2698.25 | 806 | 789 | 215.9 |
| D | 12 | 227 | 264774 | 1222.73 | 806 | 789 | 215.9 |
| D | 1 | 255 | 205661 | 948.93 | 806 | 789 | 215.9 |
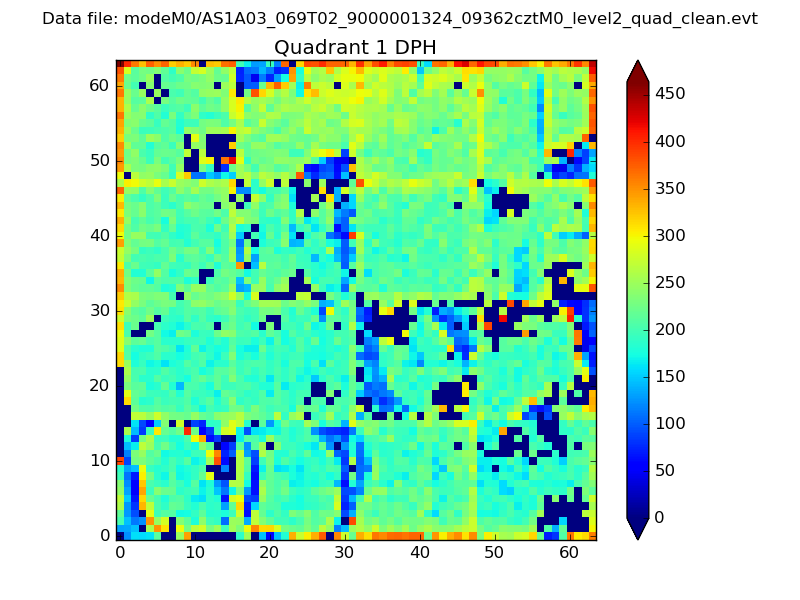
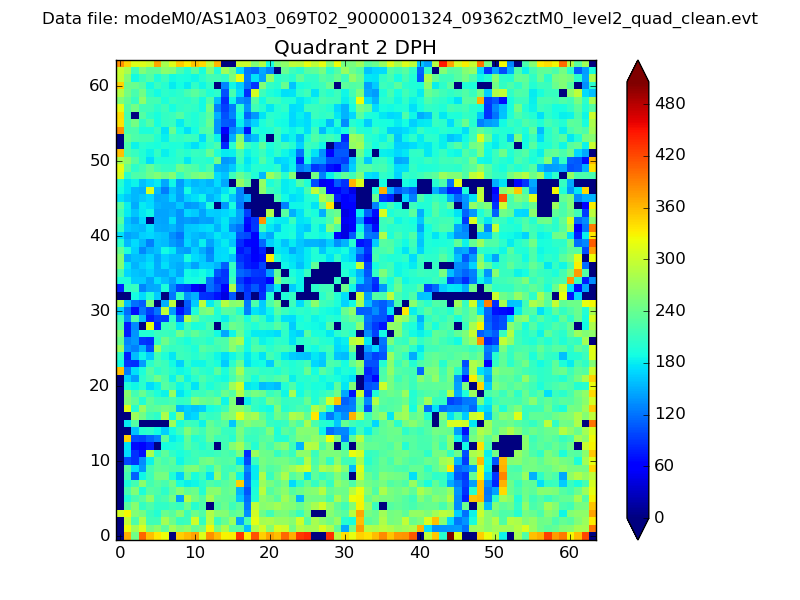
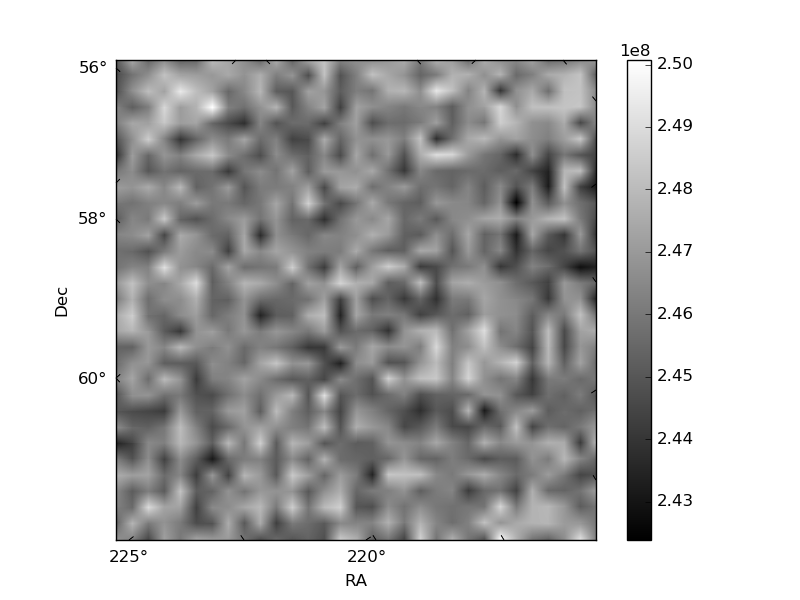
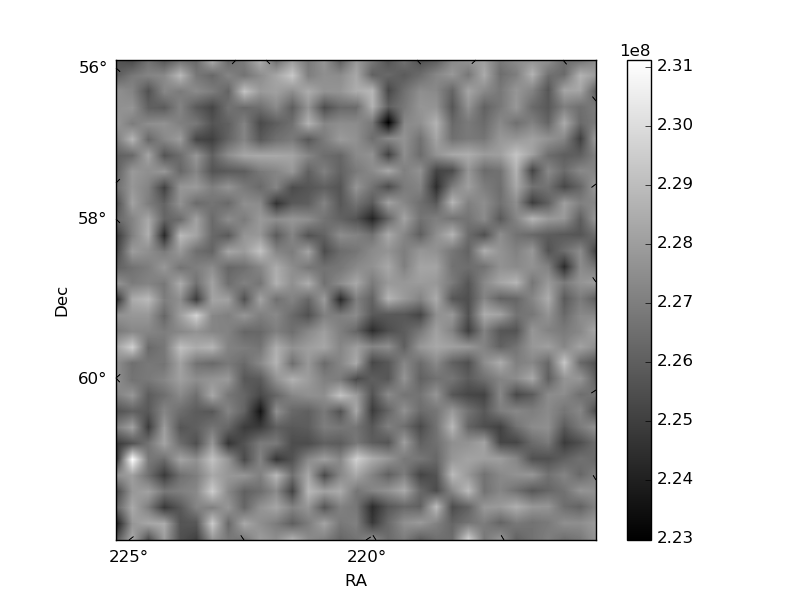
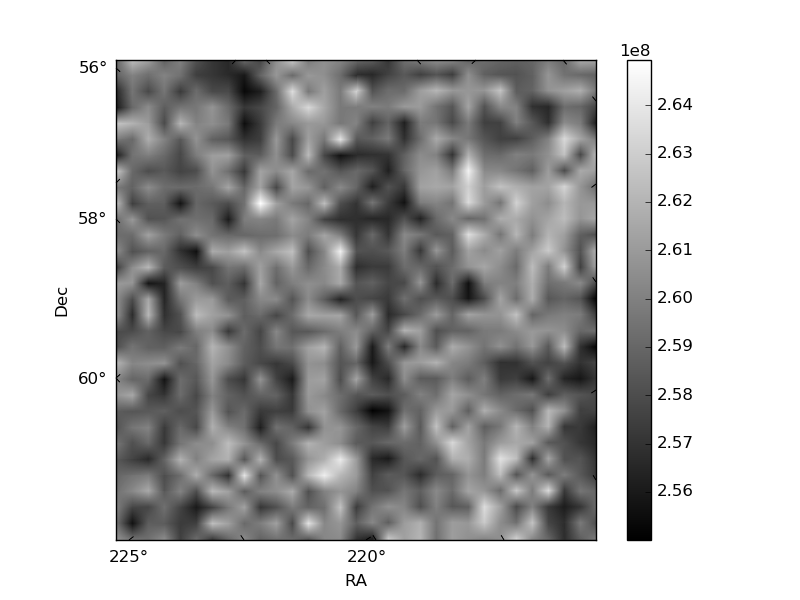
Histogram calculated using DETX and DETY for each event in the final _common_clean file
| Quadrant A |  |
 |
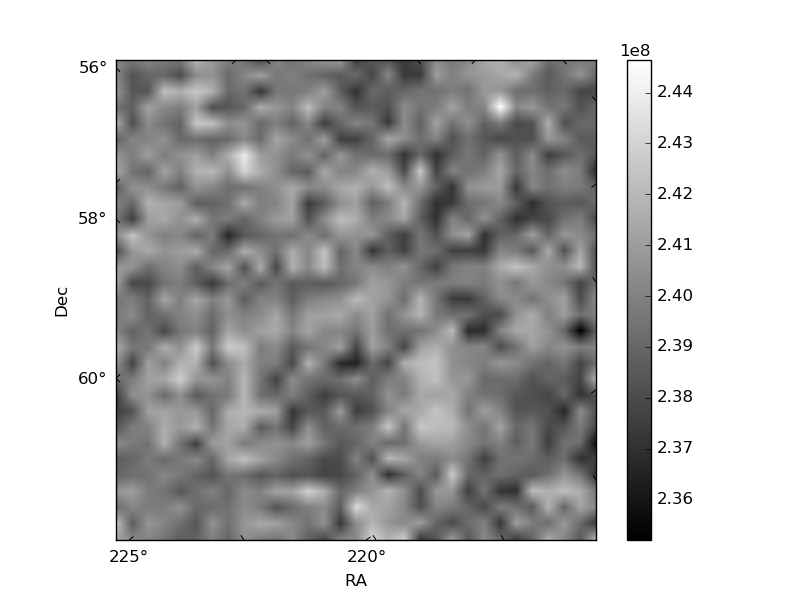
Quadrant B |
|---|---|---|---|
| Quadrant D |  |
 |
Quadrant C |
| Plot type | Count rate plots | Images |
|---|---|---|
| Comparison with Poisson distribution Blue bars denote a histogram of data divided into 1 sec bins. Red curve is a Poisson curve with rate = median count rate of data. |
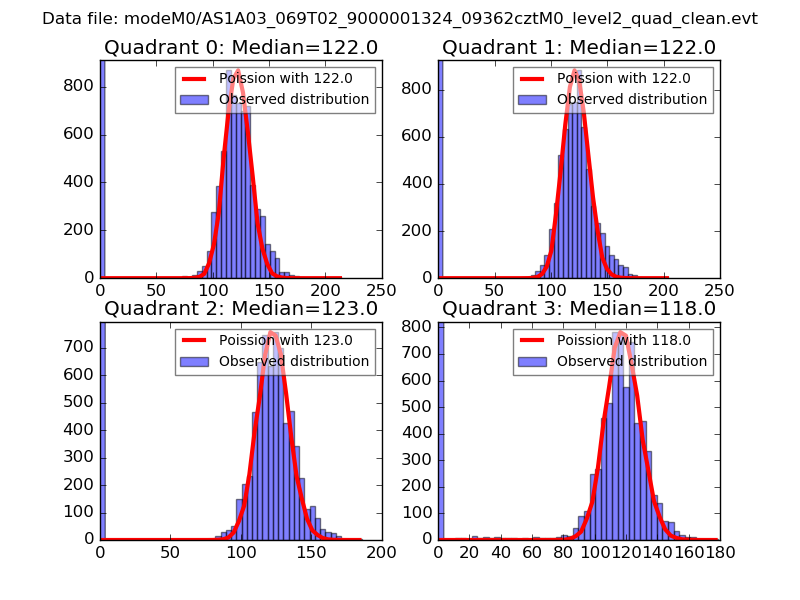 |
 |
| Quadrant-wise count rates Data is divided into 100 sec bins |
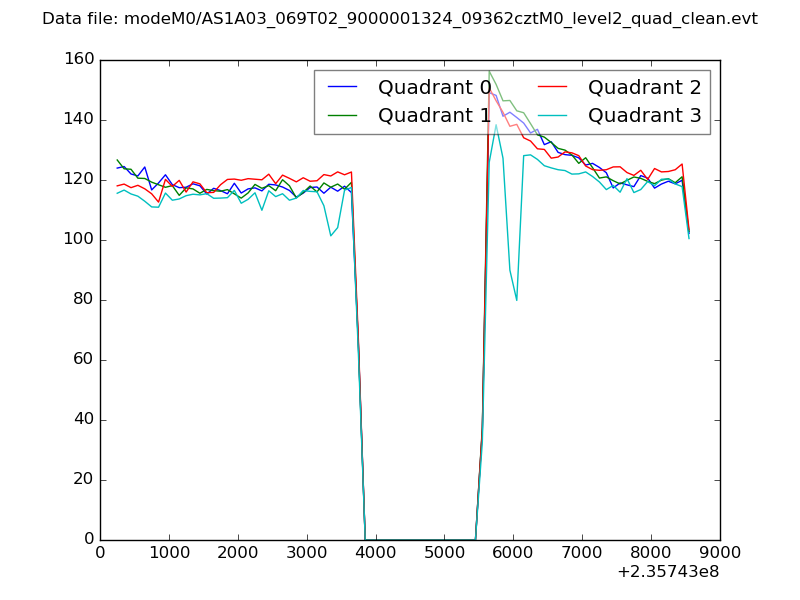 |
|
| Module-wise count rates for Quadrant A Data is divided into 100 sec bins |
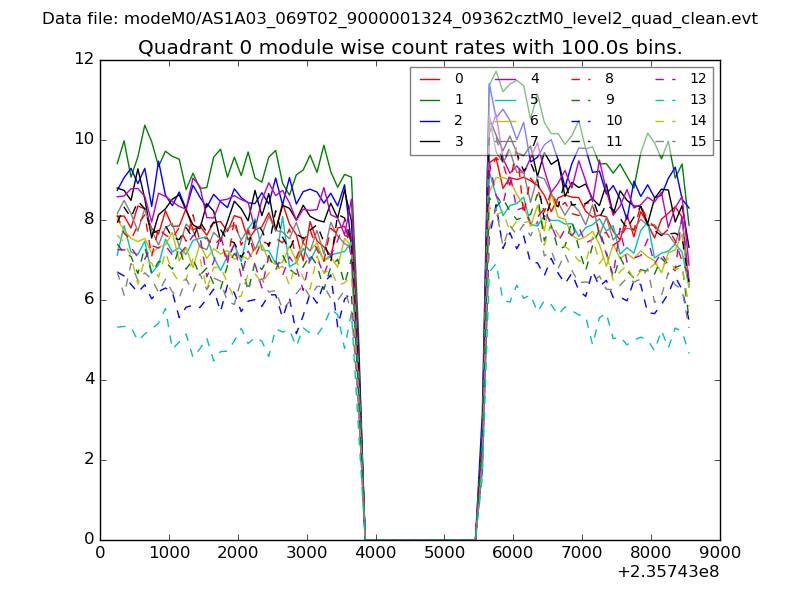 |
 |
| Module-wise count rates for Quadrant B Data is divided into 100 sec bins |
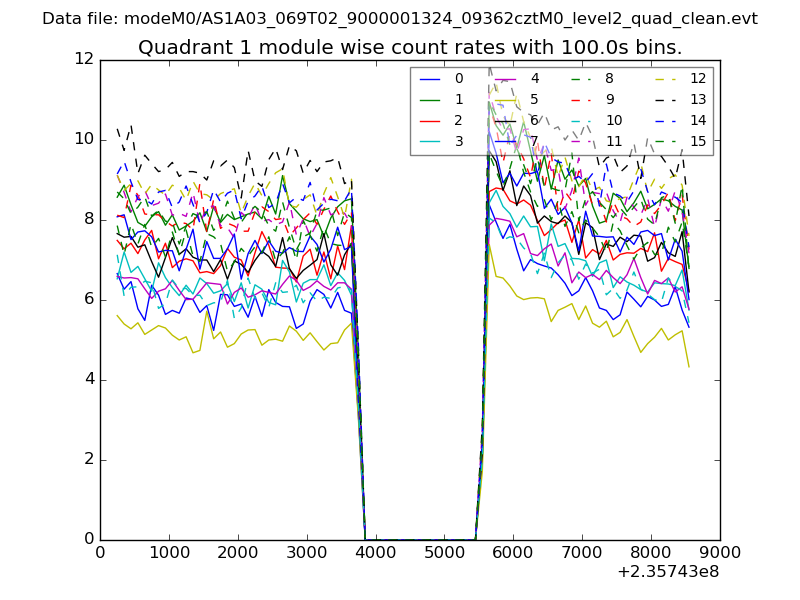 |
 |
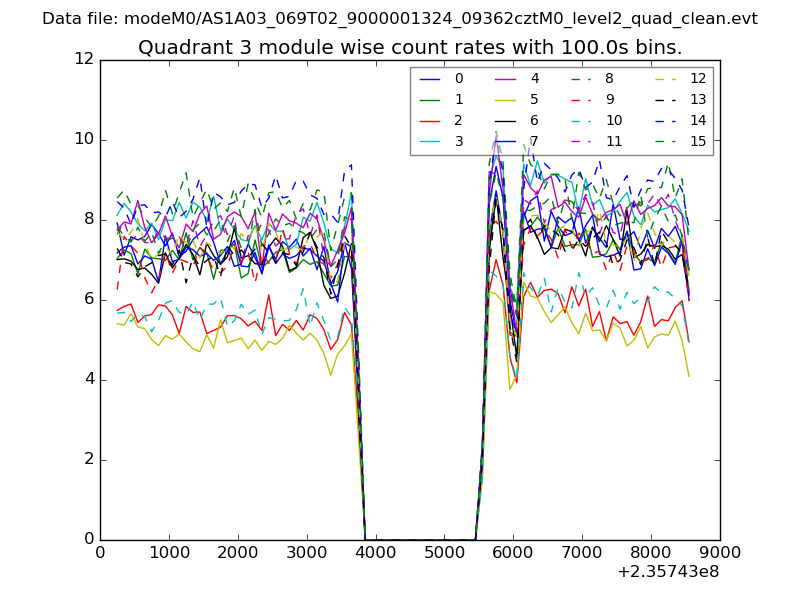
| Module-wise count rates for Quadrant C Data is divided into 100 sec bins |
 |
 |
| Module-wise count rates for Quadrant D Data is divided into 100 sec bins |
 |
 |
| Parameter | Plot |
|---|---|
| CZT HV Monitor |  |
| D_VDD | 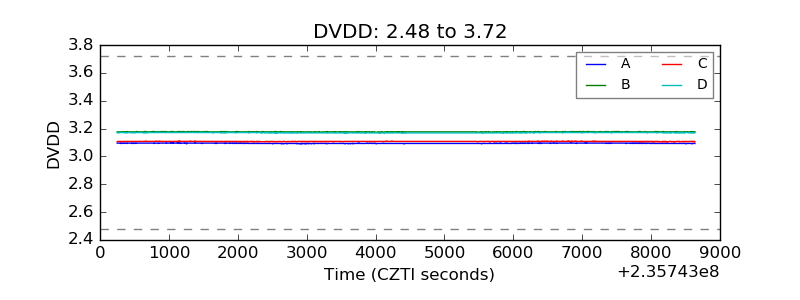 |
| Temperature 1 | 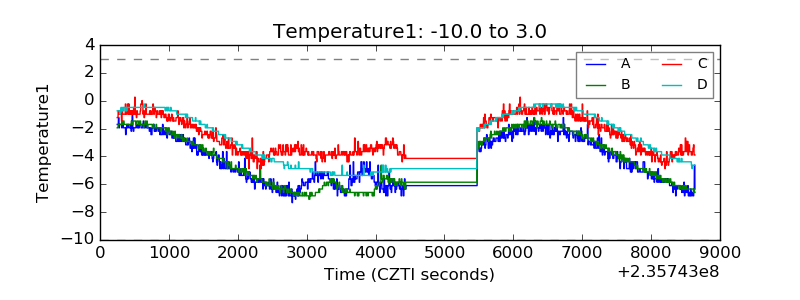 |
| Veto HV Monitor | 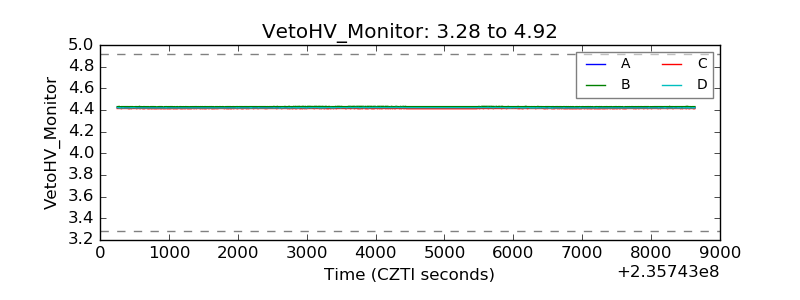 |
| Veto LLD | 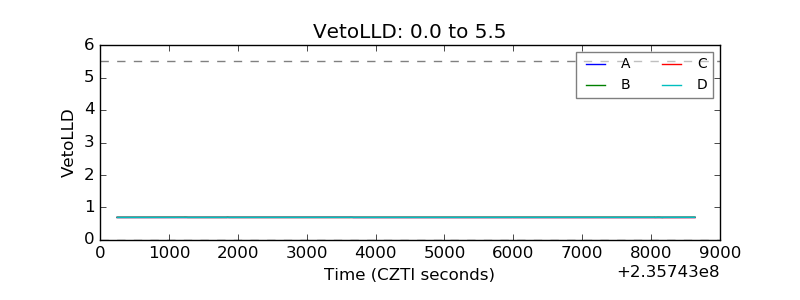 |
| Alpha Counter | 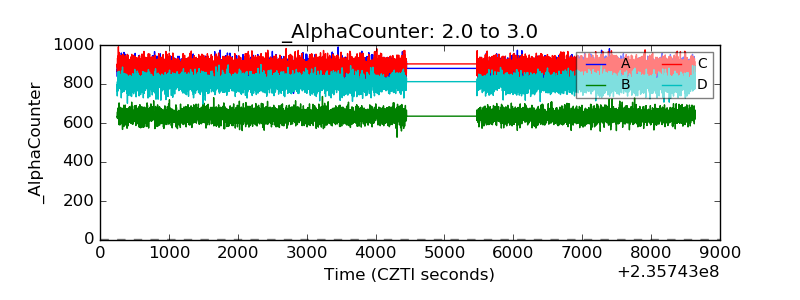 |
| _CPM_Rate | 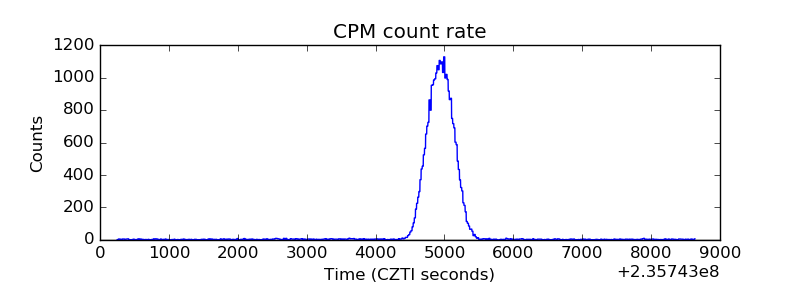 |
| CZT Counter | 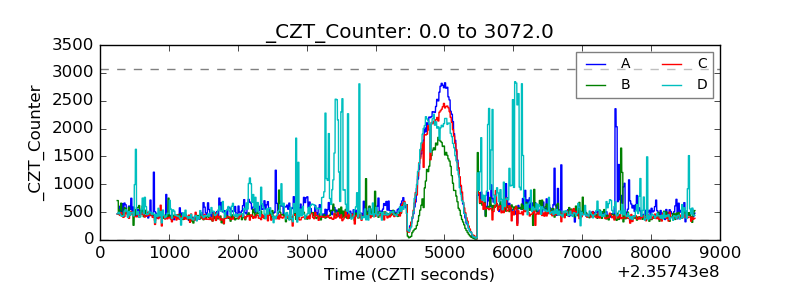 |
| +2.5 Volts monitor |  |
| +5 Volts monitor | 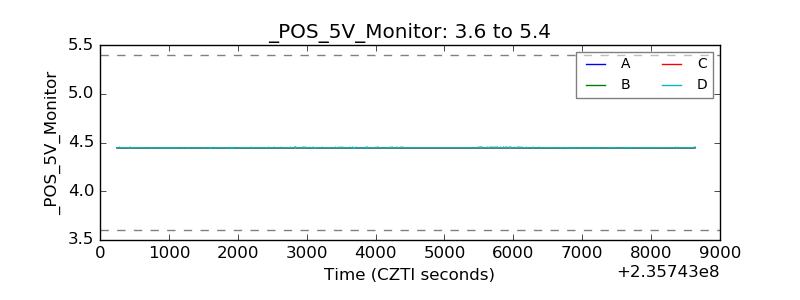 |
| _ROLL_ROT | 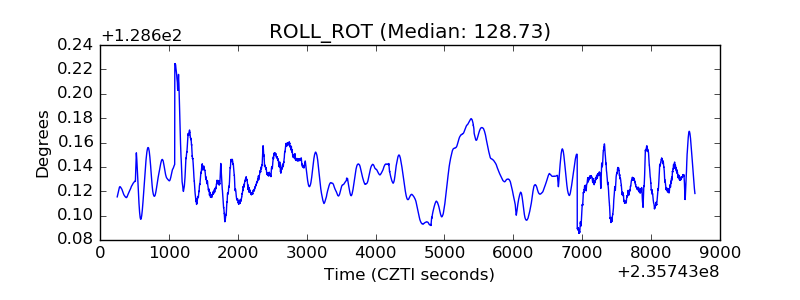 |
| _Roll_DEC | 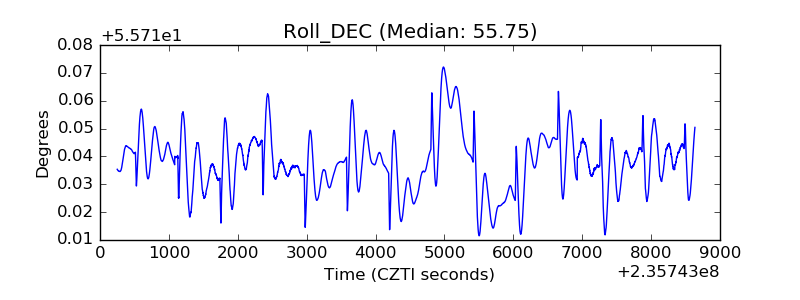 |
| _Roll_RA | 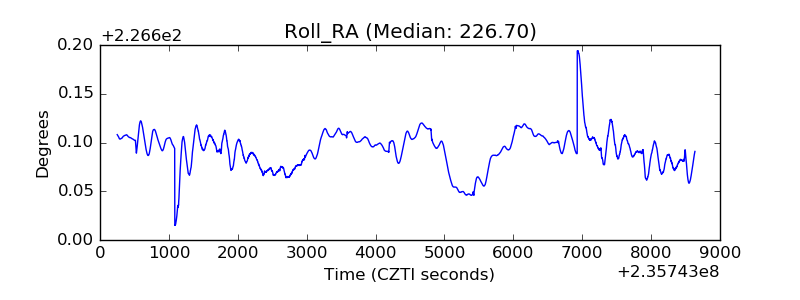 |
| Veto Counter | 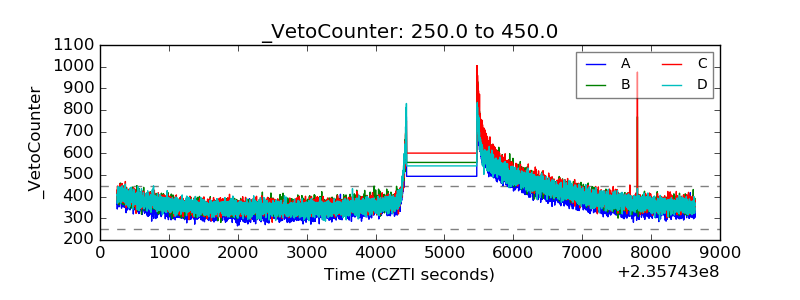 |