| Param | Original file | Final file |
|---|---|---|
| Filename | modeM0/AS1G07_040T01_9000001326cztM0_level2.fits | modeM0/AS1G07_040T01_9000001326cztM0_level2_quad_clean.evt |
| Size (bytes) | 356,086,080 | 342,648,000 |
| Size | 339.6 MB | 326.8 MB |
| Events in quadrant A | 2,148,232 | 2,055,979 |
| Events in quadrant B | 2,103,602 | 2,059,217 |
| Events in quadrant C | 2,138,042 | 1,942,684 |
| Events in quadrant D | 1,753,048 | 1,678,542 |
| Mode M0 | |||
|---|---|---|---|
| Quadrant | BADHDUFLAG | Total packets | Discarded packets |
| A | 0 | 97982 | 0 |
| B | 0 | 81270 | 0 |
| C | 0 | 78953 | 0 |
| D | 0 | 121134 | 0 |
| Mode M9 | |||
|---|---|---|---|
| Quadrant | BADHDUFLAG | Total packets | Discarded packets |
| A | 0 | 80 | 0 |
| B | 0 | 80 | 0 |
| C | 0 | 80 | 0 |
| D | 0 | 80 | 0 |
| Mode SS | |||
|---|---|---|---|
| Quadrant | BADHDUFLAG | Total packets | Discarded packets |
| A | 0 | 784 | 0 |
| B | 0 | 784 | 0 |
| C | 0 | 784 | 0 |
| D | 0 | 784 | 0 |
| Quadrant | Total seconds | Saturated seconds | Saturation percentage |
|---|---|---|---|
| A | 38448 | 689 | 1.792031% |
| B | 38448 | 326 | 0.847898% |
| C | 38448 | 121 | 0.314711% |
| D | 38447 | 3062 | 7.964210% |
Noise dominated data is calculated using 1-second bins in cleaned event files. If a bin has >2000 counts, and if more than 50% of those come from <1% of pixels, then it is considered to be noise-dominated and hence unusable.
| Quadrant | # 1 sec bins | Bins with >0 counts | Bins with >2000 counts | High rate bins dominated by noise | Noise dominated (total time) | Noise dominated (detector-on time) | Marked lightcurve |
|---|---|---|---|---|---|---|---|
| A | 46404 | 38446 | 0 | 0 | 0.00% | 0.00% |  |
| B | 46404 | 38448 | 0 | 0 | 0.00% | 0.00% |  |
| C | 46404 | 38448 | 0 | 0 | 0.00% | 0.00% |  |
| D | 46404 | 38433 | 0 | 0 | 0.00% | 0.00% |  |
Top three noisy pixels from each quadrant. If the there are fewer than three noisy pixels in the level2.evt file, extra rows are filled as -1
| Pixel properties | Quadrant properties | ||||||
|---|---|---|---|---|---|---|---|
| Quadrant | DetID | PixID | Counts | Sigma | Mean | Median | Sigma |
| A | 0 | 29 | 2069 | 10.71 | 559 | 525 | 144.2 |
| A | 7 | 110 | 1736 | 8.4 | 559 | 525 | 144.2 |
| A | 9 | 19 | 1691 | 8.09 | 559 | 525 | 144.2 |
| B | 2 | 9 | 1876 | 12.16 | 556 | 531 | 110.6 |
| B | 12 | 226 | 1428 | 8.11 | 556 | 531 | 110.6 |
| B | 14 | 254 | 1395 | 7.81 | 556 | 531 | 110.6 |
| C | 1 | 81 | 1648 | 7.58 | 564 | 524 | 148.3 |
| C | 1 | 80 | 1599 | 7.25 | 564 | 524 | 148.3 |
| C | 12 | 241 | 1495 | 6.55 | 564 | 524 | 148.3 |
| D | 3 | 14 | 1389 | 6.94 | 499 | 453 | 134.8 |
| D | 4 | 246 | 1380 | 6.88 | 499 | 453 | 134.8 |
| D | 6 | 231 | 1309 | 6.35 | 499 | 453 | 134.8 |
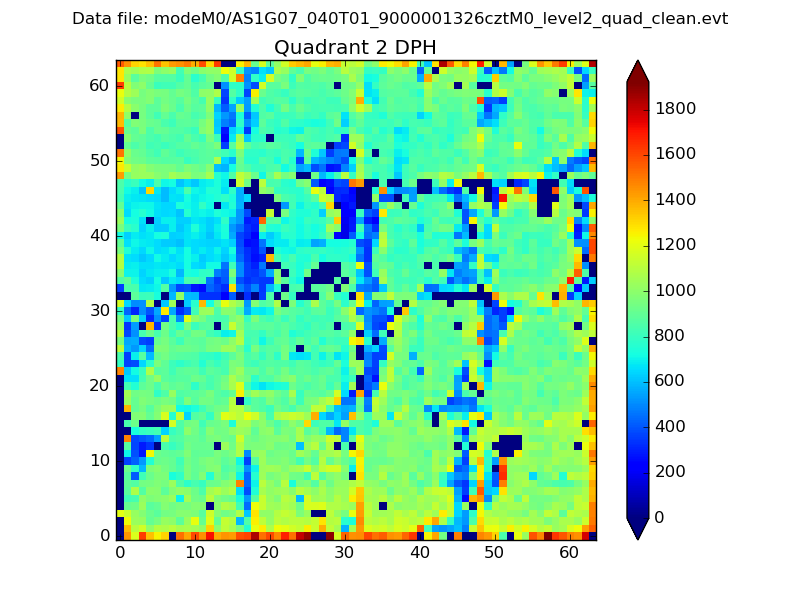
Histogram calculated using DETX and DETY for each event in the final _common_clean file
| Quadrant A |  |
 |
Quadrant B |
|---|---|---|---|
| Quadrant D |  |
 |
Quadrant C |
| Plot type | Count rate plots | Images |
|---|---|---|
| Comparison with Poisson distribution Blue bars denote a histogram of data divided into 1 sec bins. Red curve is a Poisson curve with rate = median count rate of data. |
 |
 |
| Quadrant-wise count rates Data is divided into 100 sec bins |
 |
|
| Module-wise count rates for Quadrant A Data is divided into 100 sec bins |
 |
 |
| Module-wise count rates for Quadrant B Data is divided into 100 sec bins |
 |
 |
| Module-wise count rates for Quadrant C Data is divided into 100 sec bins |
 |
 |
| Module-wise count rates for Quadrant D Data is divided into 100 sec bins |
 |
 |
| Parameter | Plot |
|---|---|
| CZT HV Monitor |  |
| D_VDD | 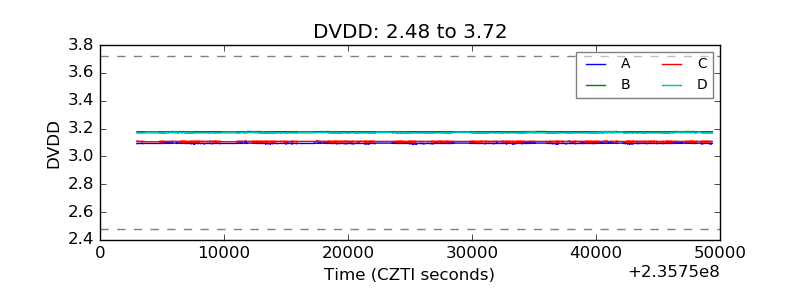 |
| Temperature 1 | 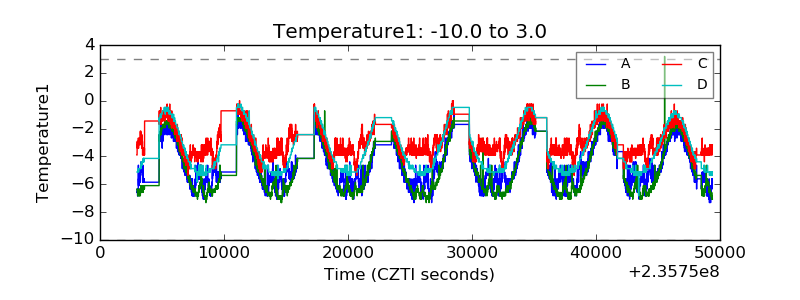 |
| Veto HV Monitor |  |
| Veto LLD |  |
| Alpha Counter |  |
| _CPM_Rate |  |
| CZT Counter |  |
| +2.5 Volts monitor | 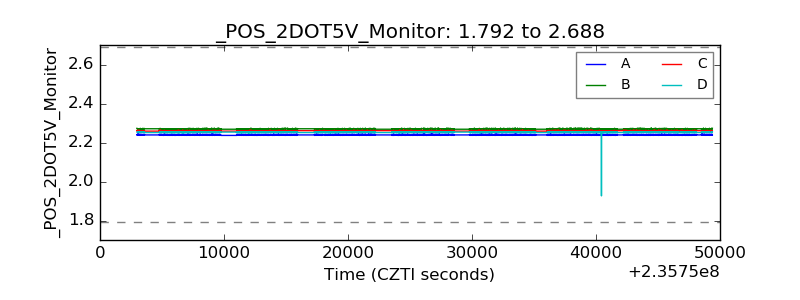 |
| +5 Volts monitor |  |
| _ROLL_ROT |  |
| _Roll_DEC |  |
| _Roll_RA |  |
| Veto Counter |  |