| Param | Original file | Final file |
|---|---|---|
| Filename | modeM0/AS1G07_040T01_9000001326_09362cztM0_level2.evt | modeM0/AS1G07_040T01_9000001326_09362cztM0_level2_quad_clean.evt |
| Size (bytes) | 190,437,120 | 38,592,000 |
| Size | 181.6 MB | 36.8 MB |
| Events in quadrant A | 1,755,018 | 251,075 |
| Events in quadrant B | 1,344,838 | 256,745 |
| Events in quadrant C | 1,174,476 | 250,005 |
| Events in quadrant D | 1,330,841 | 240,624 |
| Mode M0 | |||
|---|---|---|---|
| Quadrant | BADHDUFLAG | Total packets | Discarded packets |
| A | 0 | 6967 | 2 |
| B | 0 | 5606 | 1 |
| C | 0 | 4989 | 1 |
| D | 0 | 5552 | 3 |
| Mode M9 | |||
|---|---|---|---|
| Quadrant | BADHDUFLAG | Total packets | Discarded packets |
| A | 0 | 12 | 0 |
| B | 0 | 12 | 0 |
| C | 0 | 12 | 0 |
| D | 0 | 12 | 0 |
| Mode SS | |||
|---|---|---|---|
| Quadrant | BADHDUFLAG | Total packets | Discarded packets |
| A | 0 | 50 | 0 |
| B | 0 | 50 | 0 |
| C | 0 | 50 | 0 |
| D | 0 | 50 | 0 |
| Quadrant | Total seconds | Saturated seconds | Saturation percentage |
|---|---|---|---|
| A | 2356 | 86 | 3.650255% |
| B | 2356 | 52 | 2.207131% |
| C | 2356 | 28 | 1.188455% |
| D | 2355 | 44 | 1.868365% |
Noise dominated data is calculated using 1-second bins in cleaned event files. If a bin has >2000 counts, and if more than 50% of those come from <1% of pixels, then it is considered to be noise-dominated and hence unusable.
| Quadrant | # 1 sec bins | Bins with >0 counts | Bins with >2000 counts | High rate bins dominated by noise | Noise dominated (total time) | Noise dominated (detector-on time) | Marked lightcurve |
|---|---|---|---|---|---|---|---|
| A | 3526 | 2357 | 9 | 9 | 0.26% | 0.38% | 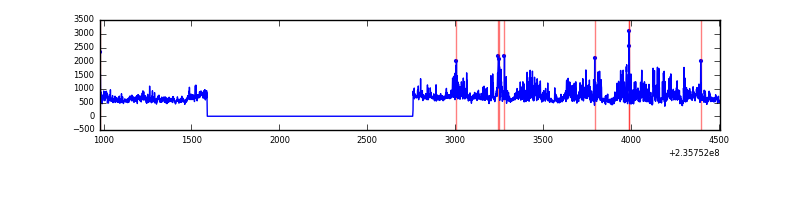 |
| B | 3526 | 2357 | 3 | 3 | 0.09% | 0.13% | 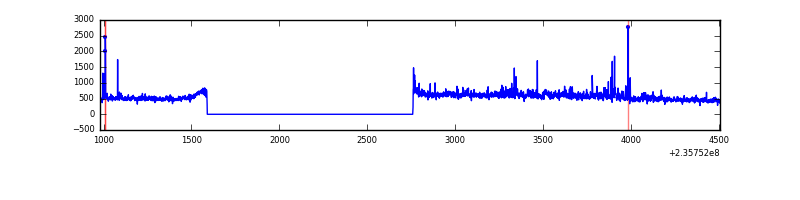 |
| C | 3526 | 2357 | 0 | 0 | 0.00% | 0.00% |  |
| D | 3526 | 2357 | 2 | 2 | 0.06% | 0.08% | 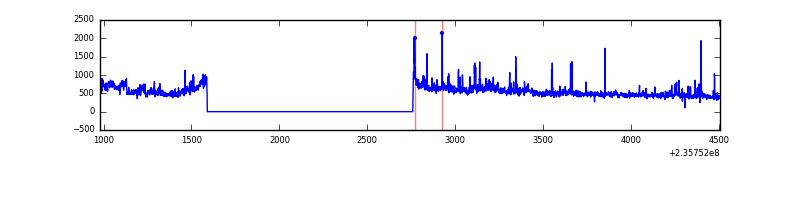 |
Top three noisy pixels from each quadrant. If the there are fewer than three noisy pixels in the level2.evt file, extra rows are filled as -1
| Pixel properties | Quadrant properties | ||||||
|---|---|---|---|---|---|---|---|
| Quadrant | DetID | PixID | Counts | Sigma | Mean | Median | Sigma |
| A | 8 | 5 | 521424 | 8140.04 | 312 | 306 | 64.0 |
| A | 13 | 251 | 12243 | 186.46 | 312 | 306 | 64.0 |
| A | 1 | 162 | 7692 | 115.37 | 312 | 306 | 64.0 |
| B | 0 | 214 | 58089 | 958.09 | 310 | 304 | 60.3 |
| B | 0 | 219 | 21816 | 356.67 | 310 | 304 | 60.3 |
| B | 4 | 173 | 15506 | 252.05 | 310 | 304 | 60.3 |
| C | 9 | 68 | 6581 | 89.98 | 298 | 299 | 69.8 |
| C | 14 | 67 | 2350 | 29.38 | 298 | 299 | 69.8 |
| C | 13 | 61 | 2221 | 27.53 | 298 | 299 | 69.8 |
| D | 8 | 195 | 73867 | 915.17 | 299 | 292 | 80.4 |
| D | 1 | 52 | 50972 | 630.39 | 299 | 292 | 80.4 |
| D | 12 | 233 | 15585 | 190.22 | 299 | 292 | 80.4 |
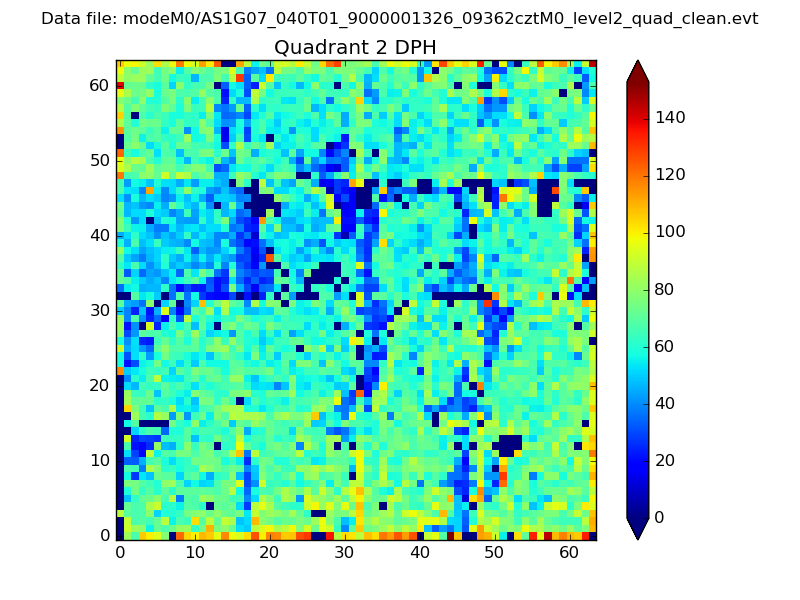
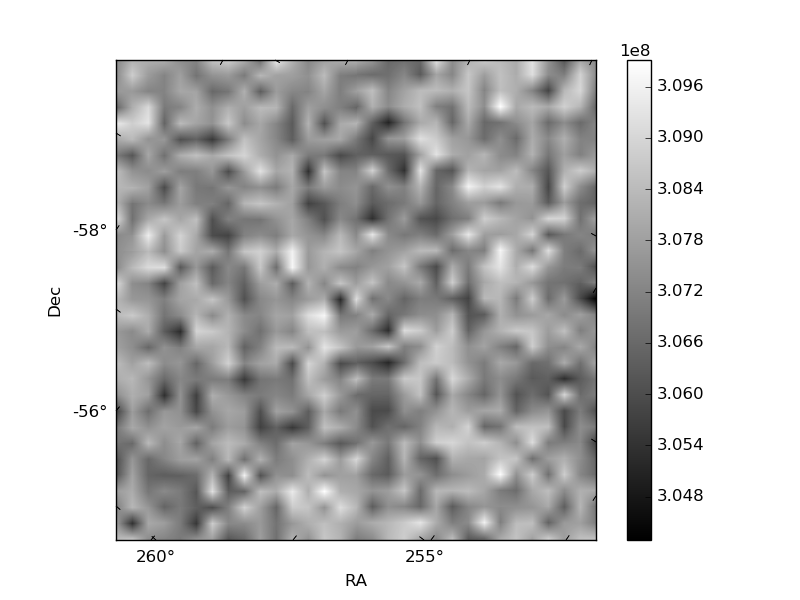
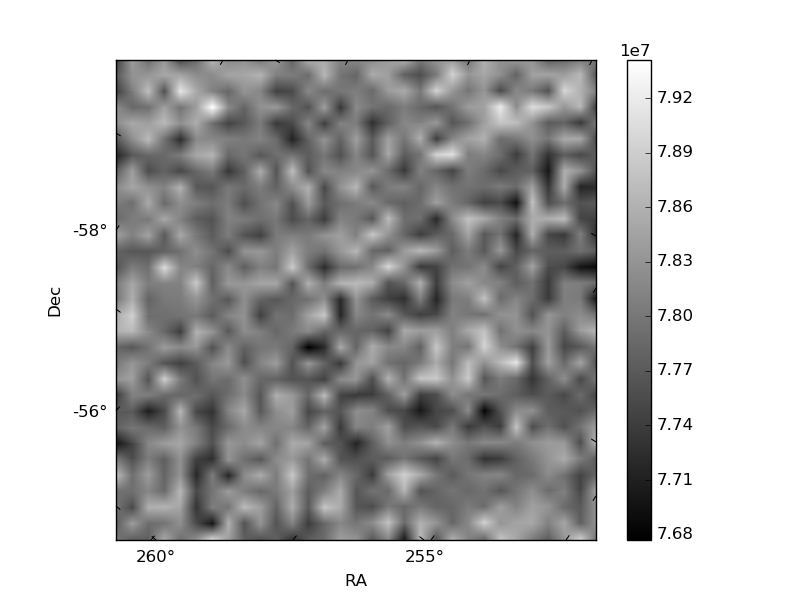
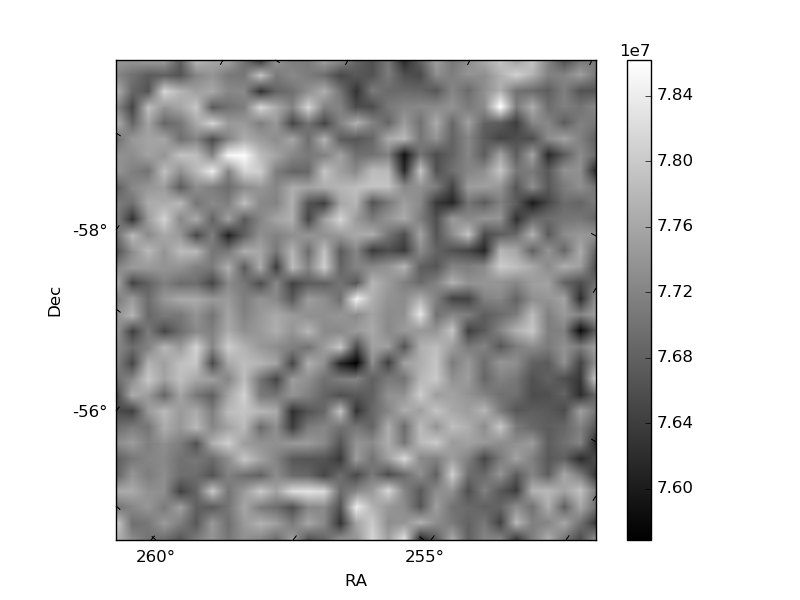
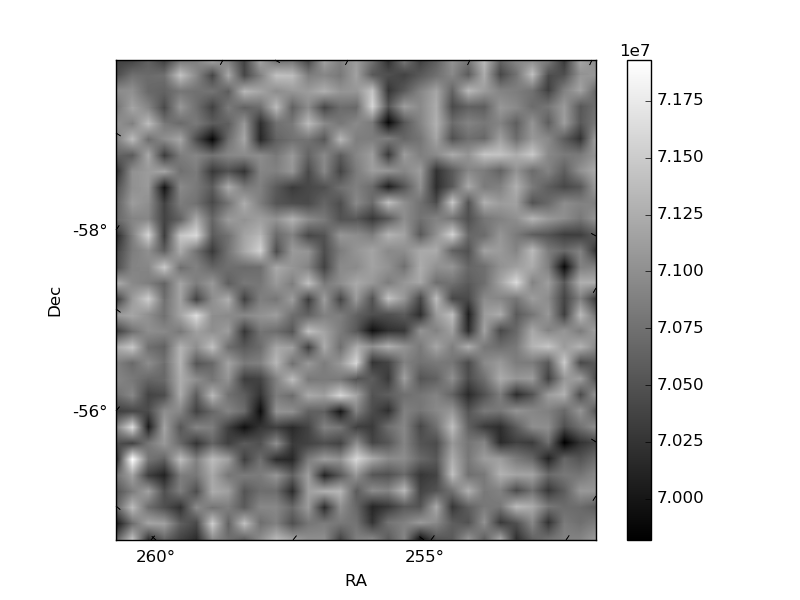
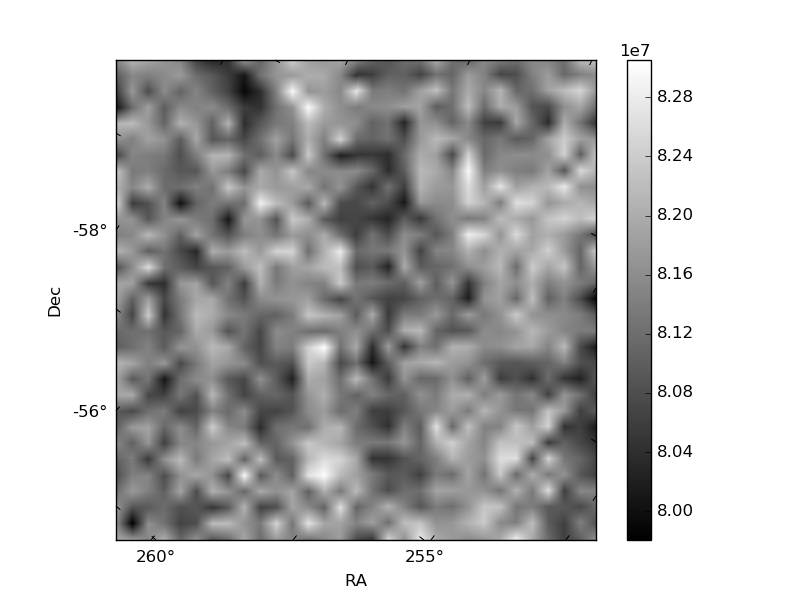
Histogram calculated using DETX and DETY for each event in the final _common_clean file
| Quadrant A | 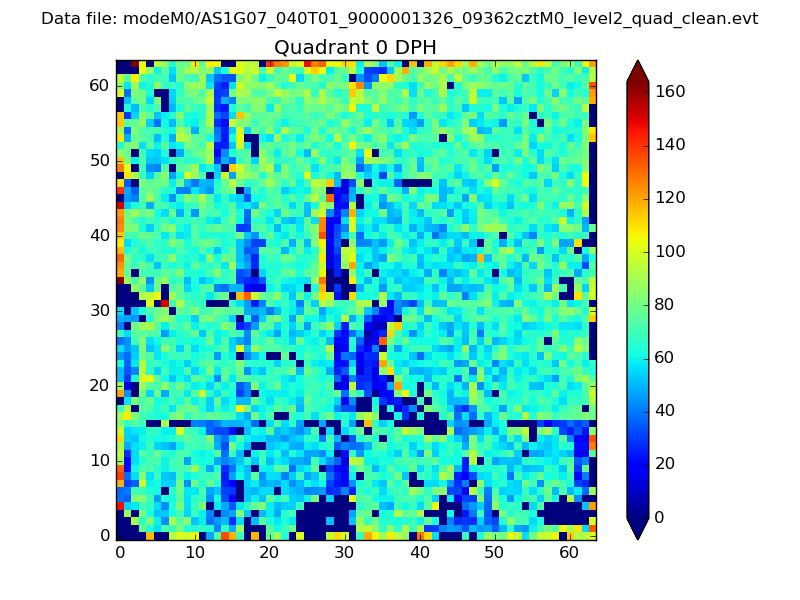 |
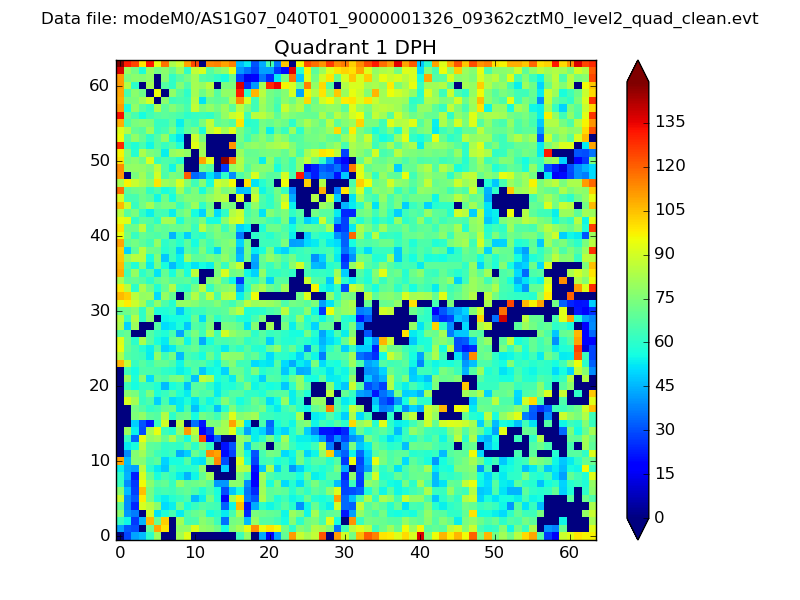 |
Quadrant B |
|---|---|---|---|
| Quadrant D | 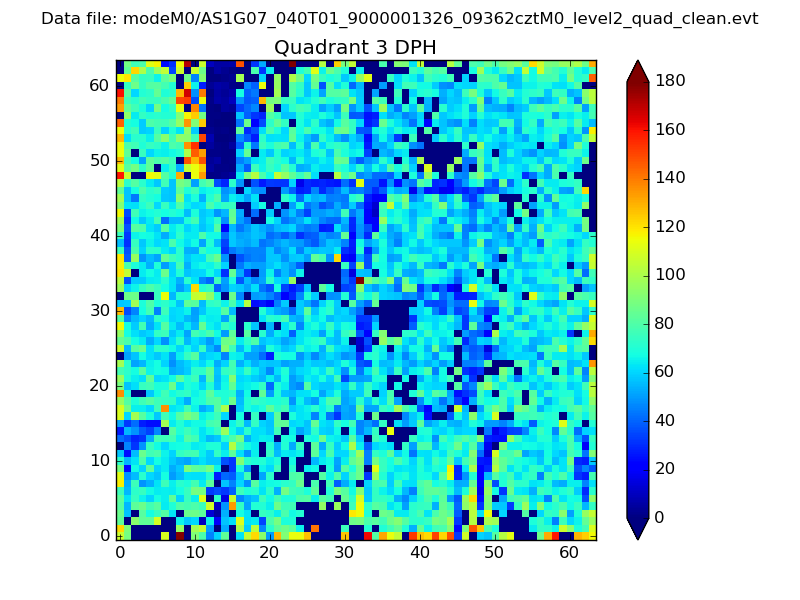 |
 |
Quadrant C |
| Plot type | Count rate plots | Images |
|---|---|---|
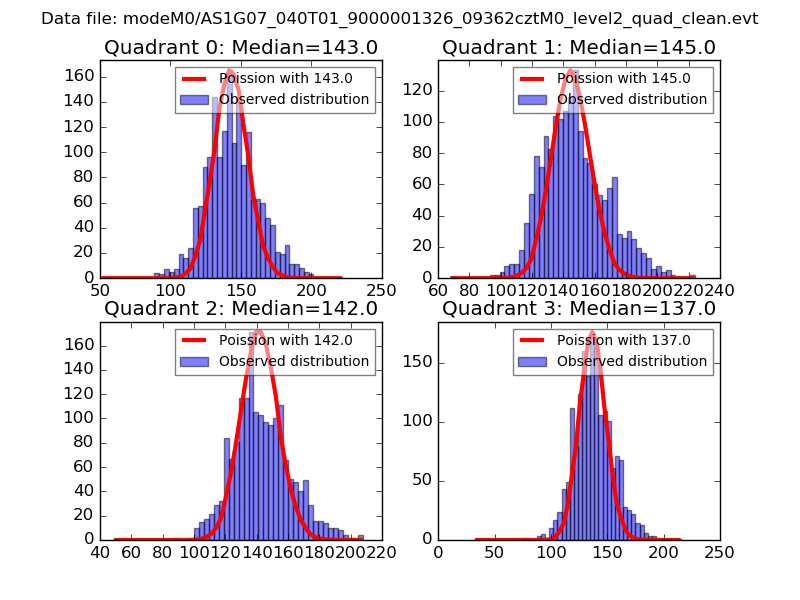
| Comparison with Poisson distribution Blue bars denote a histogram of data divided into 1 sec bins. Red curve is a Poisson curve with rate = median count rate of data. |
 |
 |
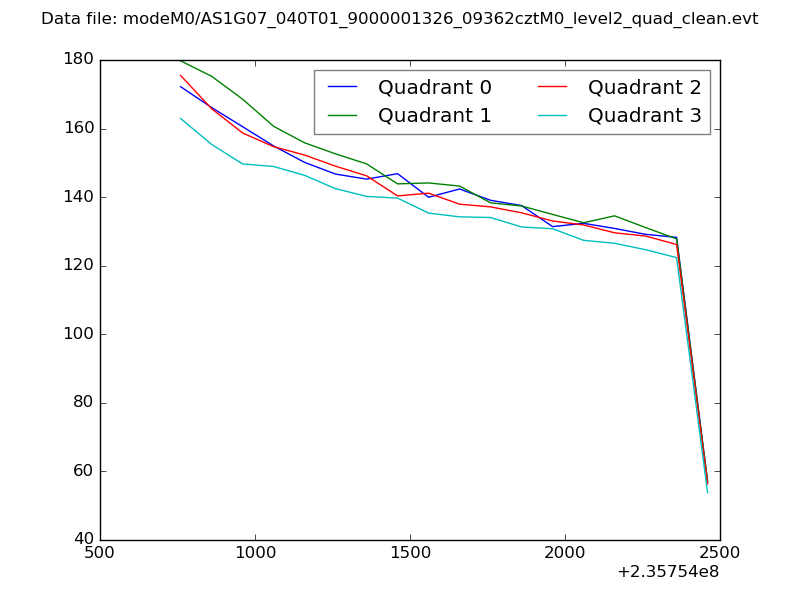
| Quadrant-wise count rates Data is divided into 100 sec bins |
 |
|
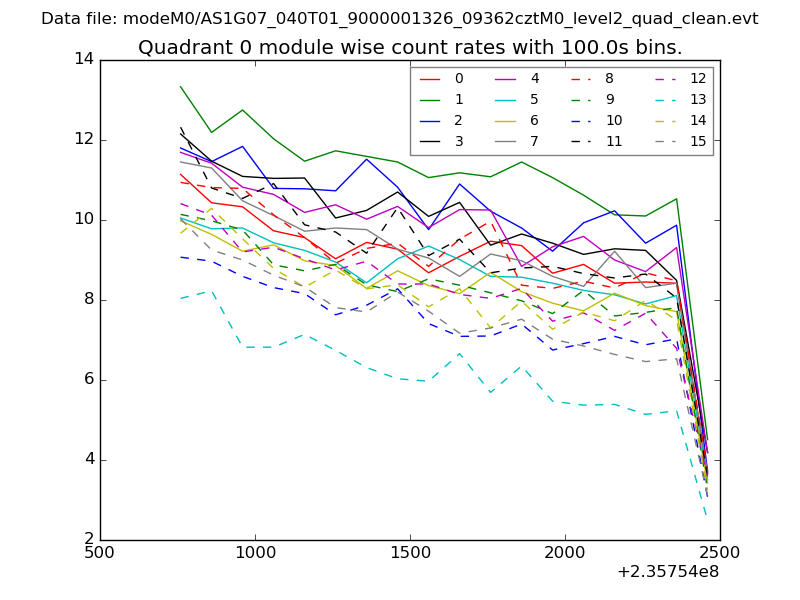
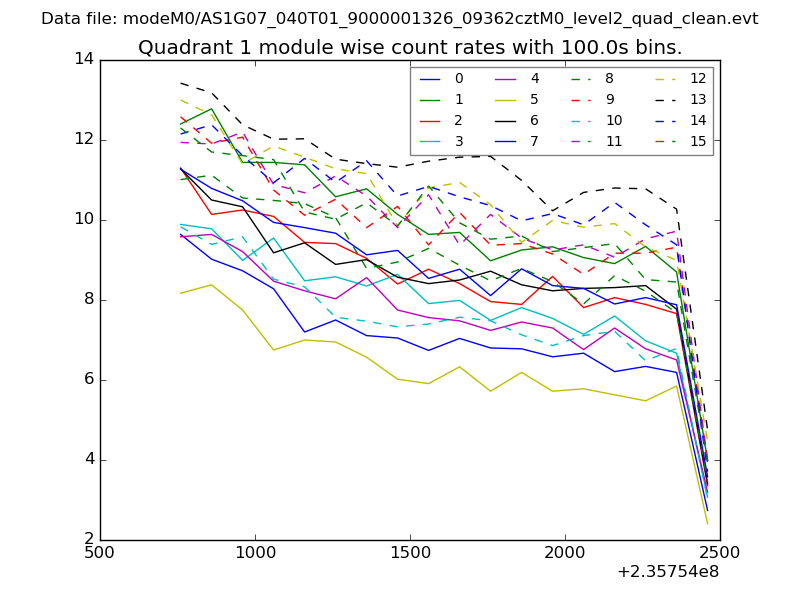
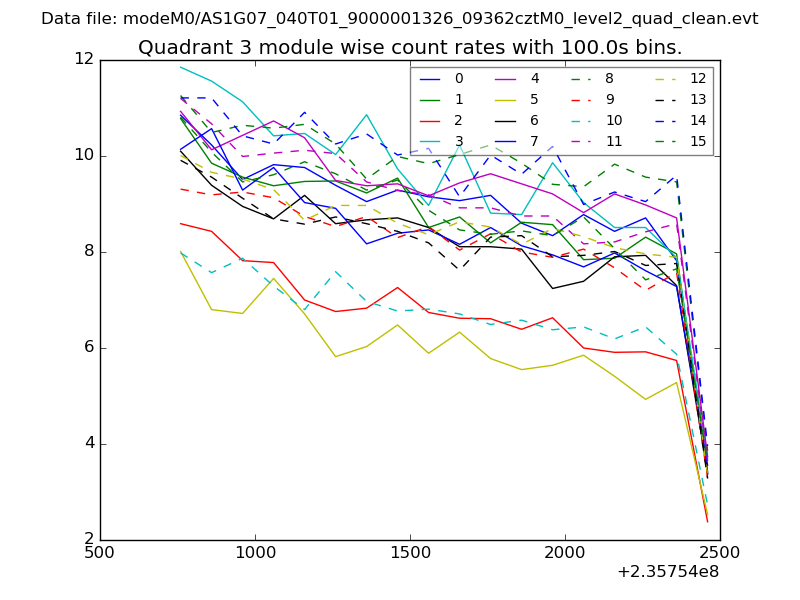
| Module-wise count rates for Quadrant A Data is divided into 100 sec bins |
 |
 |
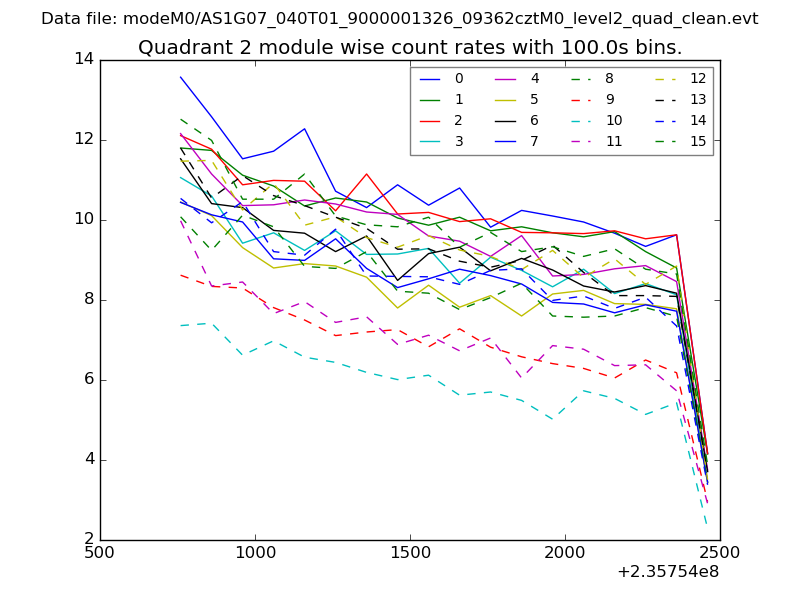
| Module-wise count rates for Quadrant B Data is divided into 100 sec bins |
 |
 |
| Module-wise count rates for Quadrant C Data is divided into 100 sec bins |
 |
 |
| Module-wise count rates for Quadrant D Data is divided into 100 sec bins |
 |
 |
| Parameter | Plot |
|---|---|
| CZT HV Monitor | 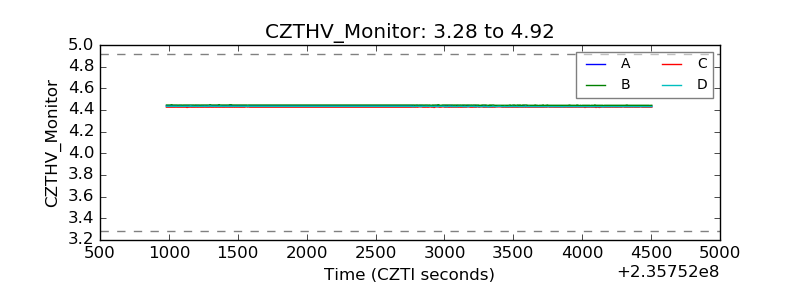 |
| D_VDD | 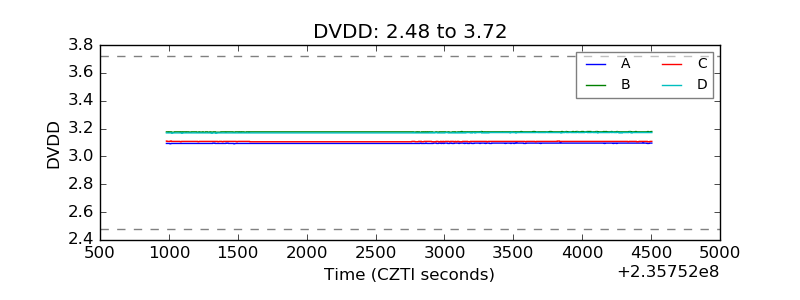 |
| Temperature 1 | 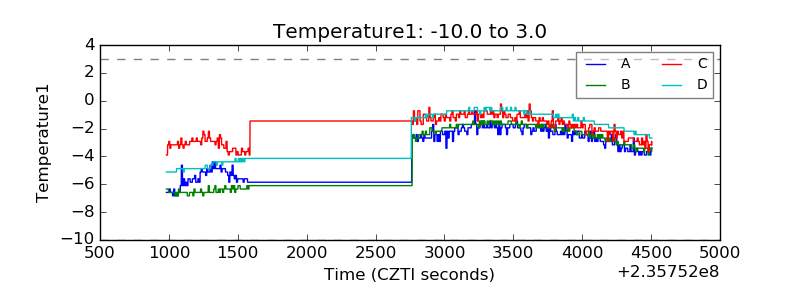 |
| Veto HV Monitor |  |
| Veto LLD | 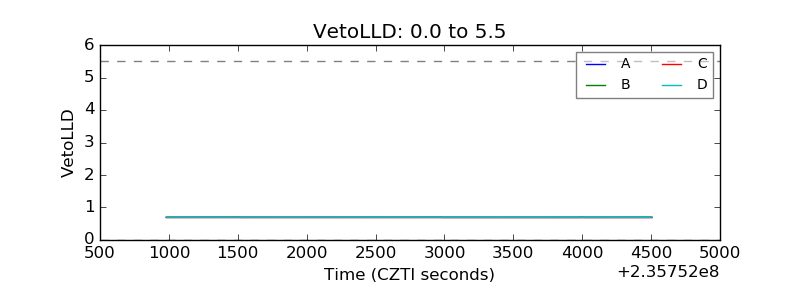 |
| Alpha Counter | 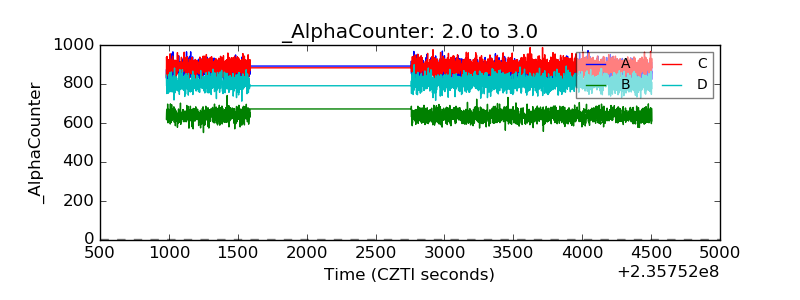 |
| _CPM_Rate |  |
| CZT Counter | 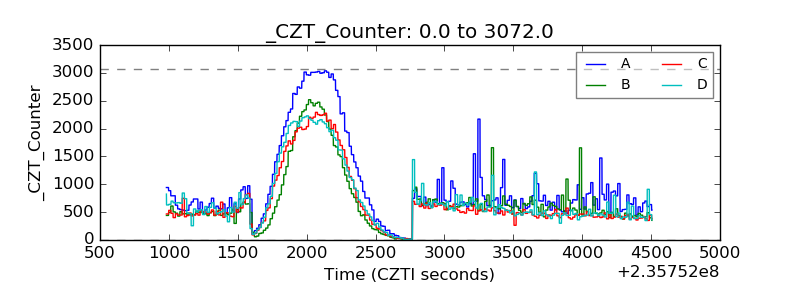 |
| +2.5 Volts monitor | 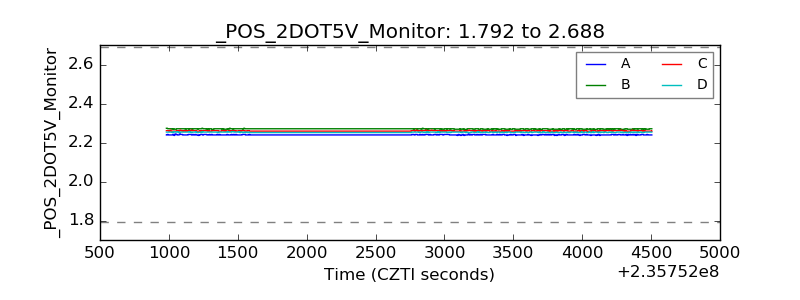 |
| +5 Volts monitor |  |
| _ROLL_ROT | 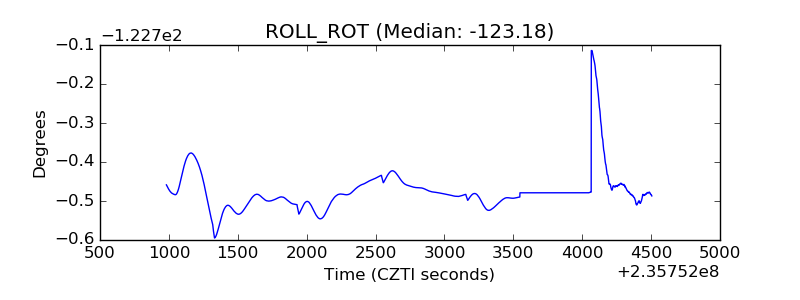 |
| _Roll_DEC | 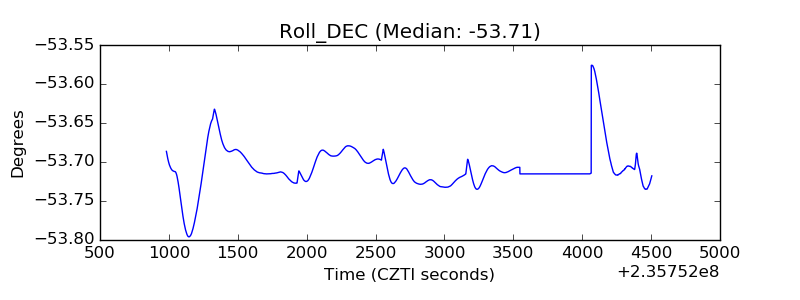 |
| _Roll_RA | 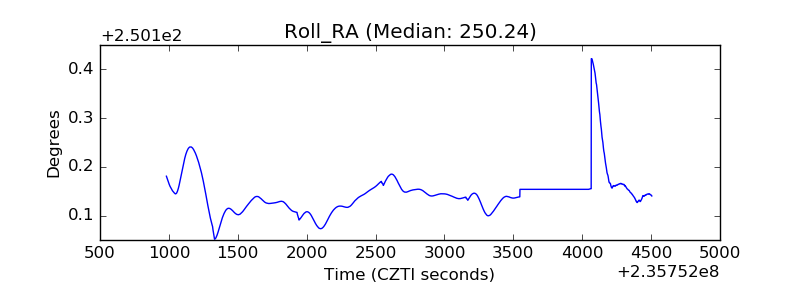 |
| Veto Counter | 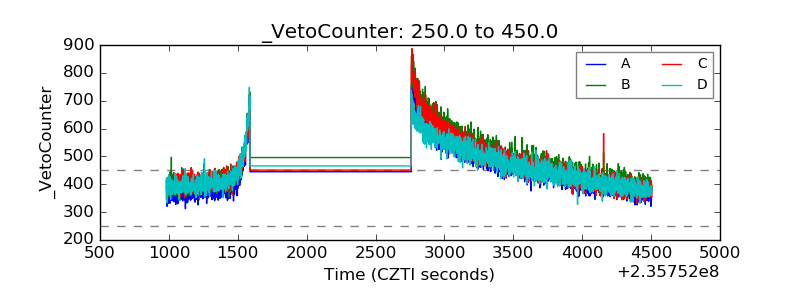 |