| Param | Original file | Final file |
|---|---|---|
| Filename | modeM0/AS1G07_040T01_9000001326_09364cztM0_level2.evt | modeM0/AS1G07_040T01_9000001326_09364cztM0_level2_quad_clean.evt |
| Size (bytes) | 486,331,200 | 102,983,040 |
| Size | 463.8 MB | 98.2 MB |
| Events in quadrant A | 4,078,464 | 684,309 |
| Events in quadrant B | 3,215,484 | 693,263 |
| Events in quadrant C | 2,892,410 | 665,519 |
| Events in quadrant D | 4,115,070 | 636,474 |
| Mode M0 | |||
|---|---|---|---|
| Quadrant | BADHDUFLAG | Total packets | Discarded packets |
| A | 0 | 16533 | 3 |
| B | 0 | 13736 | 2 |
| C | 0 | 12961 | 2 |
| D | 0 | 16672 | 2 |
| Mode M9 | |||
|---|---|---|---|
| Quadrant | BADHDUFLAG | Total packets | Discarded packets |
| A | 0 | 17 | 0 |
| B | 0 | 17 | 0 |
| C | 0 | 17 | 0 |
| D | 0 | 18 | 0 |
| Mode SS | |||
|---|---|---|---|
| Quadrant | BADHDUFLAG | Total packets | Discarded packets |
| A | 0 | 128 | 0 |
| B | 0 | 128 | 0 |
| C | 0 | 128 | 0 |
| D | 0 | 128 | 0 |
| Quadrant | Total seconds | Saturated seconds | Saturation percentage |
|---|---|---|---|
| A | 6295 | 101 | 1.604448% |
| B | 6295 | 37 | 0.587768% |
| C | 6295 | 6 | 0.095314% |
| D | 6295 | 53 | 0.841938% |
Noise dominated data is calculated using 1-second bins in cleaned event files. If a bin has >2000 counts, and if more than 50% of those come from <1% of pixels, then it is considered to be noise-dominated and hence unusable.
| Quadrant | # 1 sec bins | Bins with >0 counts | Bins with >2000 counts | High rate bins dominated by noise | Noise dominated (total time) | Noise dominated (detector-on time) | Marked lightcurve |
|---|---|---|---|---|---|---|---|
| A | 7626 | 6296 | 18 | 18 | 0.24% | 0.29% | 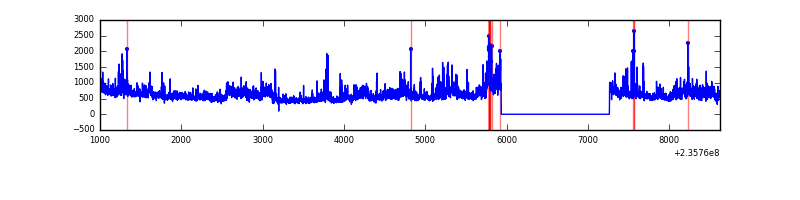 |
| B | 7626 | 6296 | 4 | 4 | 0.05% | 0.06% | 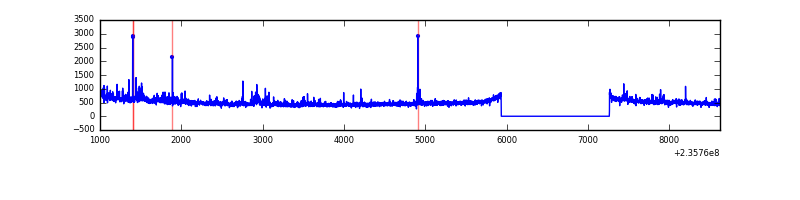 |
| C | 7626 | 6296 | 0 | 0 | 0.00% | 0.00% | 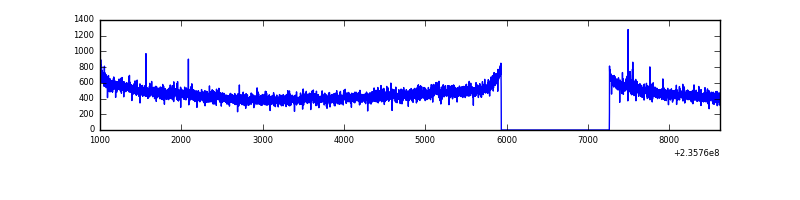 |
| D | 7626 | 6296 | 30 | 30 | 0.39% | 0.48% | 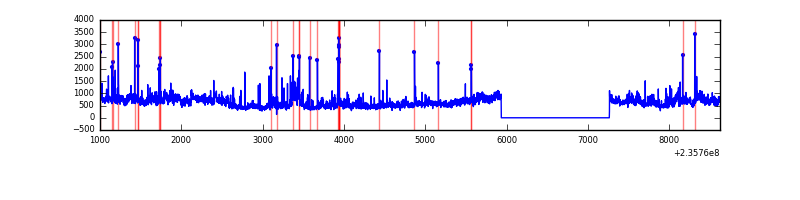 |
Top three noisy pixels from each quadrant. If the there are fewer than three noisy pixels in the level2.evt file, extra rows are filled as -1
| Pixel properties | Quadrant properties | ||||||
|---|---|---|---|---|---|---|---|
| Quadrant | DetID | PixID | Counts | Sigma | Mean | Median | Sigma |
| A | 8 | 5 | 877429 | 5594.61 | 772 | 757 | 156.7 |
| A | 1 | 162 | 78967 | 499.11 | 772 | 757 | 156.7 |
| A | 13 | 251 | 62297 | 392.73 | 772 | 757 | 156.7 |
| B | 0 | 214 | 48975 | 326.41 | 779 | 760 | 147.7 |
| B | 4 | 173 | 39643 | 263.24 | 779 | 760 | 147.7 |
| B | 0 | 245 | 29999 | 197.95 | 779 | 760 | 147.7 |
| C | 9 | 68 | 12177 | 68.12 | 733 | 736 | 167.9 |
| C | 14 | 67 | 9497 | 52.17 | 733 | 736 | 167.9 |
| C | 10 | 22 | 8195 | 44.41 | 733 | 736 | 167.9 |
| D | 8 | 195 | 783406 | 4051.05 | 725 | 707 | 193.2 |
| D | 1 | 52 | 332064 | 1715.02 | 725 | 707 | 193.2 |
| D | 1 | 255 | 49443 | 252.25 | 725 | 707 | 193.2 |
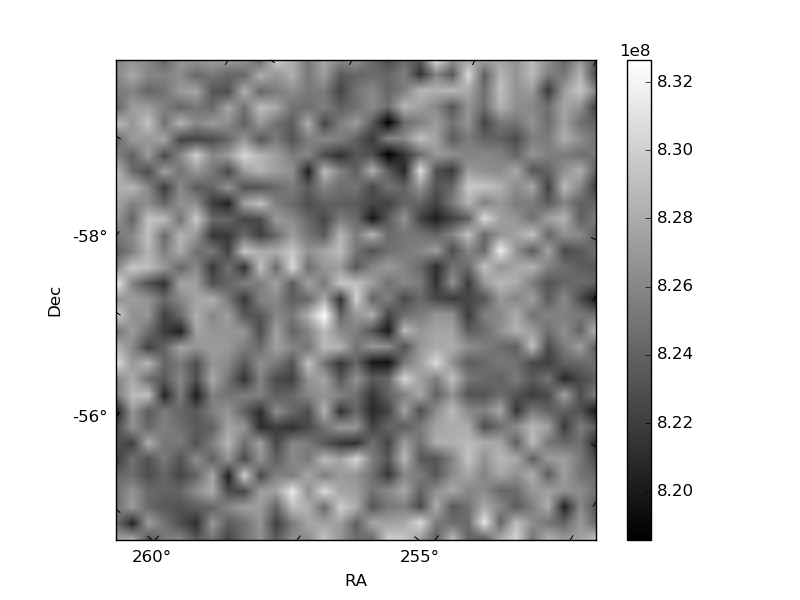
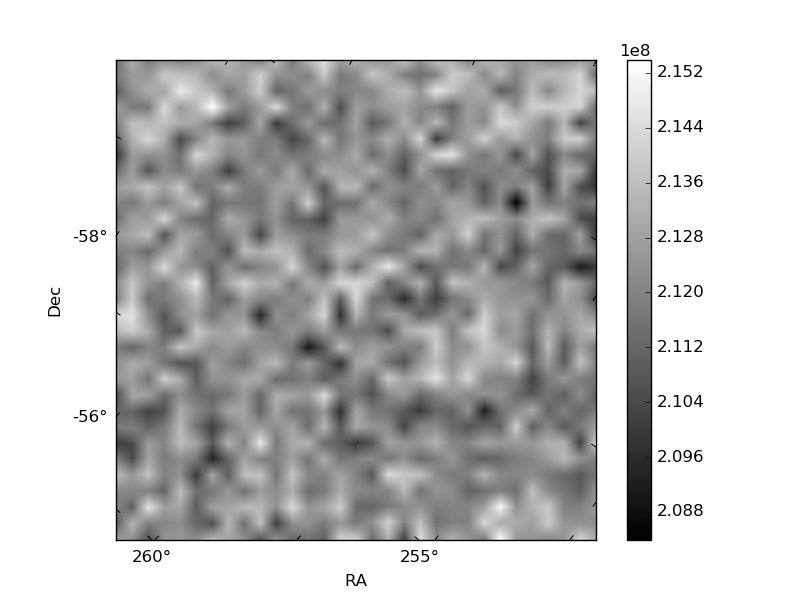
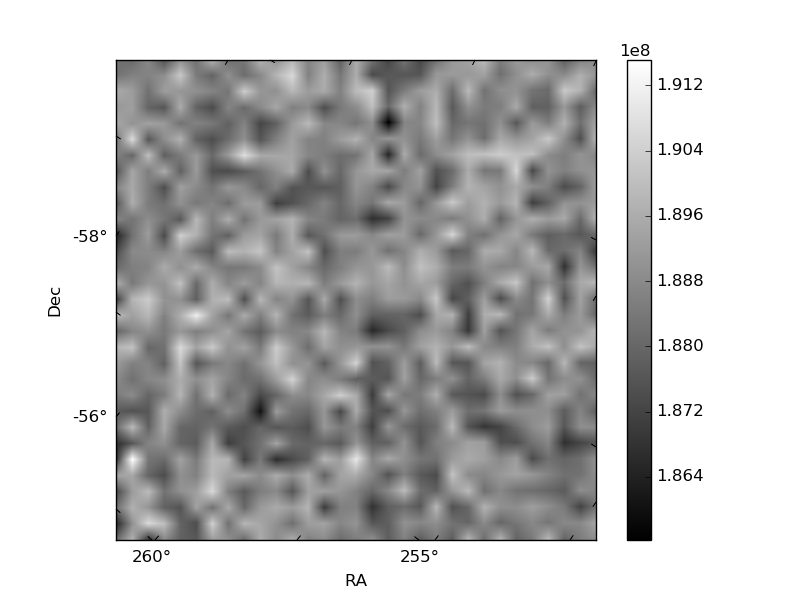
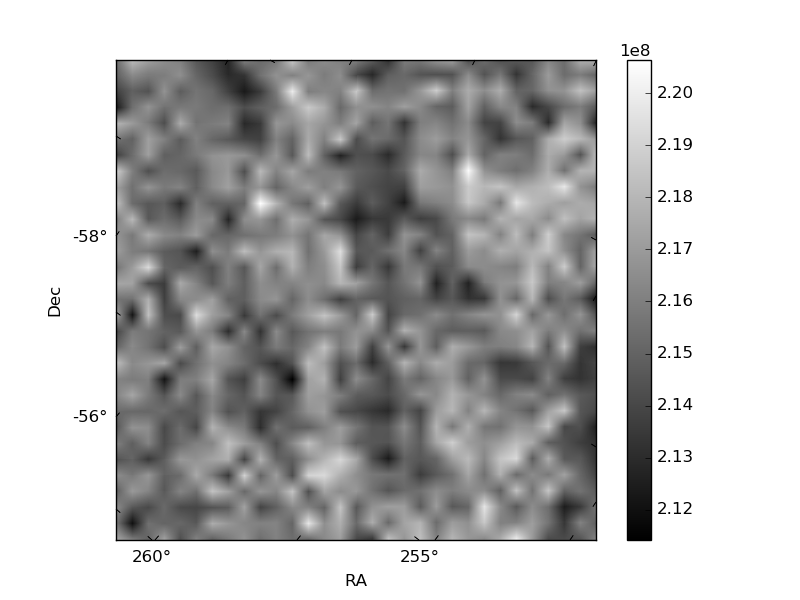
Histogram calculated using DETX and DETY for each event in the final _common_clean file
| Quadrant A | 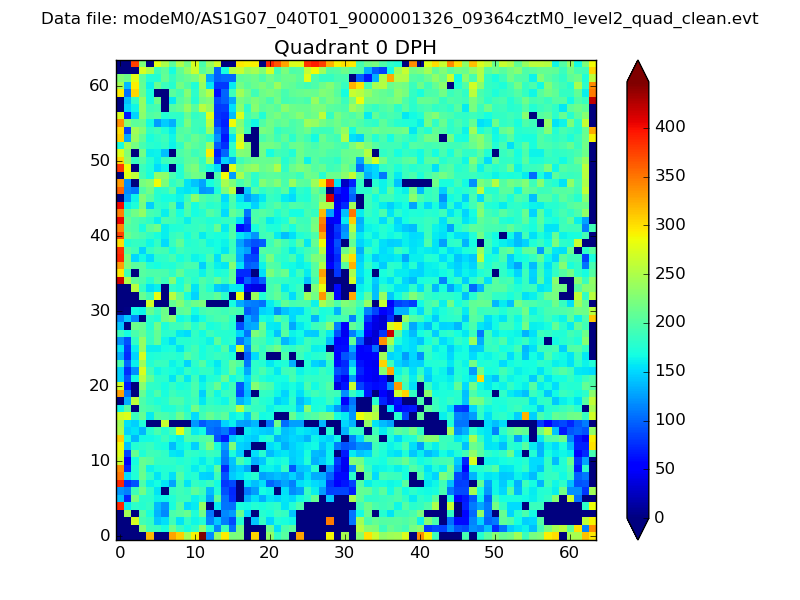 |
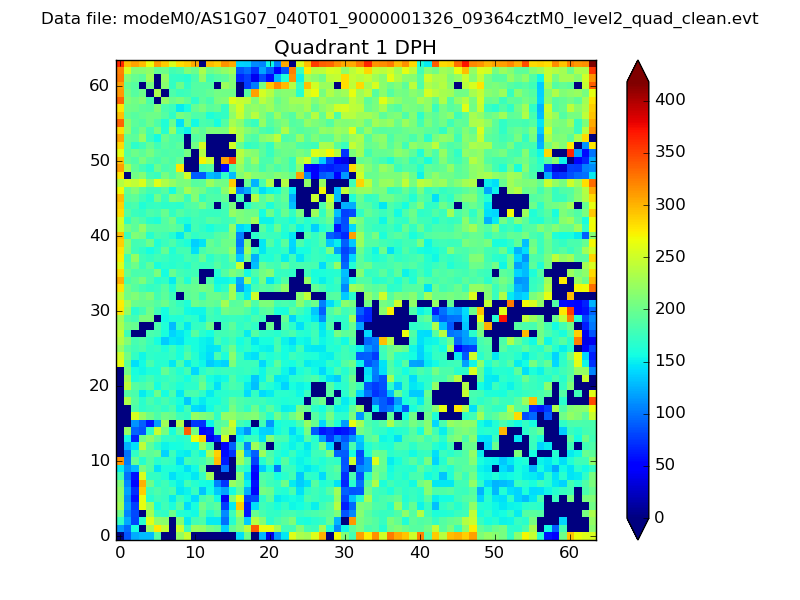 |
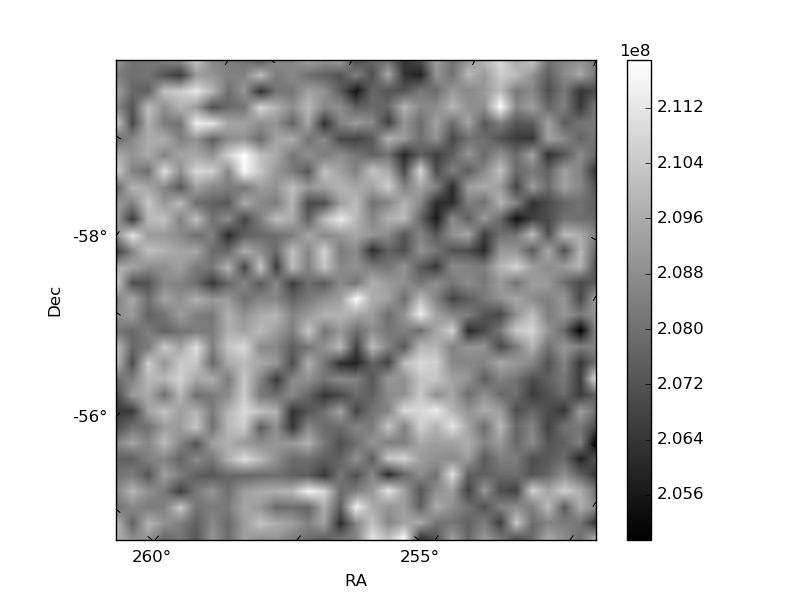
Quadrant B |
|---|---|---|---|
| Quadrant D | 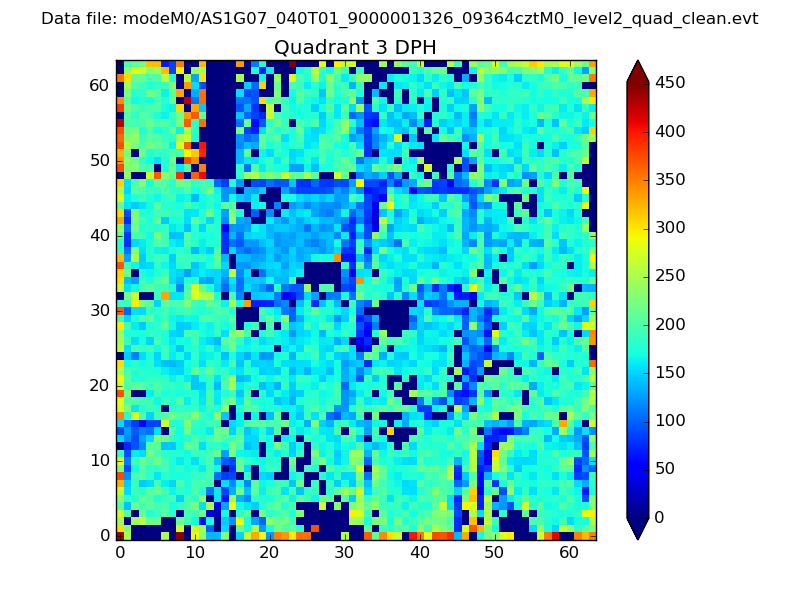 |
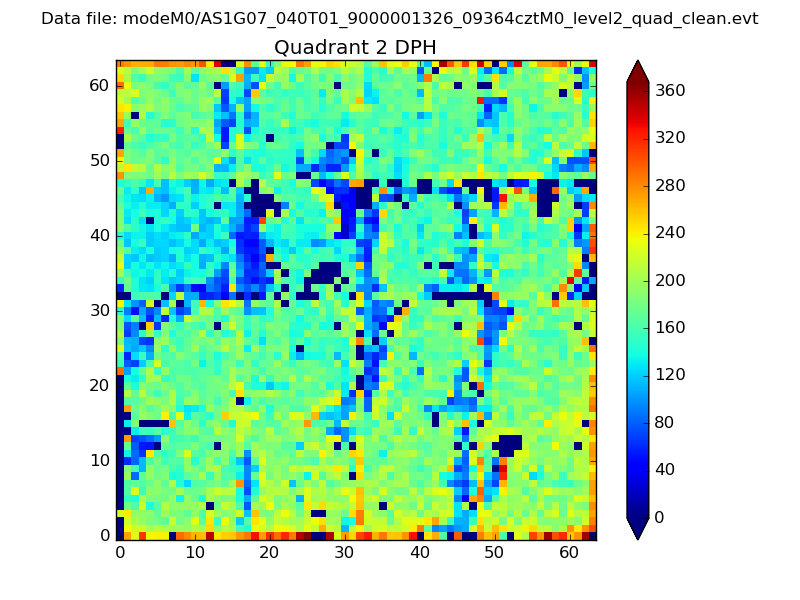 |
Quadrant C |
| Plot type | Count rate plots | Images |
|---|---|---|
| Comparison with Poisson distribution Blue bars denote a histogram of data divided into 1 sec bins. Red curve is a Poisson curve with rate = median count rate of data. |
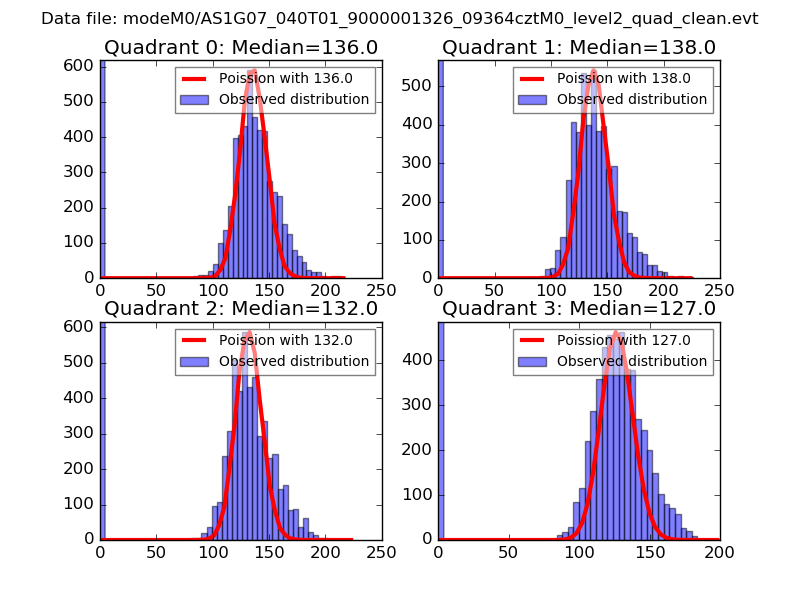 |
 |
| Quadrant-wise count rates Data is divided into 100 sec bins |
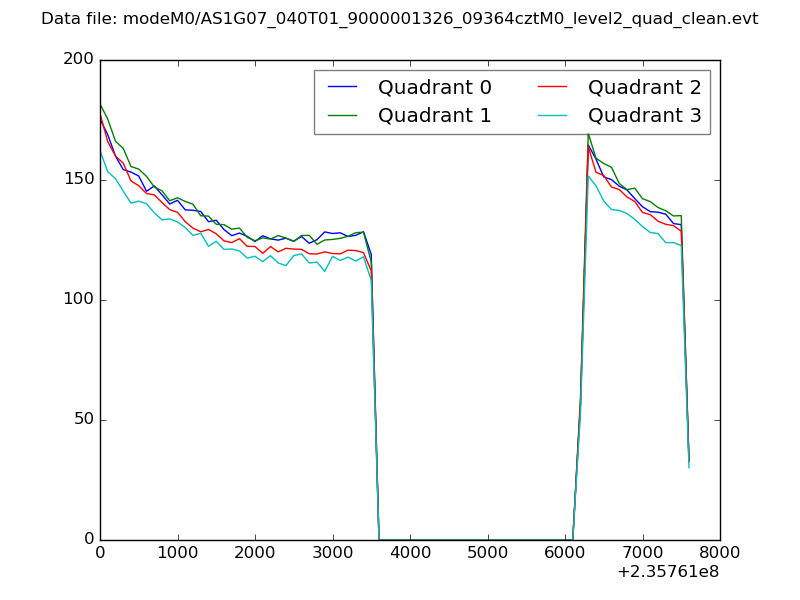 |
|
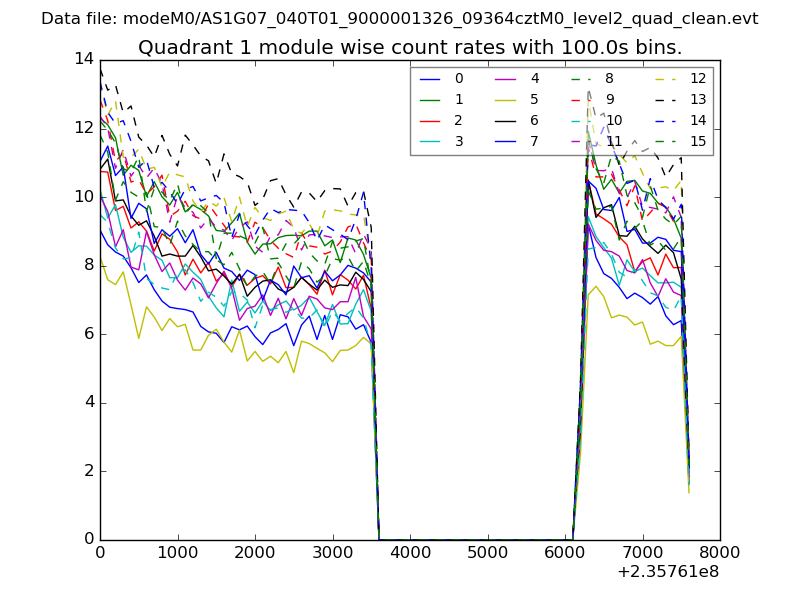
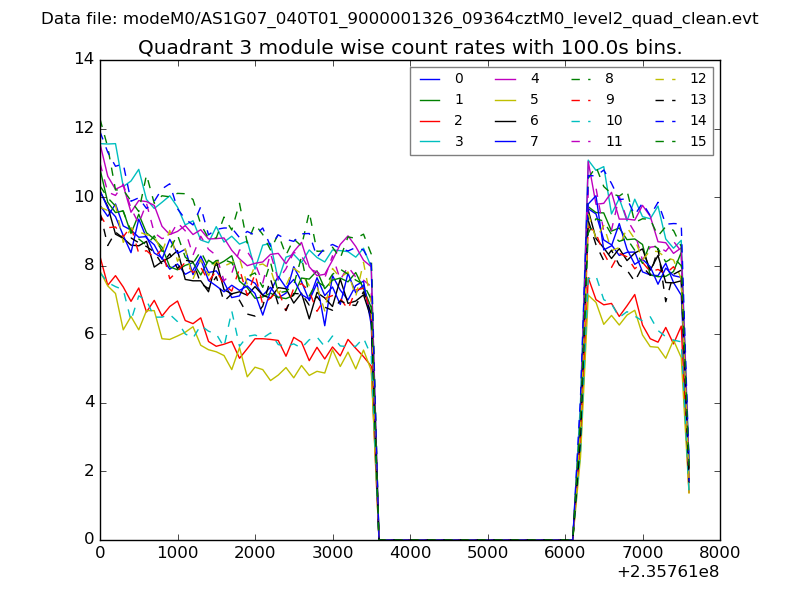
| Module-wise count rates for Quadrant A Data is divided into 100 sec bins |
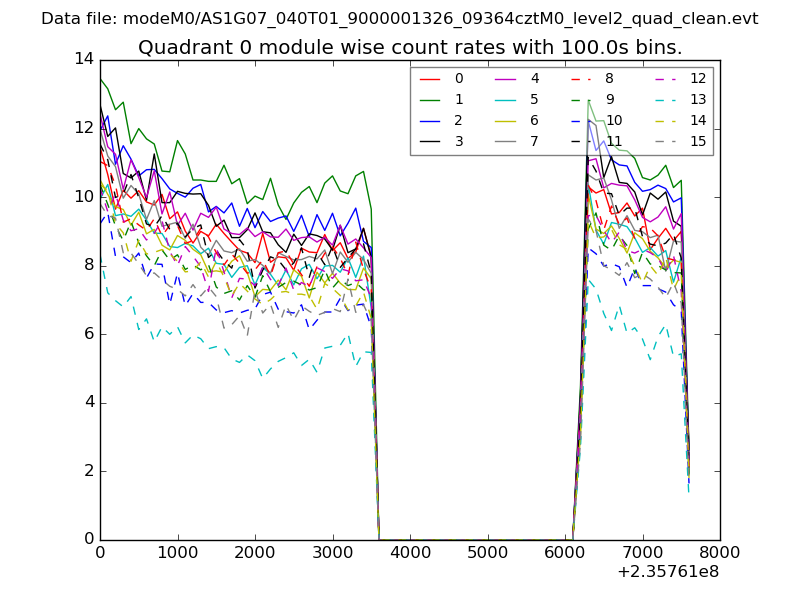 |
 |
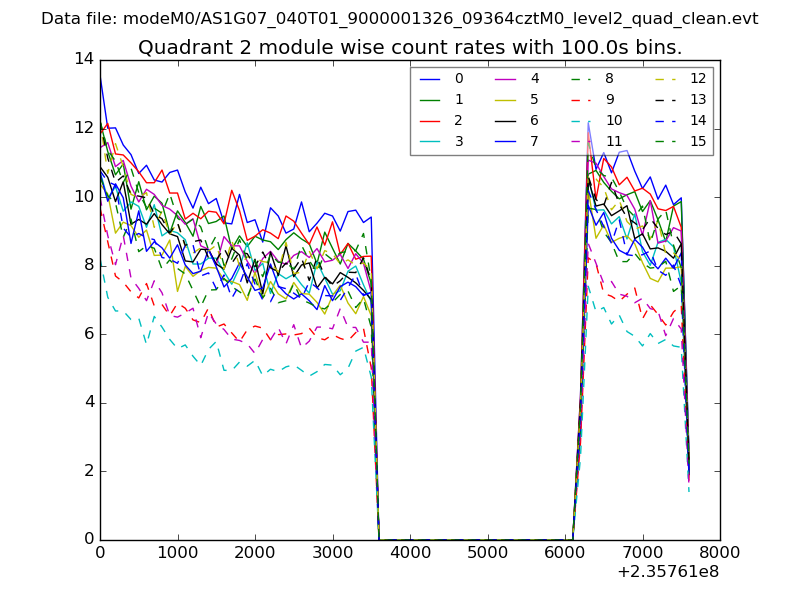
| Module-wise count rates for Quadrant B Data is divided into 100 sec bins |
 |
 |
| Module-wise count rates for Quadrant C Data is divided into 100 sec bins |
 |
 |
| Module-wise count rates for Quadrant D Data is divided into 100 sec bins |
 |
 |
| Parameter | Plot |
|---|---|
| CZT HV Monitor | 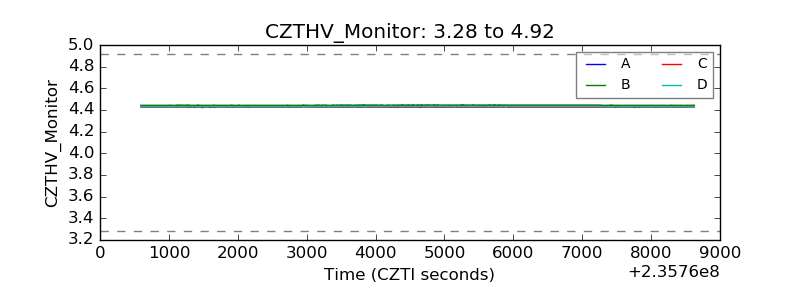 |
| D_VDD | 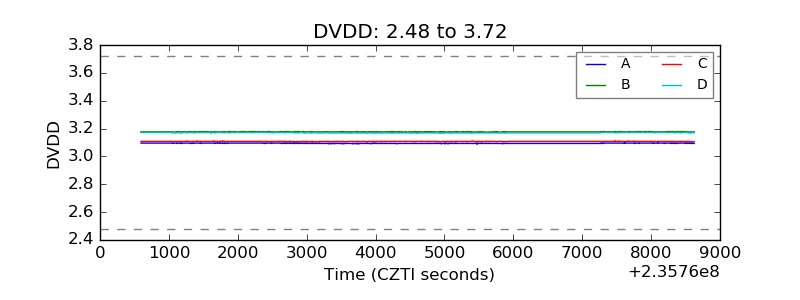 |
| Temperature 1 | 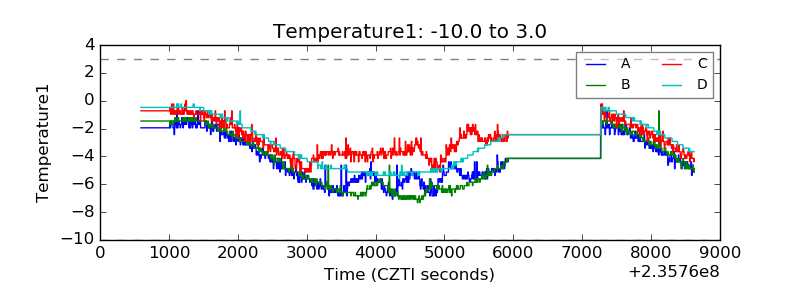 |
| Veto HV Monitor | 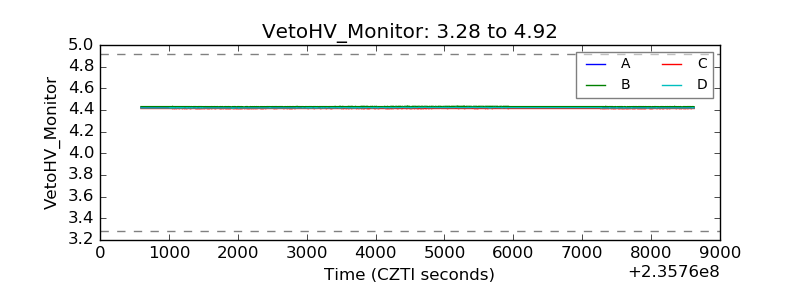 |
| Veto LLD | 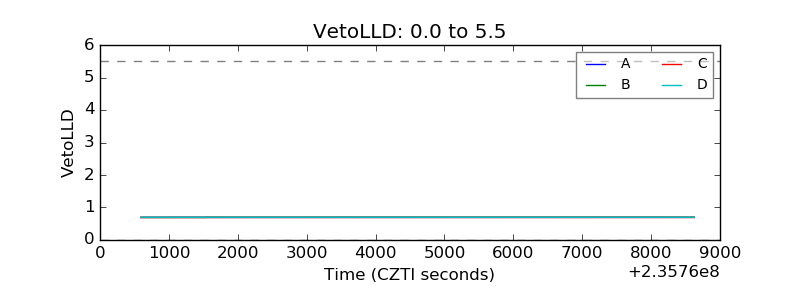 |
| Alpha Counter | 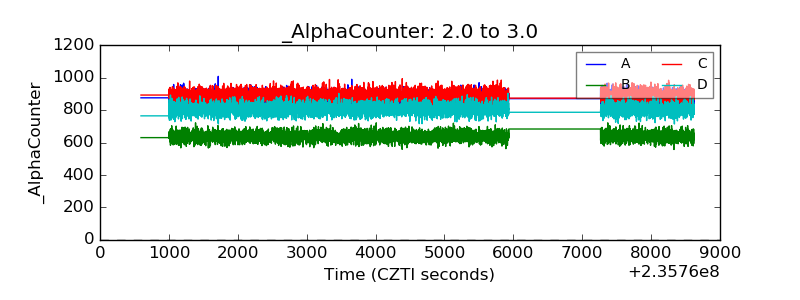 |
| _CPM_Rate |  |
| CZT Counter | 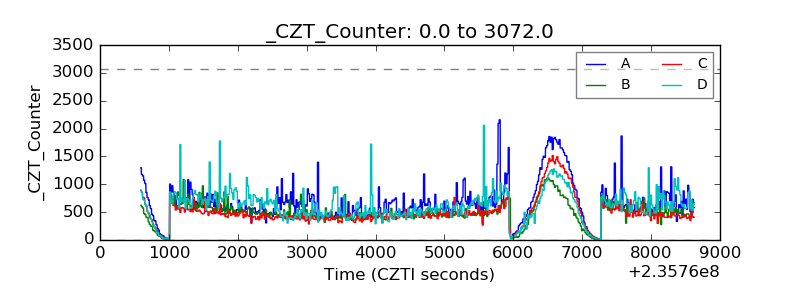 |
| +2.5 Volts monitor | 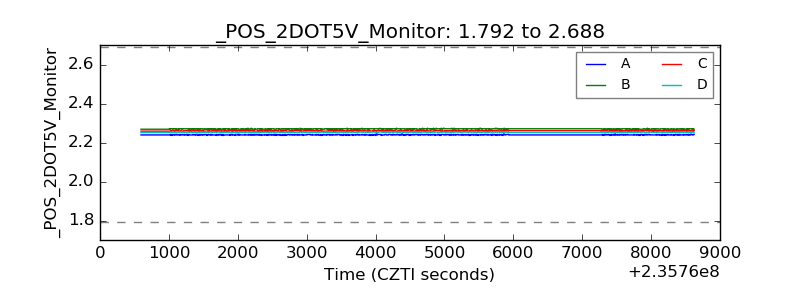 |
| +5 Volts monitor |  |
| _ROLL_ROT | 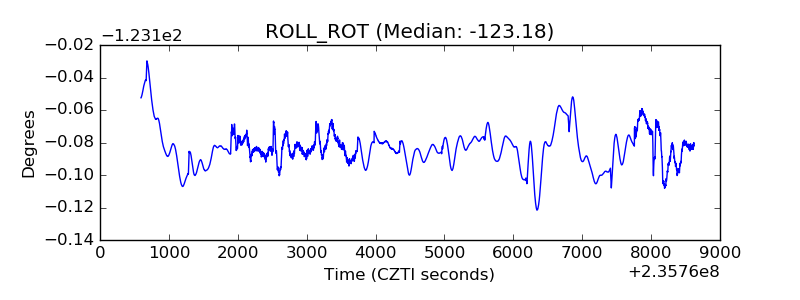 |
| _Roll_DEC | 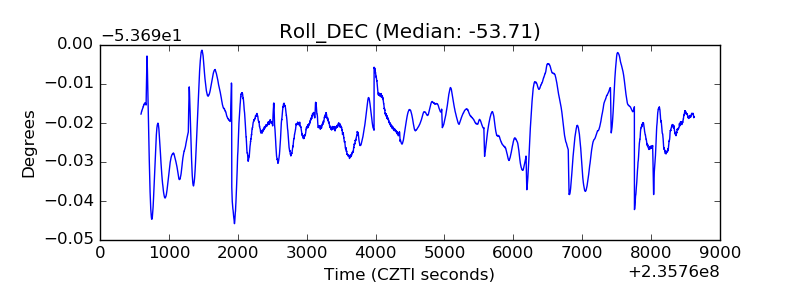 |
| _Roll_RA | 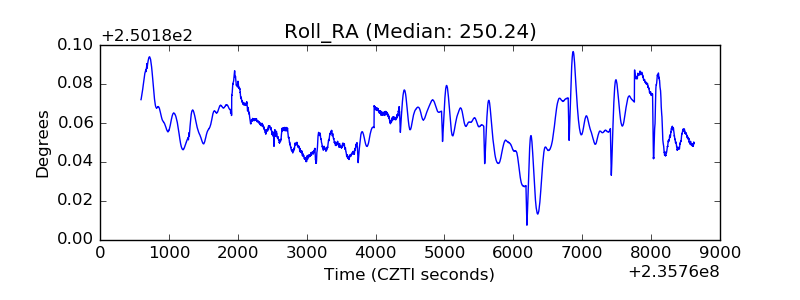 |
| Veto Counter | 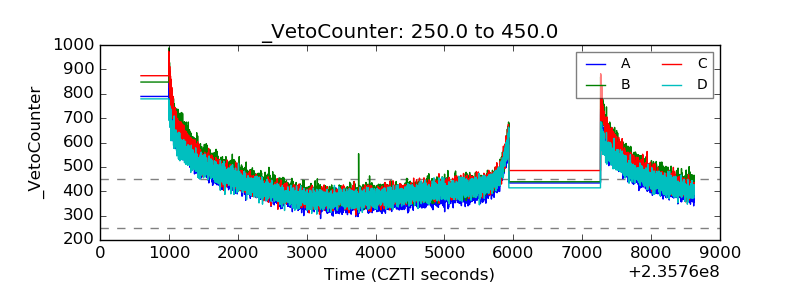 |