| Param | Original file | Final file |
|---|---|---|
| Filename | modeM0/AS1G07_040T01_9000001326_09366cztM0_level2.evt | modeM0/AS1G07_040T01_9000001326_09366cztM0_level2_quad_clean.evt |
| Size (bytes) | 611,363,520 | 89,435,520 |
| Size | 583.0 MB | 85.3 MB |
| Events in quadrant A | 3,649,050 | 596,383 |
| Events in quadrant B | 3,009,115 | 609,348 |
| Events in quadrant C | 2,926,219 | 590,941 |
| Events in quadrant D | 8,505,401 | 472,875 |
| Mode M0 | |||
|---|---|---|---|
| Quadrant | BADHDUFLAG | Total packets | Discarded packets |
| A | 0 | 15055 | 3 |
| B | 0 | 13205 | 2 |
| C | 0 | 13238 | 2 |
| D | 0 | 29620 | 2 |
| Mode M9 | |||
|---|---|---|---|
| Quadrant | BADHDUFLAG | Total packets | Discarded packets |
| A | 0 | 24 | 0 |
| B | 0 | 24 | 0 |
| C | 0 | 24 | 0 |
| D | 0 | 24 | 0 |
| Mode SS | |||
|---|---|---|---|
| Quadrant | BADHDUFLAG | Total packets | Discarded packets |
| A | 0 | 126 | 0 |
| B | 0 | 126 | 0 |
| C | 0 | 126 | 0 |
| D | 0 | 126 | 0 |
| Quadrant | Total seconds | Saturated seconds | Saturation percentage |
|---|---|---|---|
| A | 6285 | 106 | 1.686555% |
| B | 6285 | 36 | 0.572792% |
| C | 6285 | 5 | 0.079554% |
| D | 6285 | 1897 | 30.182975% |
Noise dominated data is calculated using 1-second bins in cleaned event files. If a bin has >2000 counts, and if more than 50% of those come from <1% of pixels, then it is considered to be noise-dominated and hence unusable.
| Quadrant | # 1 sec bins | Bins with >0 counts | Bins with >2000 counts | High rate bins dominated by noise | Noise dominated (total time) | Noise dominated (detector-on time) | Marked lightcurve |
|---|---|---|---|---|---|---|---|
| A | 7485 | 6286 | 33 | 33 | 0.44% | 0.52% |  |
| B | 7485 | 6286 | 0 | 0 | 0.00% | 0.00% | 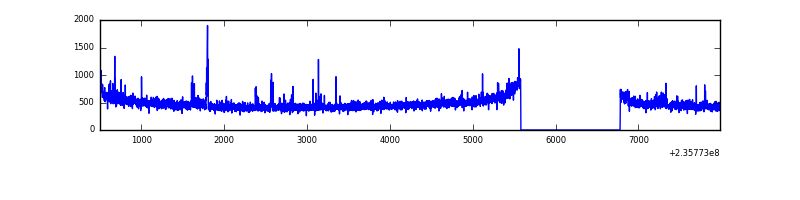 |
| C | 7485 | 6286 | 0 | 0 | 0.00% | 0.00% | 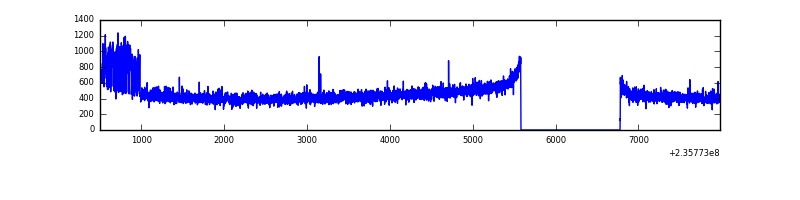 |
| D | 7485 | 6286 | 1777 | 1777 | 23.74% | 28.27% | 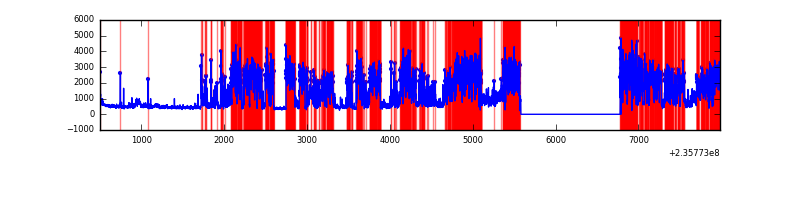 |
Top three noisy pixels from each quadrant. If the there are fewer than three noisy pixels in the level2.evt file, extra rows are filled as -1
| Pixel properties | Quadrant properties | ||||||
|---|---|---|---|---|---|---|---|
| Quadrant | DetID | PixID | Counts | Sigma | Mean | Median | Sigma |
| A | 8 | 5 | 573951 | 3829.53 | 730 | 715 | 149.7 |
| A | 1 | 162 | 112024 | 743.61 | 730 | 715 | 149.7 |
| A | 1 | 178 | 42170 | 276.94 | 730 | 715 | 149.7 |
| B | 0 | 214 | 32733 | 227.86 | 744 | 727 | 140.5 |
| B | 0 | 197 | 25181 | 174.1 | 744 | 727 | 140.5 |
| B | 4 | 173 | 15454 | 104.85 | 744 | 727 | 140.5 |
| C | 9 | 68 | 150365 | 906.42 | 711 | 714 | 165.1 |
| C | 13 | 61 | 5422 | 28.52 | 711 | 714 | 165.1 |
| C | 8 | 222 | 2342 | 9.86 | 711 | 714 | 165.1 |
| D | 12 | 227 | 5336740 | 34561.28 | 598 | 585 | 154.4 |
| D | 1 | 52 | 560466 | 3626.24 | 598 | 585 | 154.4 |
| D | 8 | 195 | 174831 | 1128.56 | 598 | 585 | 154.4 |
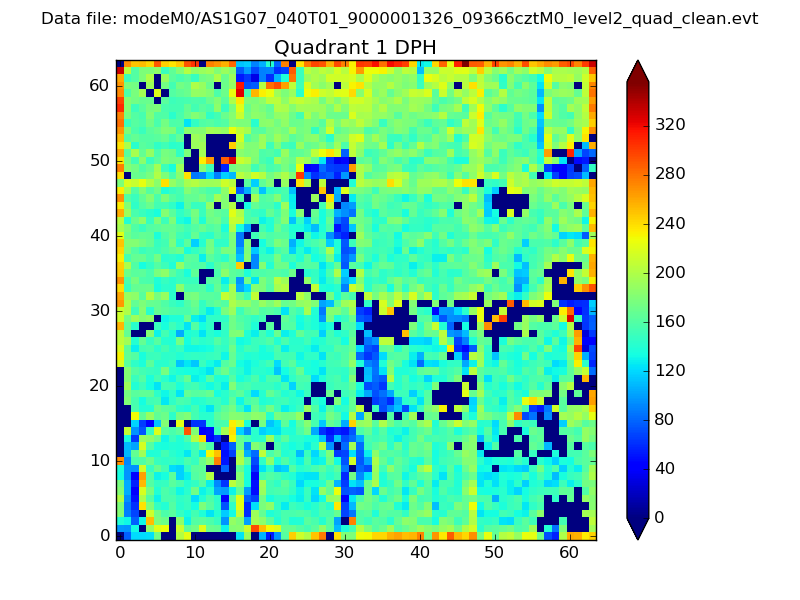
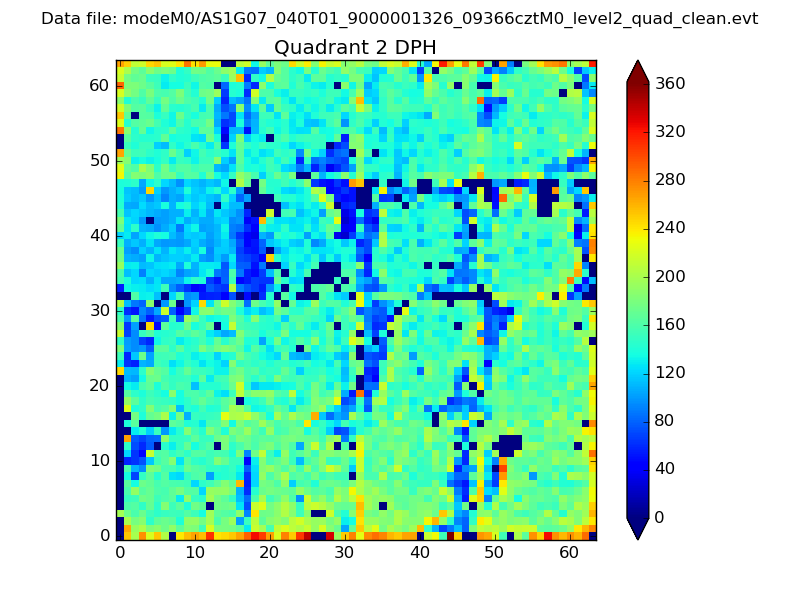
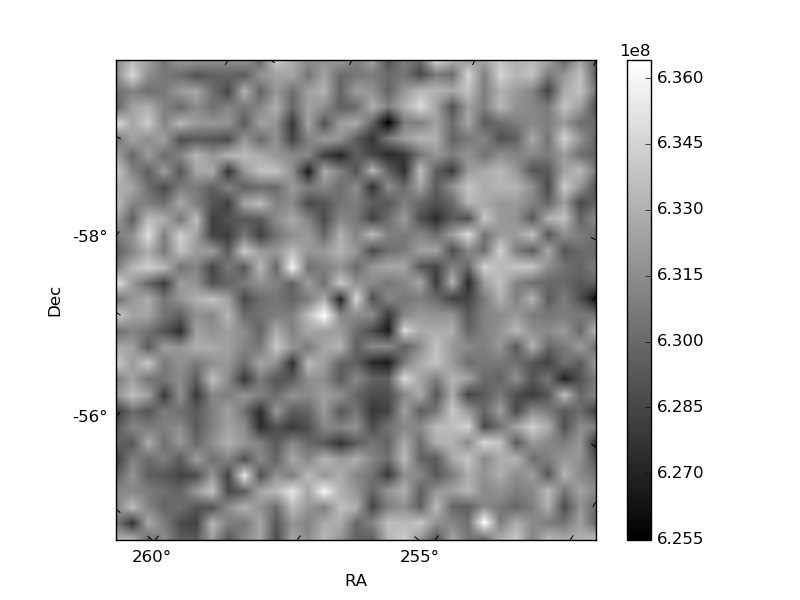
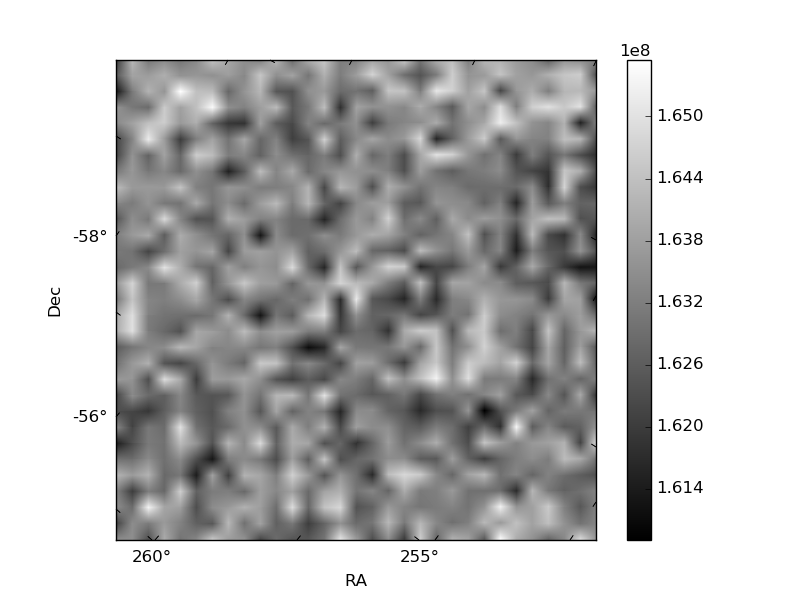
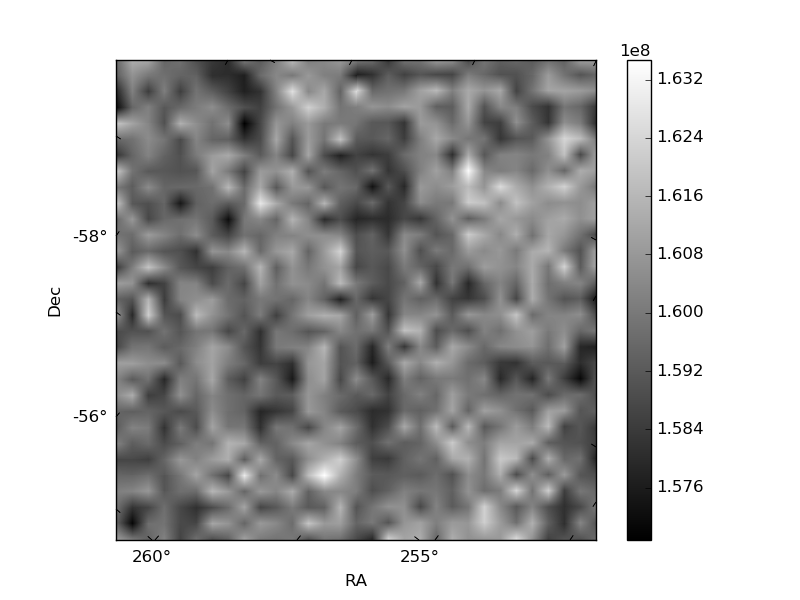
Histogram calculated using DETX and DETY for each event in the final _common_clean file
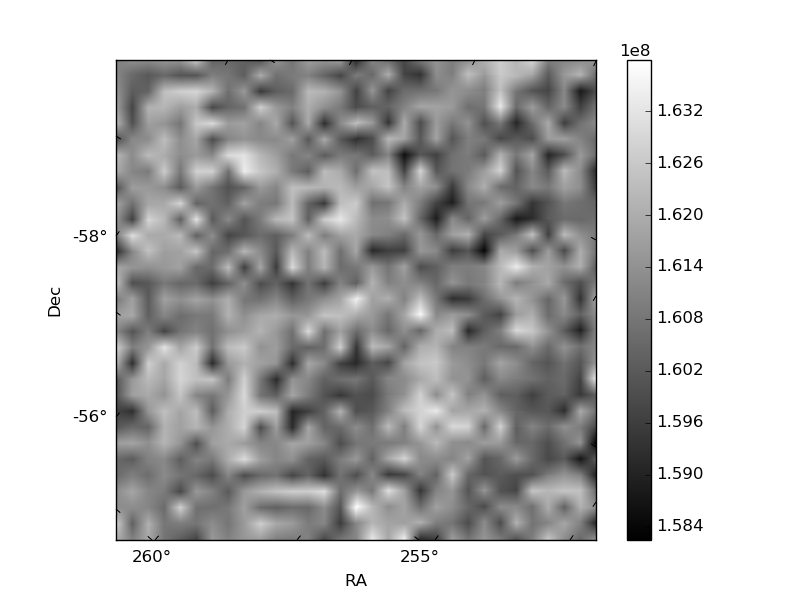
| Quadrant A | 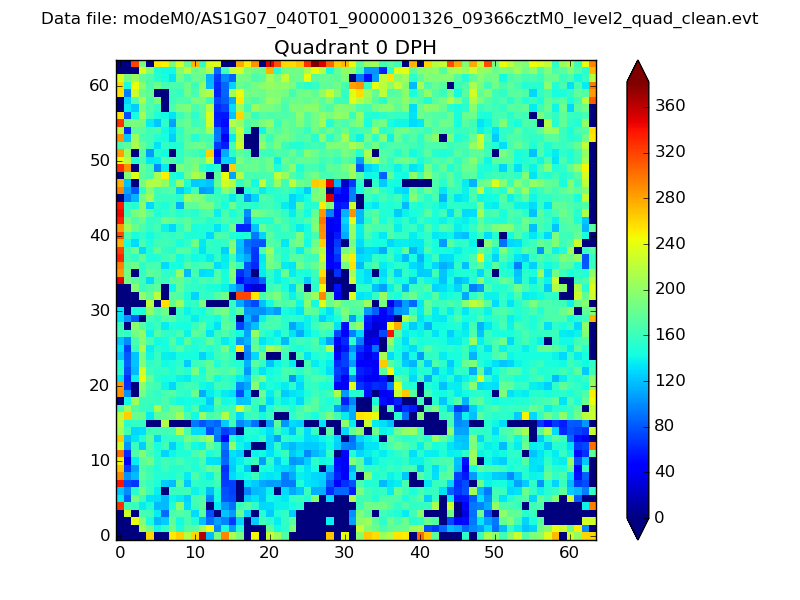 |
 |
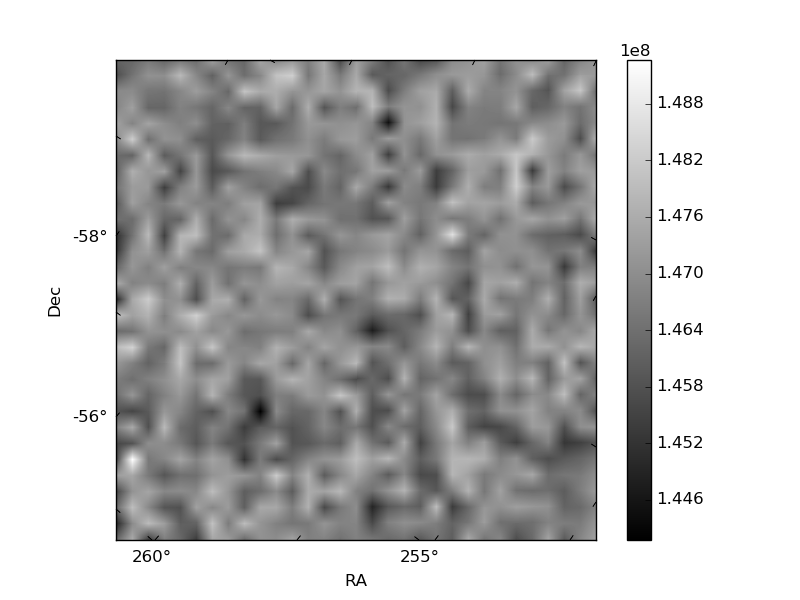
Quadrant B |
|---|---|---|---|
| Quadrant D | 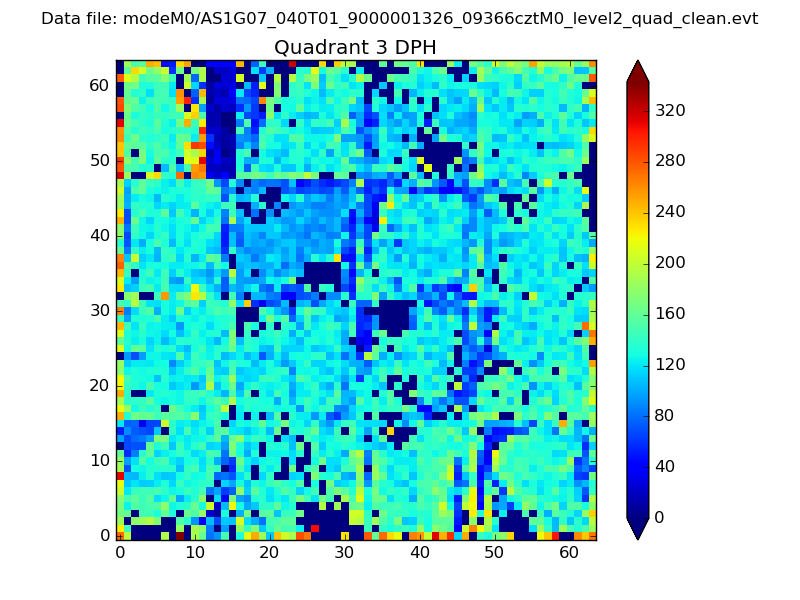 |
 |
Quadrant C |
| Plot type | Count rate plots | Images |
|---|---|---|
| Comparison with Poisson distribution Blue bars denote a histogram of data divided into 1 sec bins. Red curve is a Poisson curve with rate = median count rate of data. |
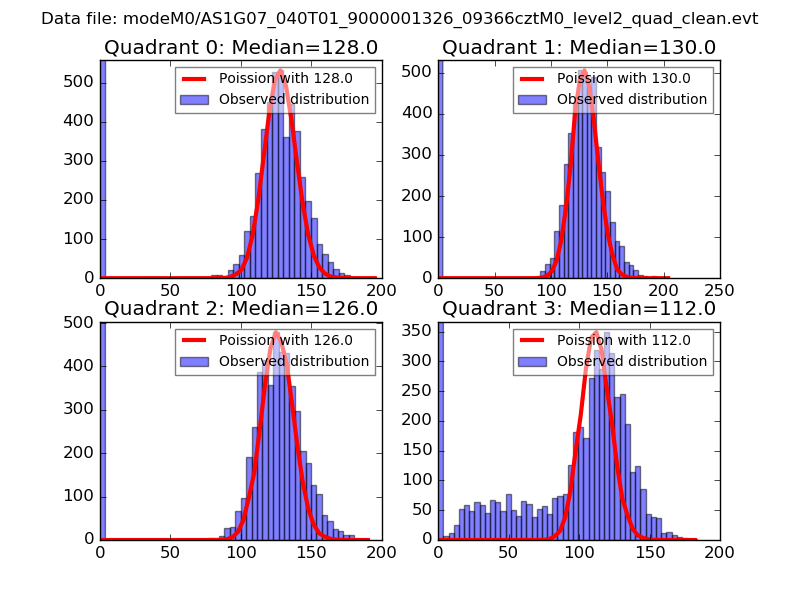 |
 |
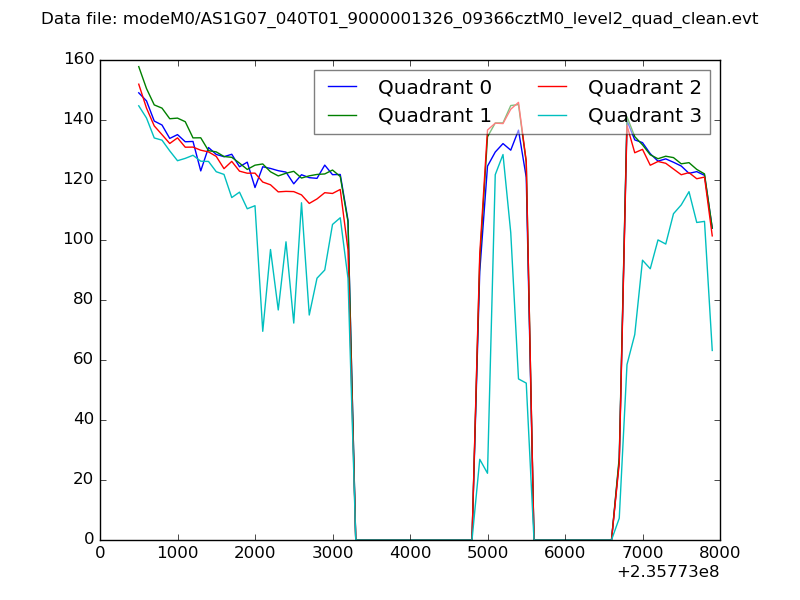
| Quadrant-wise count rates Data is divided into 100 sec bins |
 |
|
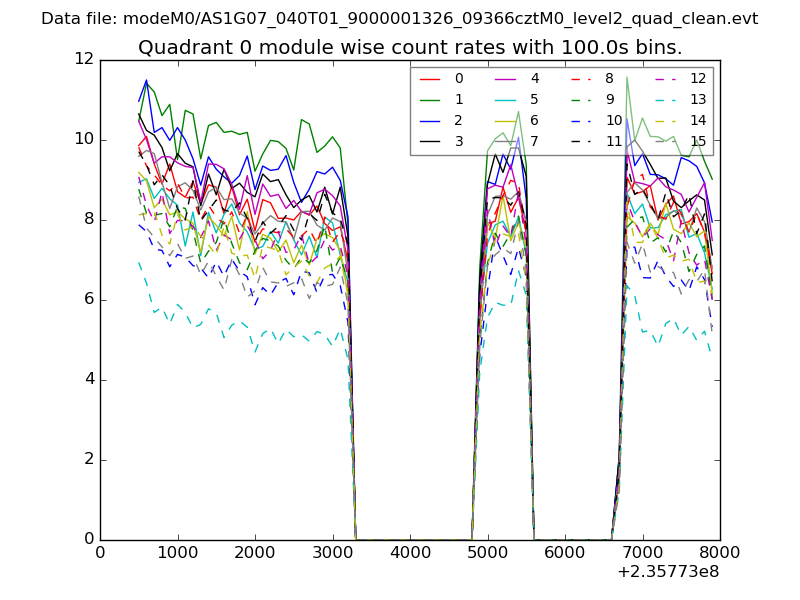
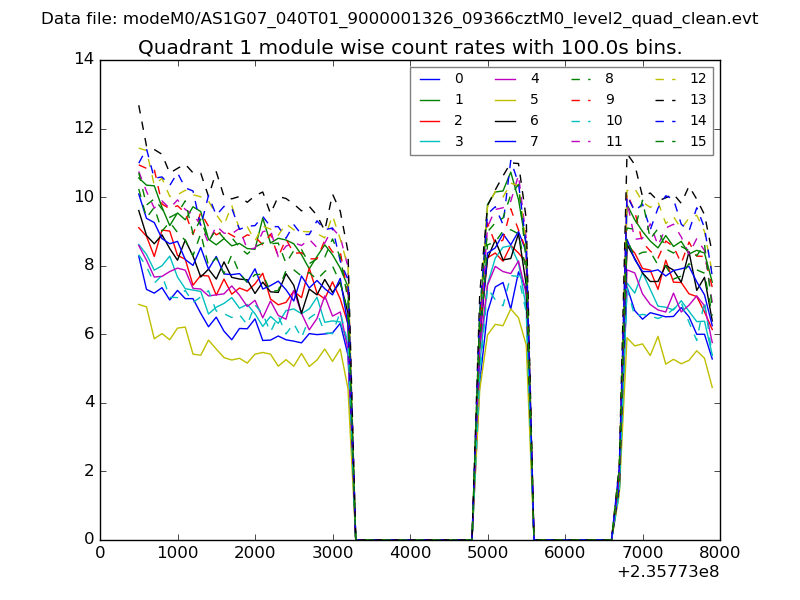
| Module-wise count rates for Quadrant A Data is divided into 100 sec bins |
 |
 |
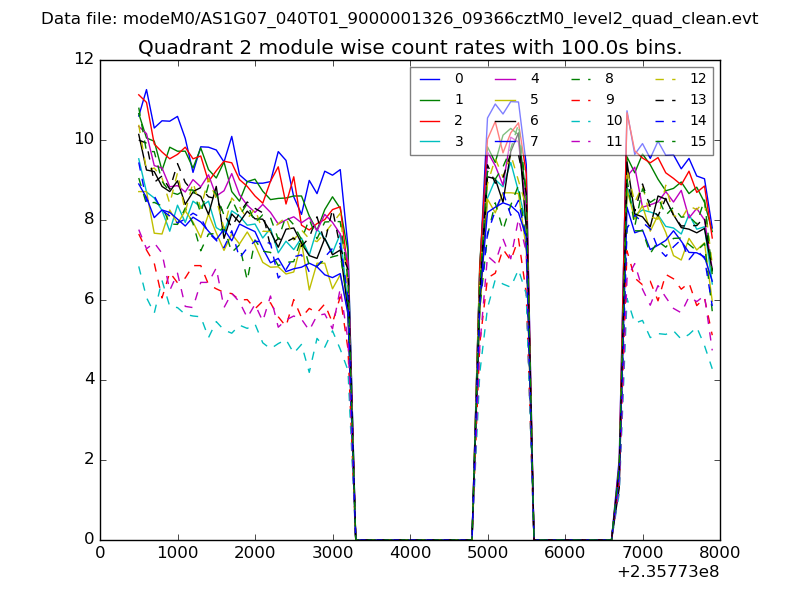
| Module-wise count rates for Quadrant B Data is divided into 100 sec bins |
 |
 |
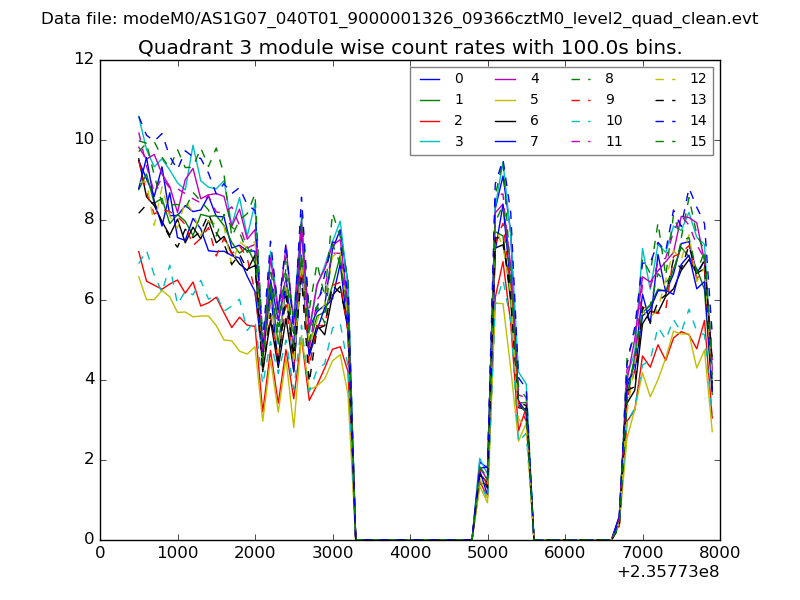
| Module-wise count rates for Quadrant C Data is divided into 100 sec bins |
 |
 |
| Module-wise count rates for Quadrant D Data is divided into 100 sec bins |
 |
 |
| Parameter | Plot |
|---|---|
| CZT HV Monitor | 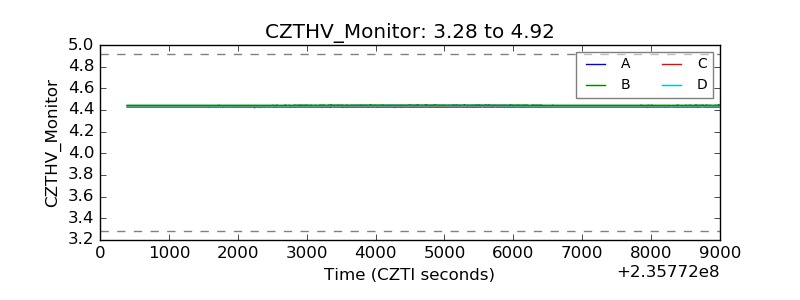 |
| D_VDD | 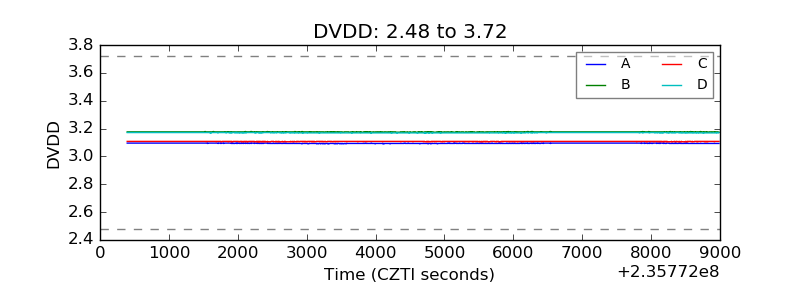 |
| Temperature 1 | 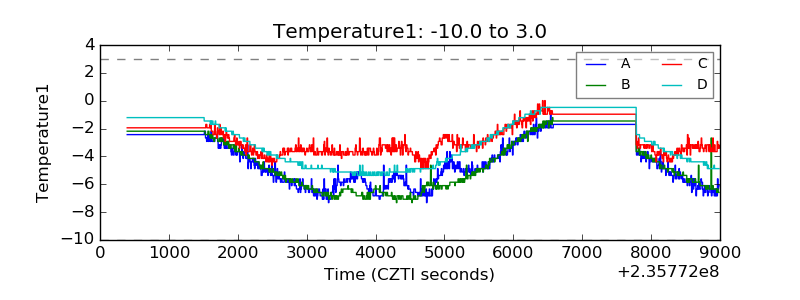 |
| Veto HV Monitor | 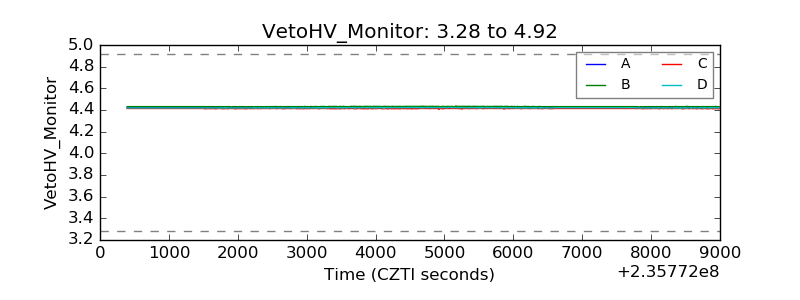 |
| Veto LLD | 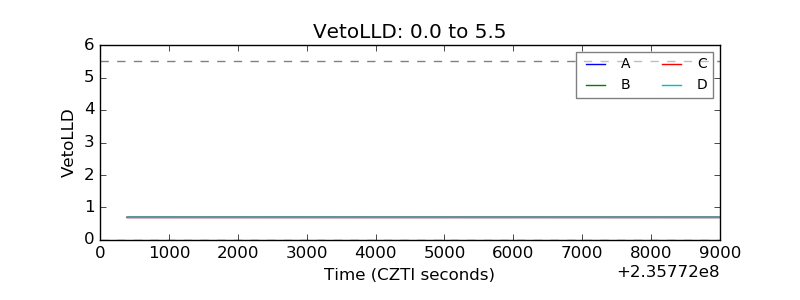 |
| Alpha Counter | 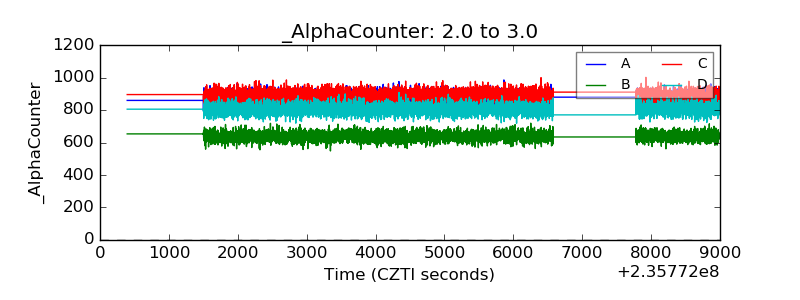 |
| _CPM_Rate | 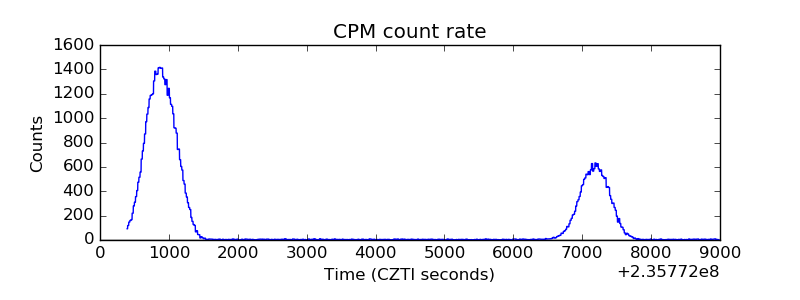 |
| CZT Counter | 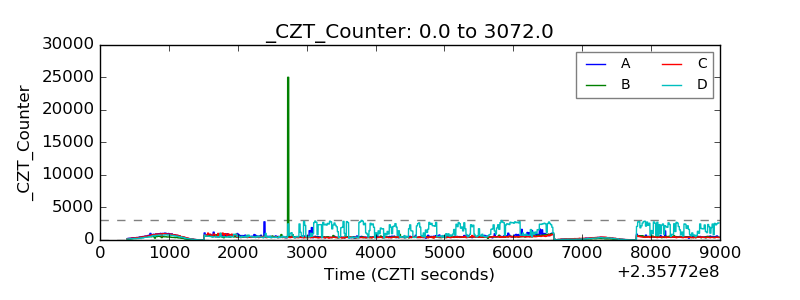 |
| +2.5 Volts monitor | 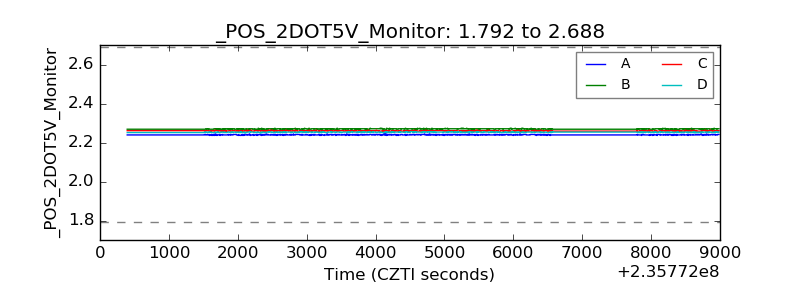 |
| +5 Volts monitor |  |
| _ROLL_ROT | 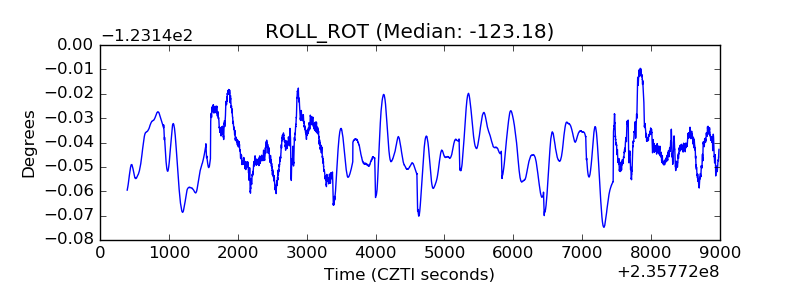 |
| _Roll_DEC | 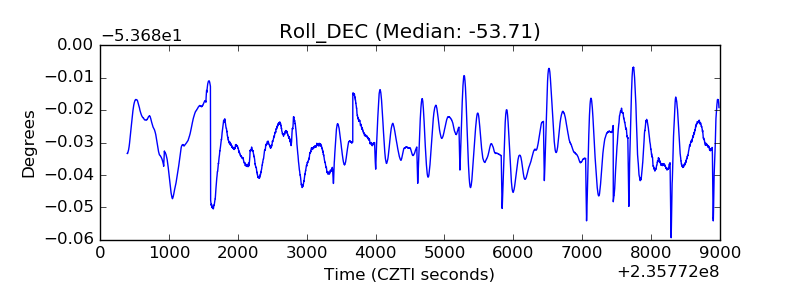 |
| _Roll_RA | 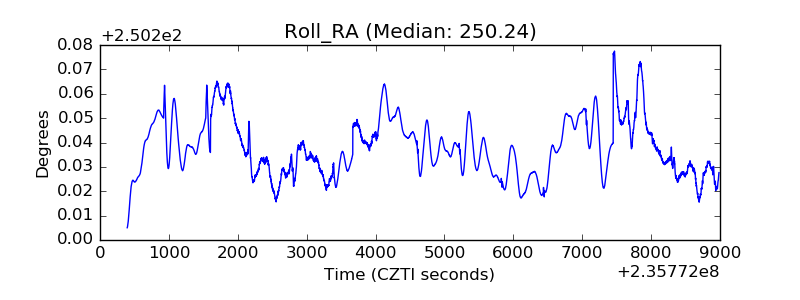 |
| Veto Counter | 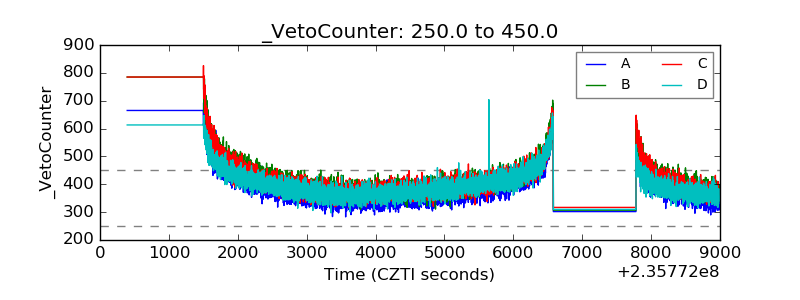 |