| Param | Original file | Final file |
|---|---|---|
| Filename | modeM0/AS1G07_040T01_9000001326_09367cztM0_level2.evt | modeM0/AS1G07_040T01_9000001326_09367cztM0_level2_quad_clean.evt |
| Size (bytes) | 647,115,840 | 101,283,840 |
| Size | 617.1 MB | 96.6 MB |
| Events in quadrant A | 4,305,787 | 665,176 |
| Events in quadrant B | 3,301,794 | 682,922 |
| Events in quadrant C | 3,086,547 | 665,092 |
| Events in quadrant D | 8,426,459 | 562,615 |
| Mode M0 | |||
|---|---|---|---|
| Quadrant | BADHDUFLAG | Total packets | Discarded packets |
| A | 0 | 17350 | 3 |
| B | 0 | 14764 | 2 |
| C | 0 | 14383 | 2 |
| D | 0 | 30014 | 2 |
| Mode M9 | |||
|---|---|---|---|
| Quadrant | BADHDUFLAG | Total packets | Discarded packets |
| A | 0 | 21 | 0 |
| B | 0 | 21 | 0 |
| C | 0 | 21 | 0 |
| D | 0 | 21 | 0 |
| Mode SS | |||
|---|---|---|---|
| Quadrant | BADHDUFLAG | Total packets | Discarded packets |
| A | 0 | 144 | 0 |
| B | 0 | 144 | 0 |
| C | 0 | 144 | 0 |
| D | 0 | 144 | 0 |
| Quadrant | Total seconds | Saturated seconds | Saturation percentage |
|---|---|---|---|
| A | 7054 | 159 | 2.254040% |
| B | 7054 | 55 | 0.779699% |
| C | 7054 | 15 | 0.212645% |
| D | 7054 | 1393 | 19.747661% |
Noise dominated data is calculated using 1-second bins in cleaned event files. If a bin has >2000 counts, and if more than 50% of those come from <1% of pixels, then it is considered to be noise-dominated and hence unusable.
| Quadrant | # 1 sec bins | Bins with >0 counts | Bins with >2000 counts | High rate bins dominated by noise | Noise dominated (total time) | Noise dominated (detector-on time) | Marked lightcurve |
|---|---|---|---|---|---|---|---|
| A | 9139 | 7056 | 62 | 62 | 0.68% | 0.88% | 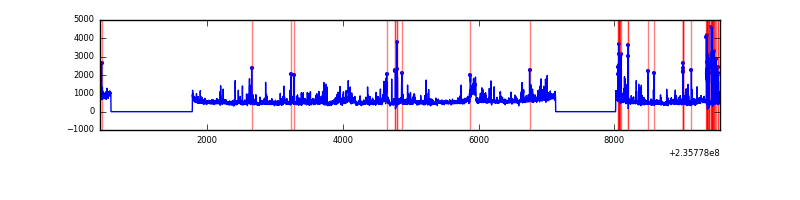 |
| B | 9139 | 7056 | 3 | 3 | 0.03% | 0.04% | 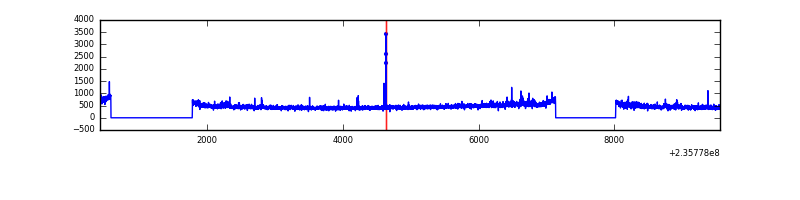 |
| C | 9139 | 7056 | 0 | 0 | 0.00% | 0.00% | 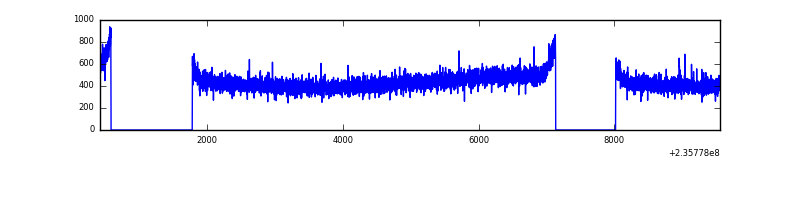 |
| D | 9139 | 7056 | 1250 | 1250 | 13.68% | 17.72% | 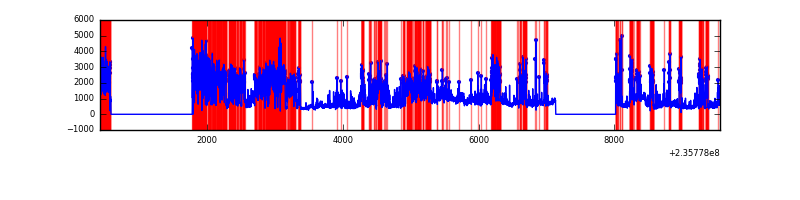 |
Top three noisy pixels from each quadrant. If the there are fewer than three noisy pixels in the level2.evt file, extra rows are filled as -1
| Pixel properties | Quadrant properties | ||||||
|---|---|---|---|---|---|---|---|
| Quadrant | DetID | PixID | Counts | Sigma | Mean | Median | Sigma |
| A | 8 | 5 | 1039153 | 6288.19 | 803 | 785 | 165.1 |
| A | 1 | 162 | 62418 | 373.24 | 803 | 785 | 165.1 |
| A | 13 | 251 | 32917 | 194.59 | 803 | 785 | 165.1 |
| B | 0 | 214 | 69047 | 433.95 | 821 | 799 | 157.3 |
| B | 12 | 111 | 16856 | 102.1 | 821 | 799 | 157.3 |
| B | 4 | 173 | 14292 | 85.79 | 821 | 799 | 157.3 |
| C | 13 | 61 | 5930 | 28.03 | 789 | 792 | 183.3 |
| C | 8 | 222 | 3998 | 17.49 | 789 | 792 | 183.3 |
| C | 14 | 67 | 3182 | 13.04 | 789 | 792 | 183.3 |
| D | 12 | 227 | 3019084 | 16225.26 | 710 | 692 | 186.0 |
| D | 1 | 52 | 1437623 | 7724.17 | 710 | 692 | 186.0 |
| D | 8 | 195 | 874145 | 4695.22 | 710 | 692 | 186.0 |
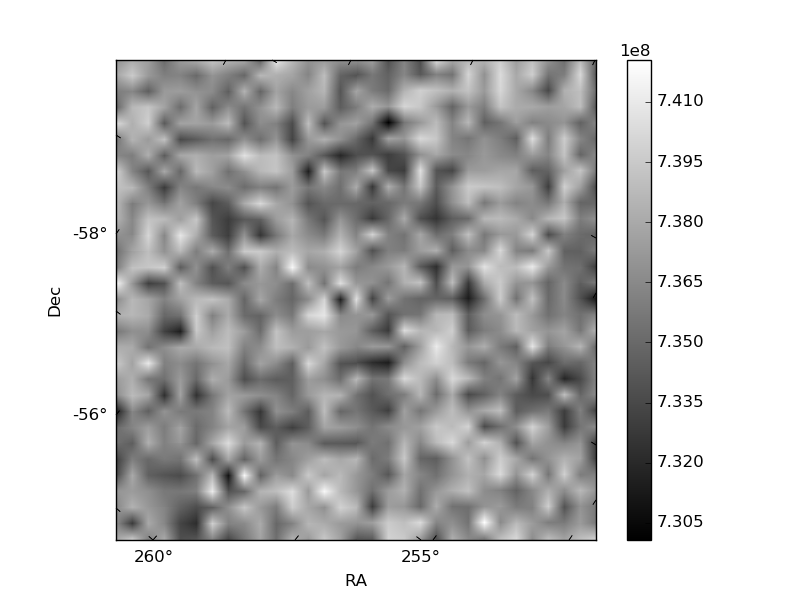
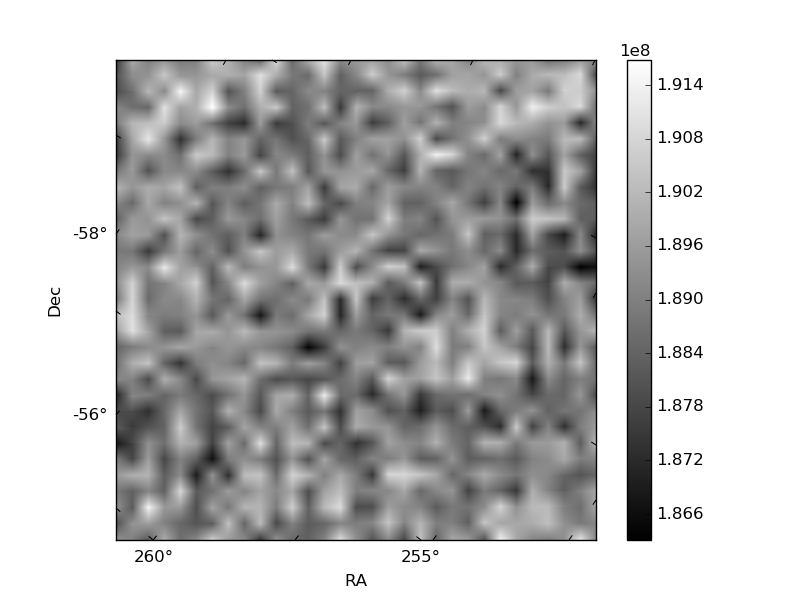
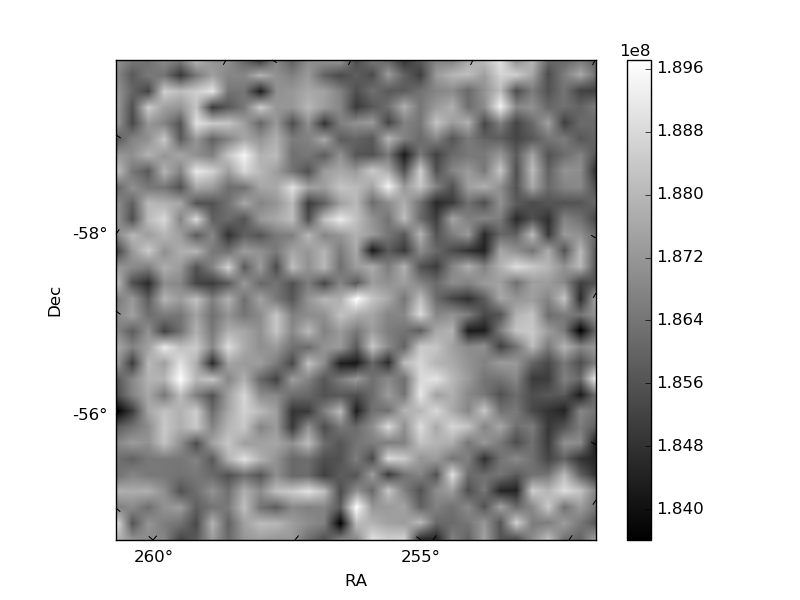
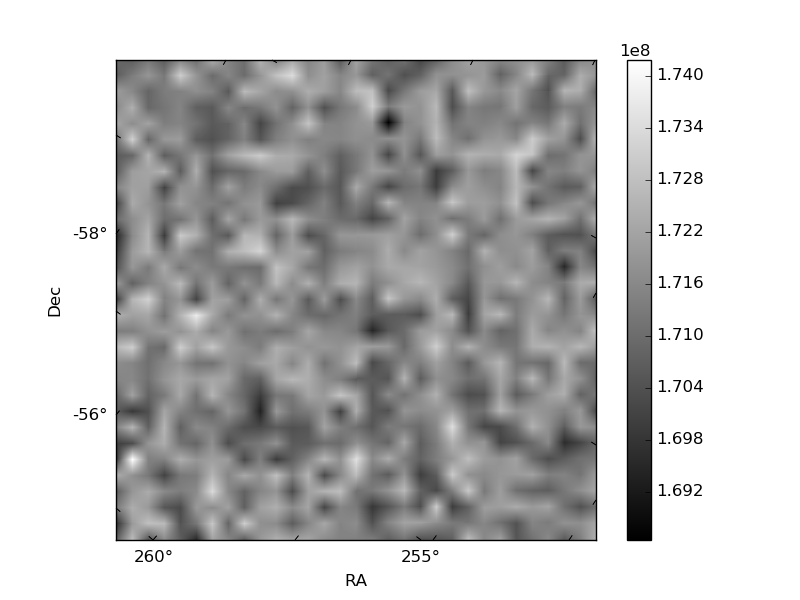
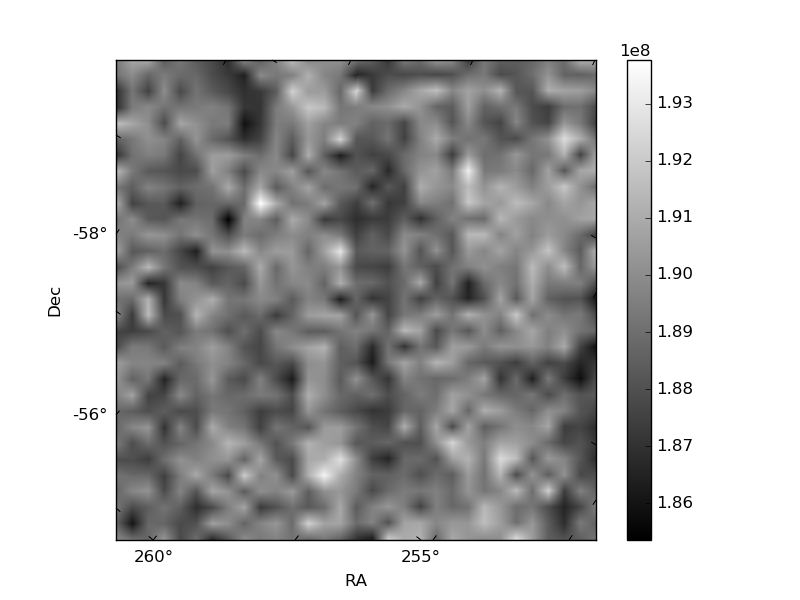
Histogram calculated using DETX and DETY for each event in the final _common_clean file
| Quadrant A | 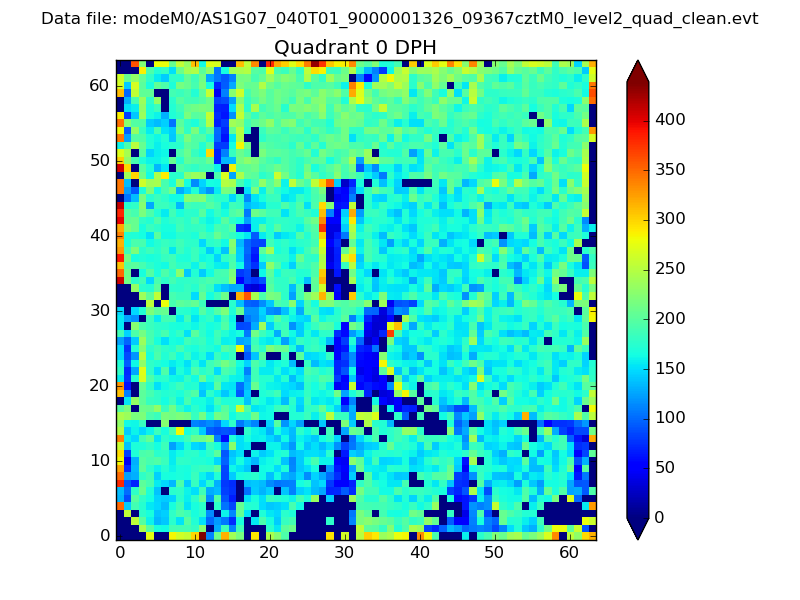 |
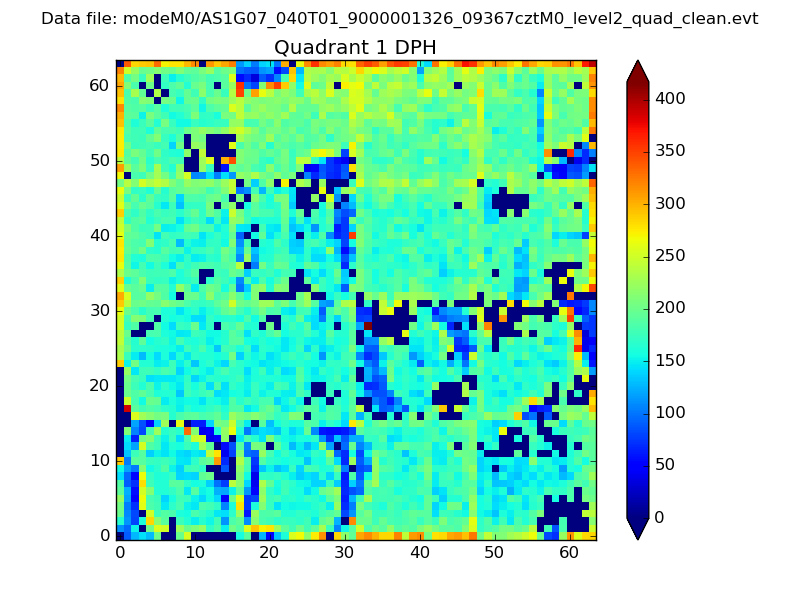 |
Quadrant B |
|---|---|---|---|
| Quadrant D | 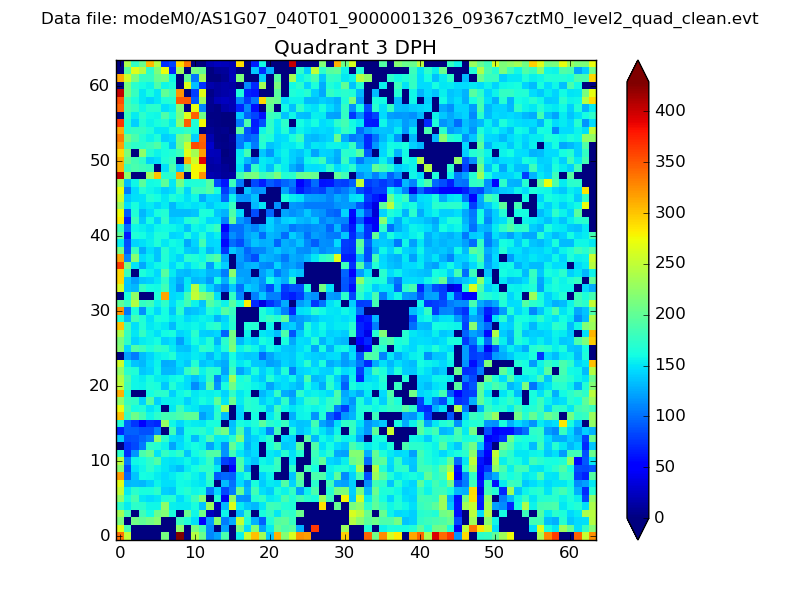 |
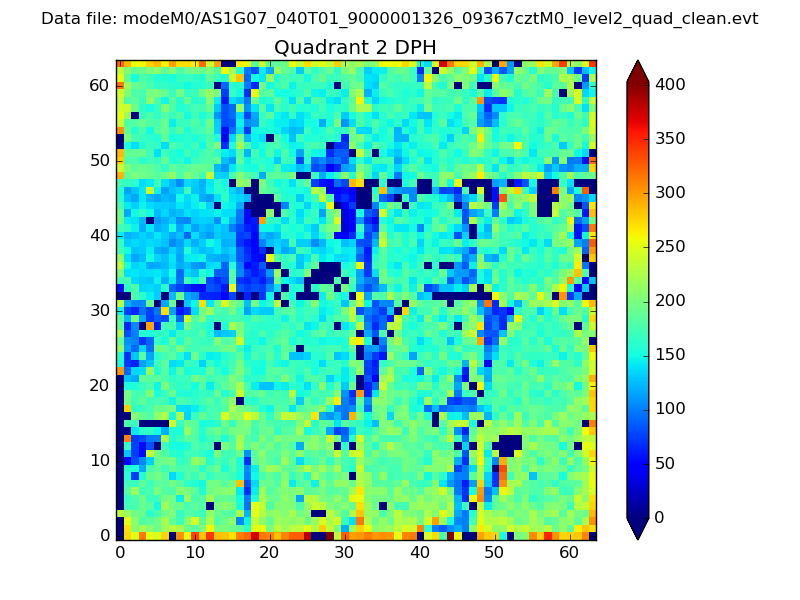 |
Quadrant C |
| Plot type | Count rate plots | Images |
|---|---|---|
| Comparison with Poisson distribution Blue bars denote a histogram of data divided into 1 sec bins. Red curve is a Poisson curve with rate = median count rate of data. |
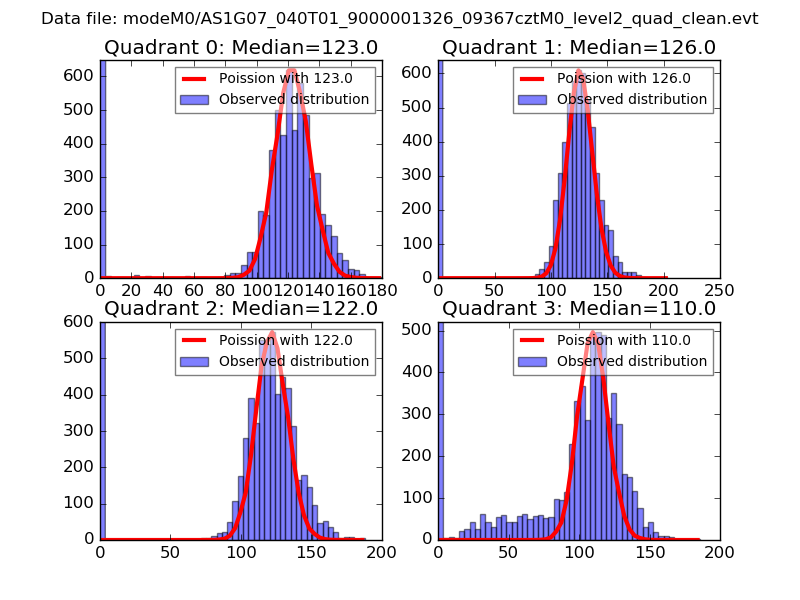 |
 |
| Quadrant-wise count rates Data is divided into 100 sec bins |
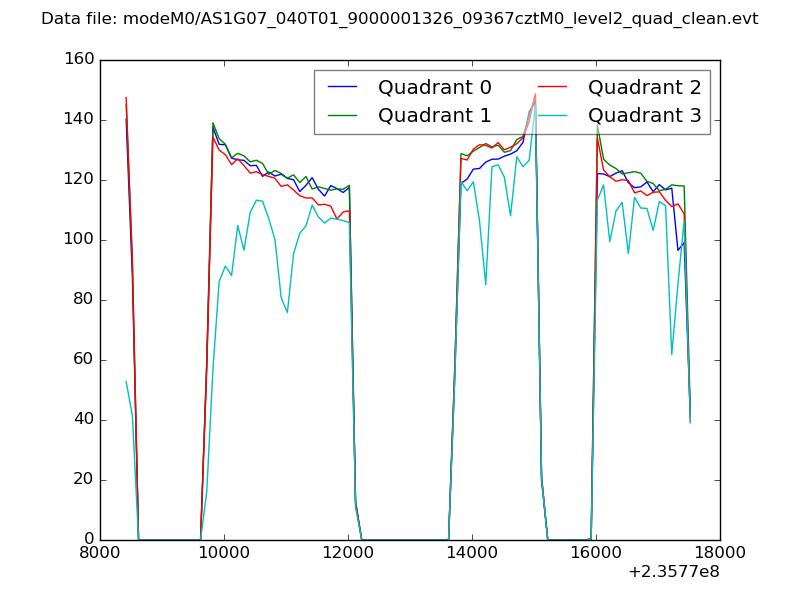 |
|
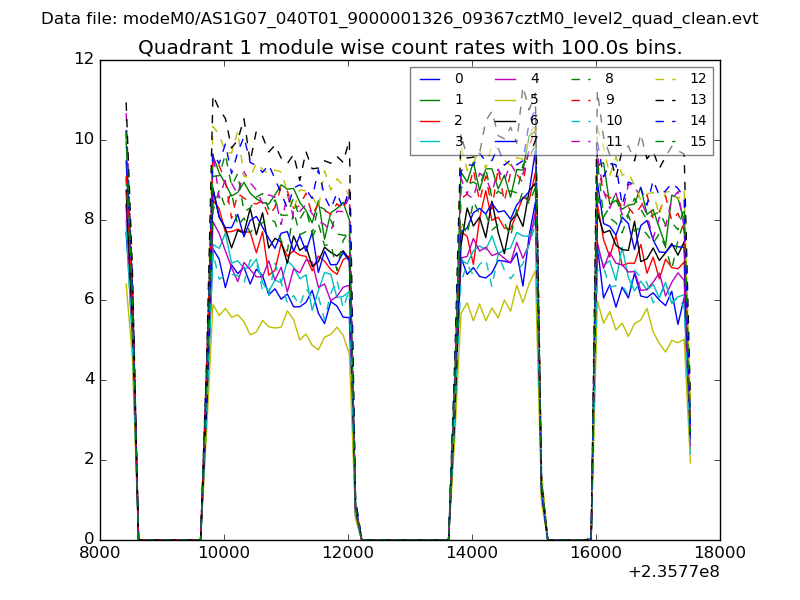
| Module-wise count rates for Quadrant A Data is divided into 100 sec bins |
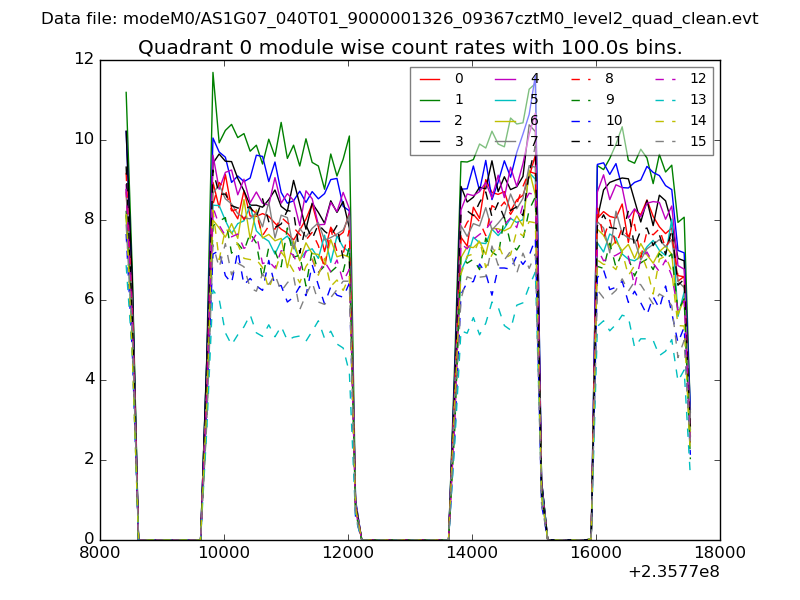 |
 |
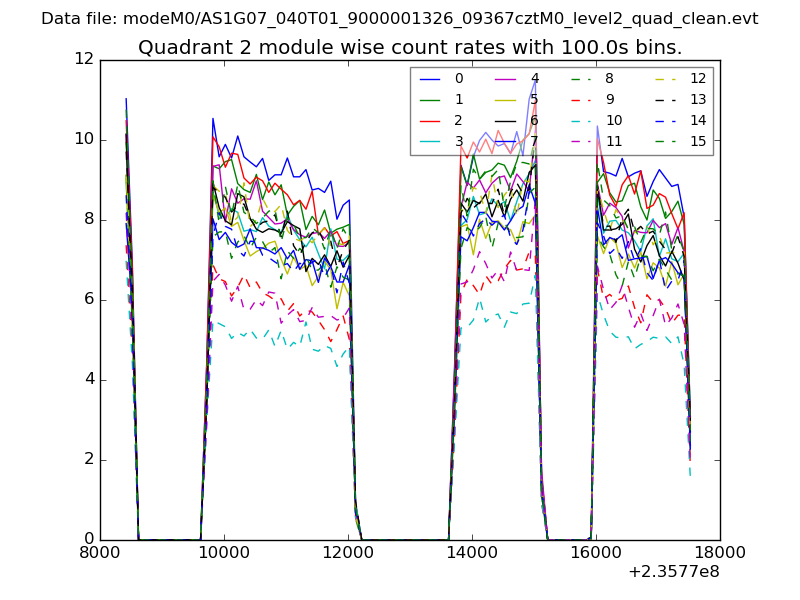
| Module-wise count rates for Quadrant B Data is divided into 100 sec bins |
 |
 |
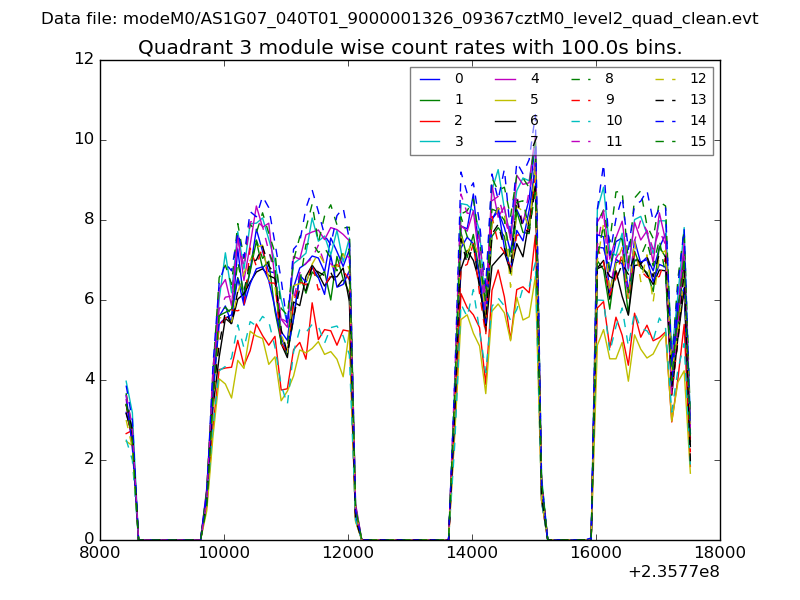
| Module-wise count rates for Quadrant C Data is divided into 100 sec bins |
 |
 |
| Module-wise count rates for Quadrant D Data is divided into 100 sec bins |
 |
 |
| Parameter | Plot |
|---|---|
| CZT HV Monitor | 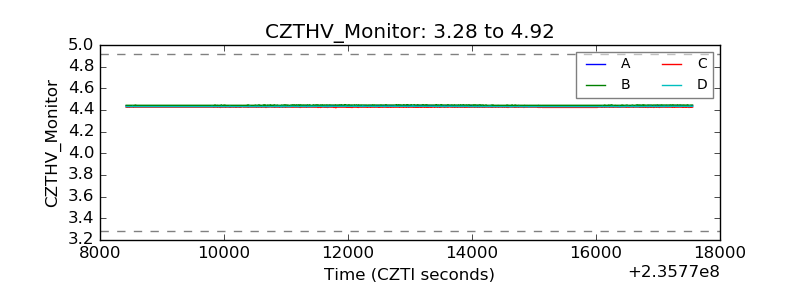 |
| D_VDD | 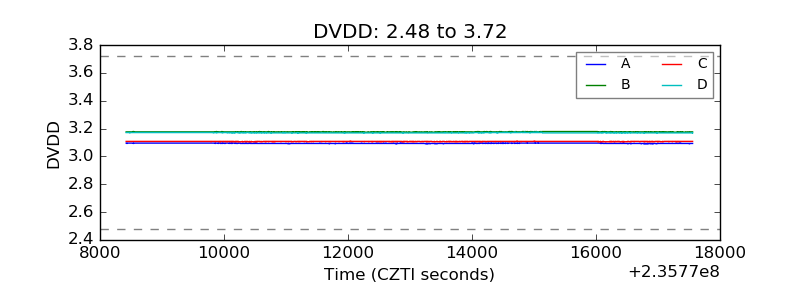 |
| Temperature 1 | 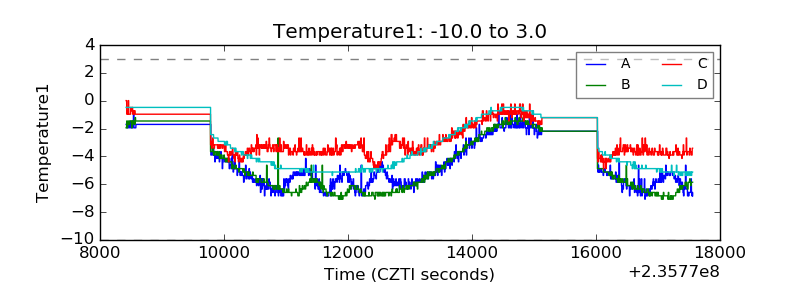 |
| Veto HV Monitor | 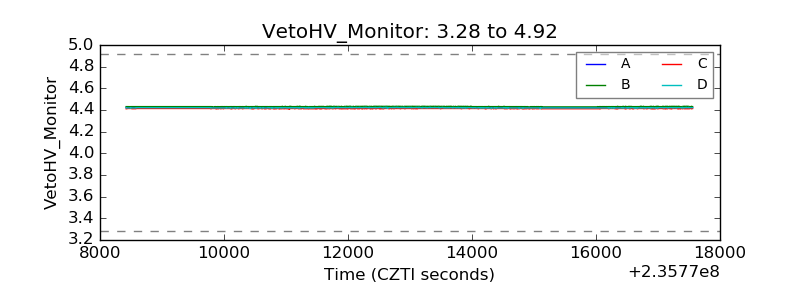 |
| Veto LLD | 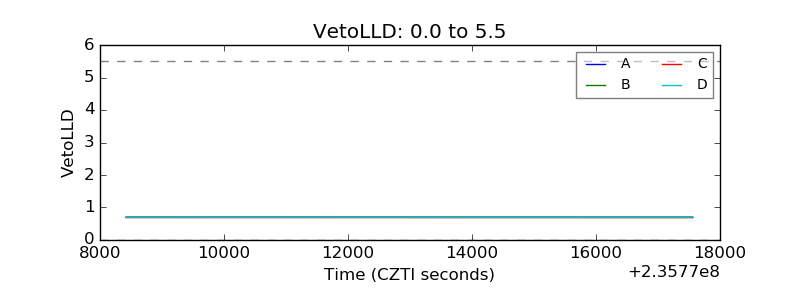 |
| Alpha Counter | 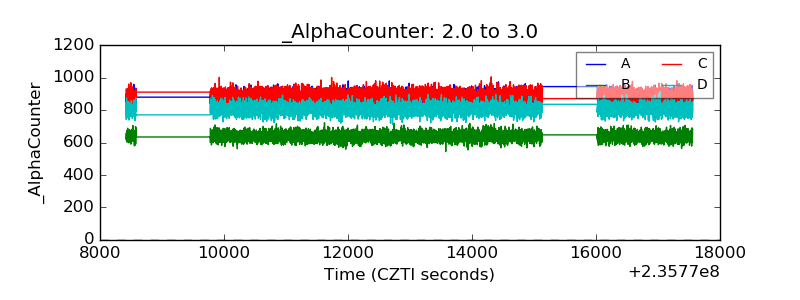 |
| _CPM_Rate | 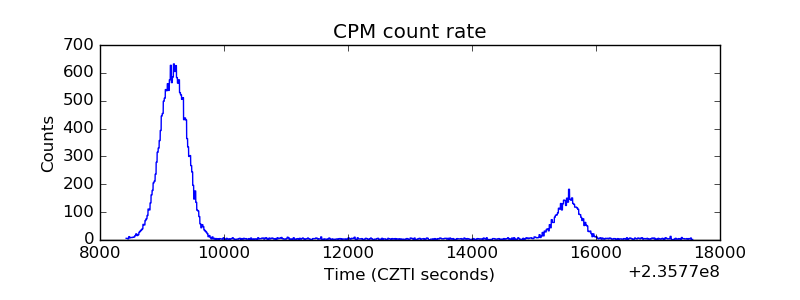 |
| CZT Counter | 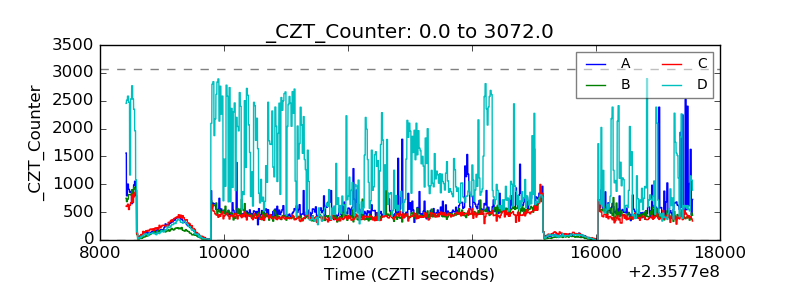 |
| +2.5 Volts monitor |  |
| +5 Volts monitor |  |
| _ROLL_ROT | 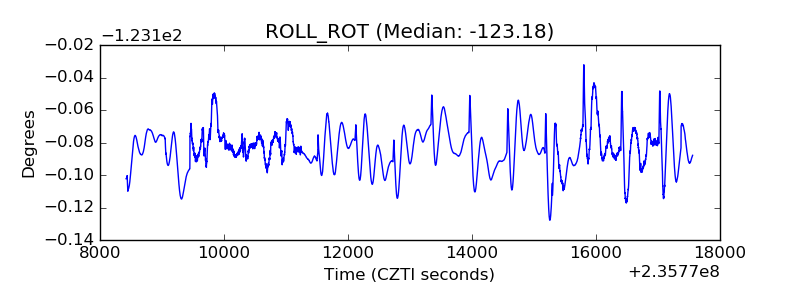 |
| _Roll_DEC | 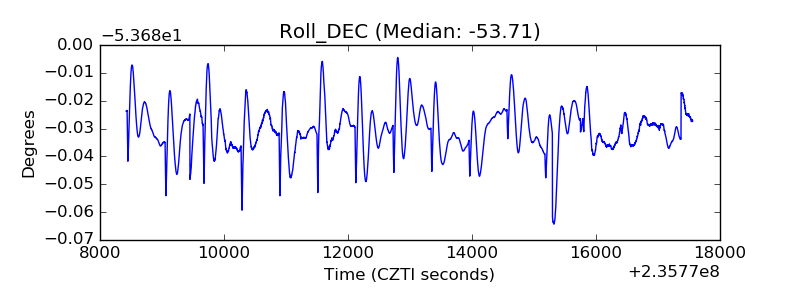 |
| _Roll_RA | 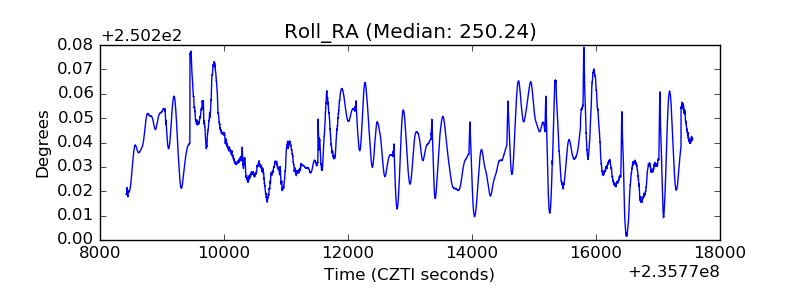 |
| Veto Counter | 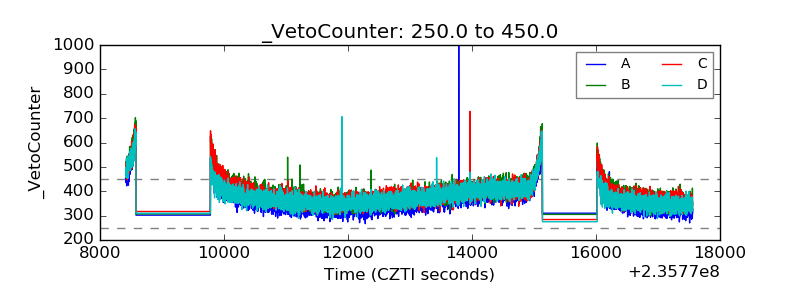 |