| Param | Original file | Final file |
|---|---|---|
| Filename | modeM0/AS1G07_040T01_9000001326_09368cztM0_level2.evt | modeM0/AS1G07_040T01_9000001326_09368cztM0_level2_quad_clean.evt |
| Size (bytes) | 542,638,080 | 105,321,600 |
| Size | 517.5 MB | 100.4 MB |
| Events in quadrant A | 4,236,281 | 677,737 |
| Events in quadrant B | 3,381,101 | 692,038 |
| Events in quadrant C | 3,144,769 | 673,055 |
| Events in quadrant D | 5,175,009 | 637,063 |
| Mode M0 | |||
|---|---|---|---|
| Quadrant | BADHDUFLAG | Total packets | Discarded packets |
| A | 0 | 17286 | 3 |
| B | 0 | 15183 | 2 |
| C | 0 | 14797 | 2 |
| D | 0 | 20526 | 2 |
| Mode M9 | |||
|---|---|---|---|
| Quadrant | BADHDUFLAG | Total packets | Discarded packets |
| A | 0 | 5 | 0 |
| B | 0 | 5 | 0 |
| C | 0 | 5 | 0 |
| D | 0 | 5 | 0 |
| Mode SS | |||
|---|---|---|---|
| Quadrant | BADHDUFLAG | Total packets | Discarded packets |
| A | 0 | 148 | 0 |
| B | 0 | 148 | 0 |
| C | 0 | 148 | 0 |
| D | 0 | 148 | 0 |
| Quadrant | Total seconds | Saturated seconds | Saturation percentage |
|---|---|---|---|
| A | 7323 | 161 | 2.198553% |
| B | 7323 | 59 | 0.805681% |
| C | 7323 | 32 | 0.436979% |
| D | 7323 | 296 | 4.042059% |
Noise dominated data is calculated using 1-second bins in cleaned event files. If a bin has >2000 counts, and if more than 50% of those come from <1% of pixels, then it is considered to be noise-dominated and hence unusable.
| Quadrant | # 1 sec bins | Bins with >0 counts | Bins with >2000 counts | High rate bins dominated by noise | Noise dominated (total time) | Noise dominated (detector-on time) | Marked lightcurve |
|---|---|---|---|---|---|---|---|
| A | 7798 | 7324 | 56 | 56 | 0.72% | 0.76% | 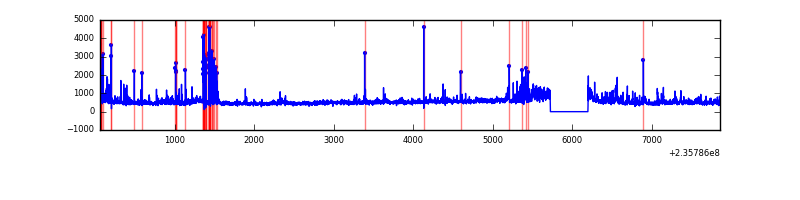 |
| B | 7798 | 7324 | 2 | 2 | 0.03% | 0.03% | 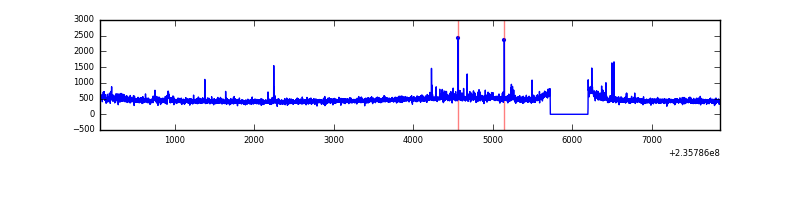 |
| C | 7798 | 7324 | 0 | 0 | 0.00% | 0.00% | 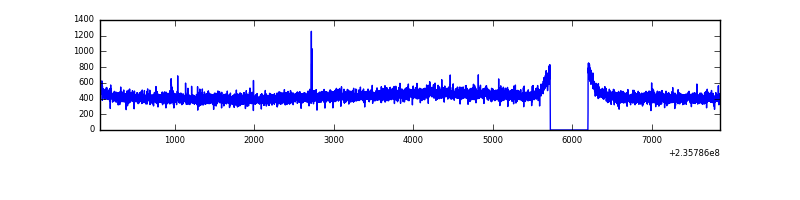 |
| D | 7798 | 7324 | 153 | 153 | 1.96% | 2.09% | 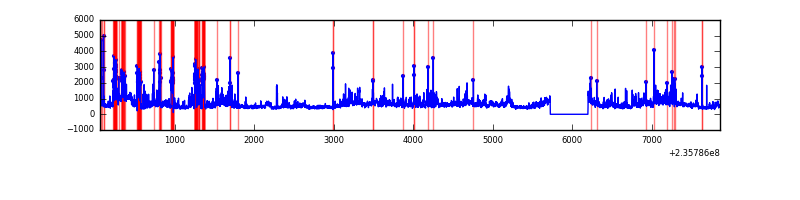 |
Top three noisy pixels from each quadrant. If the there are fewer than three noisy pixels in the level2.evt file, extra rows are filled as -1
| Pixel properties | Quadrant properties | ||||||
|---|---|---|---|---|---|---|---|
| Quadrant | DetID | PixID | Counts | Sigma | Mean | Median | Sigma |
| A | 8 | 5 | 853212 | 5066.64 | 820 | 800 | 168.2 |
| A | 1 | 162 | 68564 | 402.78 | 820 | 800 | 168.2 |
| A | 5 | 112 | 46274 | 270.29 | 820 | 800 | 168.2 |
| B | 0 | 214 | 60349 | 375.69 | 834 | 813 | 158.5 |
| B | 5 | 255 | 26838 | 164.22 | 834 | 813 | 158.5 |
| B | 12 | 111 | 17031 | 102.34 | 834 | 813 | 158.5 |
| C | 13 | 61 | 6112 | 28.49 | 803 | 803 | 186.3 |
| C | 9 | 68 | 5652 | 26.02 | 803 | 803 | 186.3 |
| C | 8 | 222 | 4333 | 18.94 | 803 | 803 | 186.3 |
| D | 1 | 52 | 973781 | 4754.41 | 779 | 757 | 204.7 |
| D | 8 | 195 | 838663 | 4094.2 | 779 | 757 | 204.7 |
| D | 12 | 233 | 179080 | 871.33 | 779 | 757 | 204.7 |
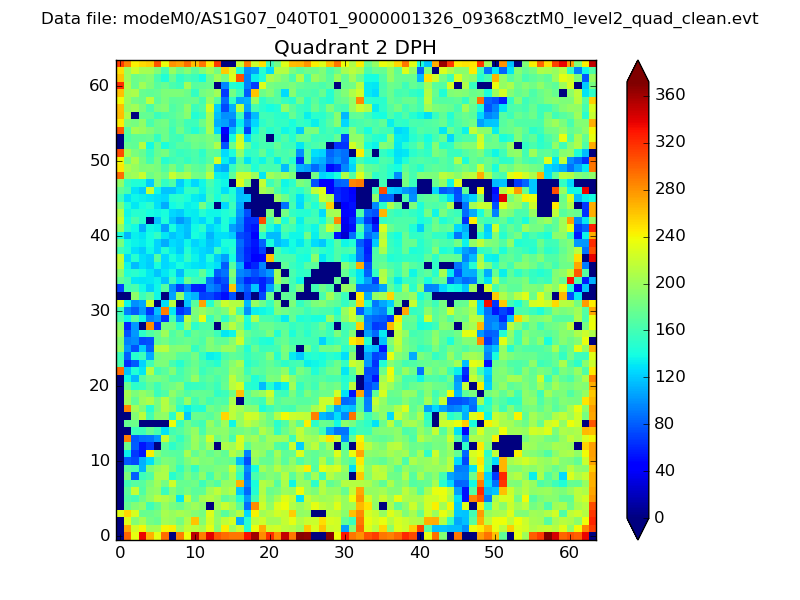
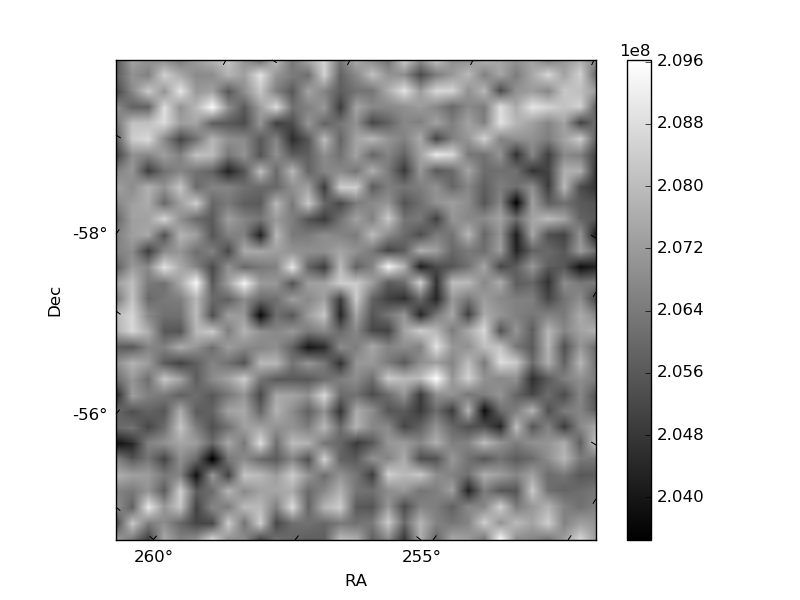
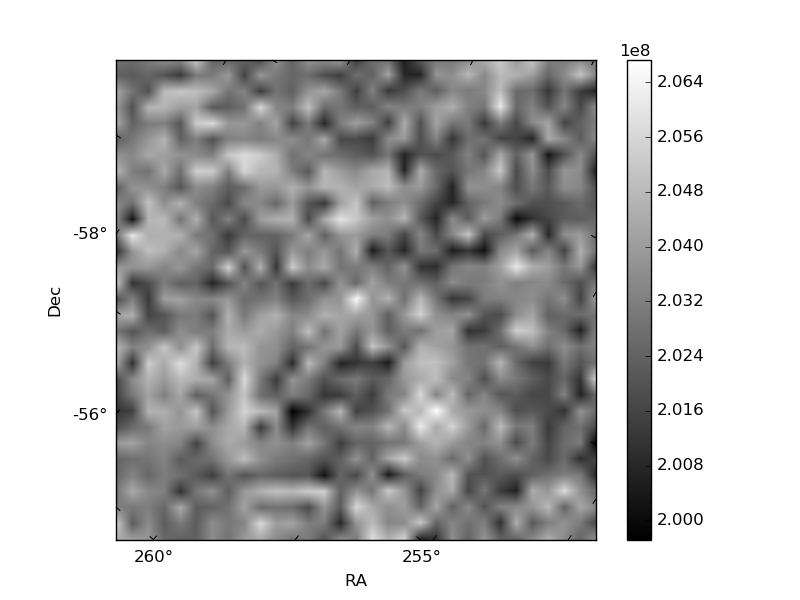
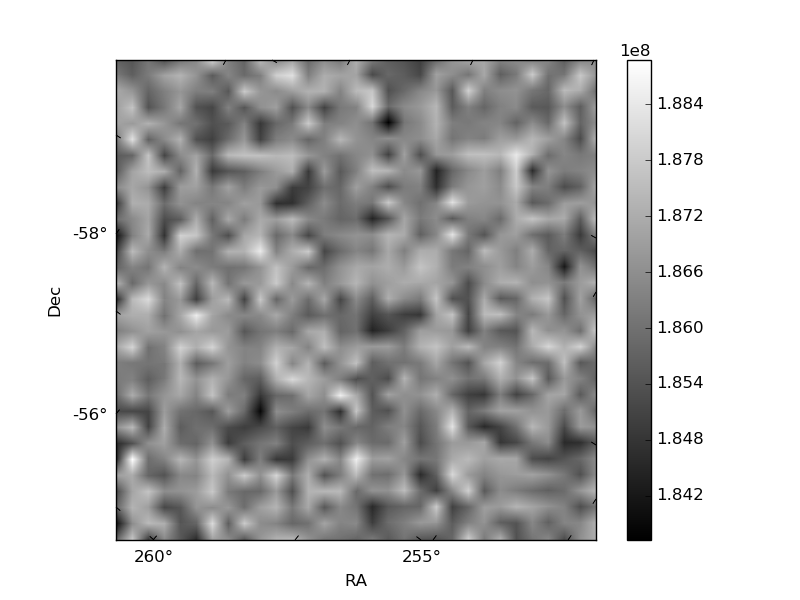
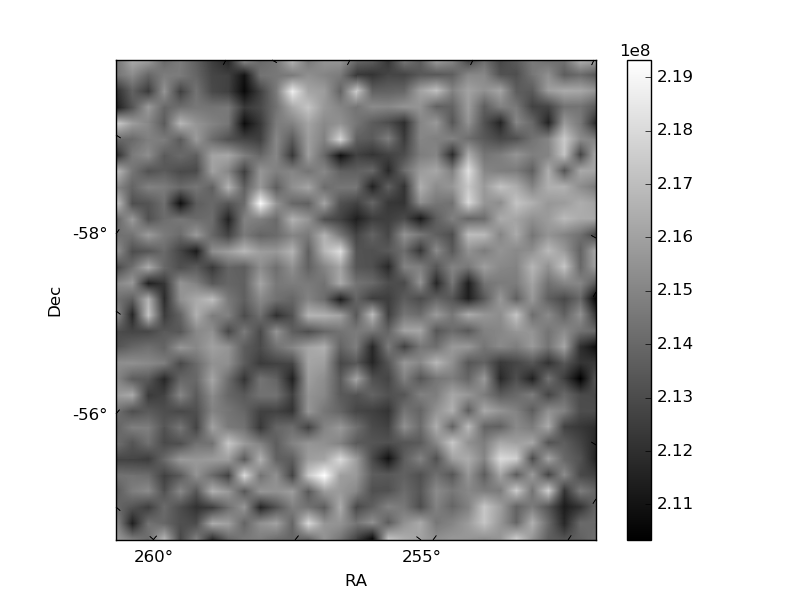
Histogram calculated using DETX and DETY for each event in the final _common_clean file
| Quadrant A | 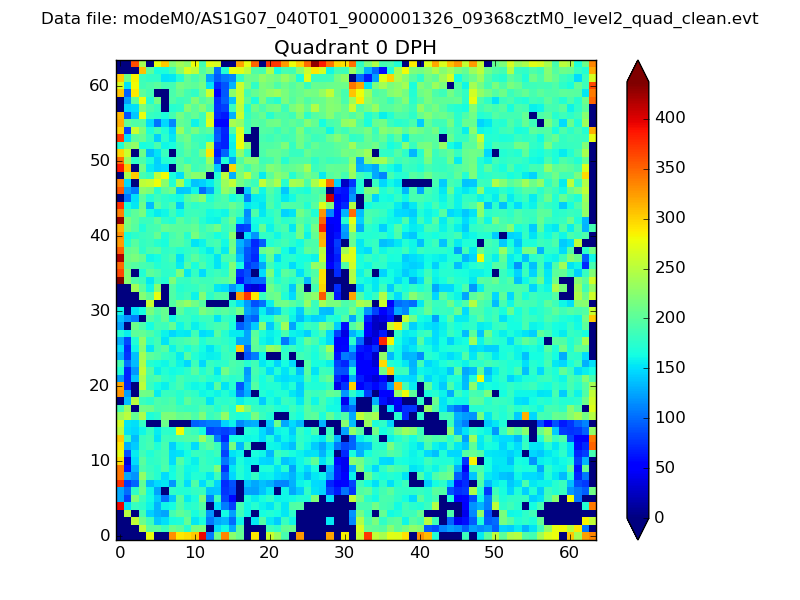 |
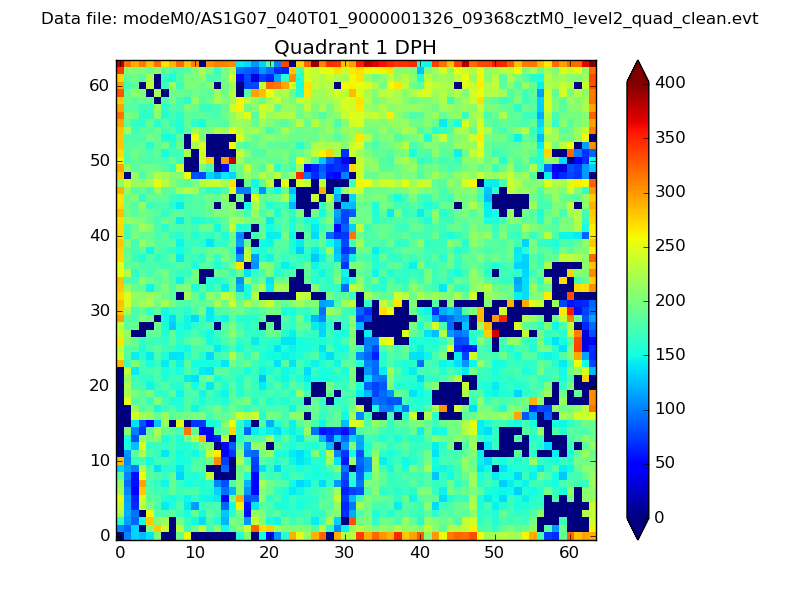 |
Quadrant B |
|---|---|---|---|
| Quadrant D | 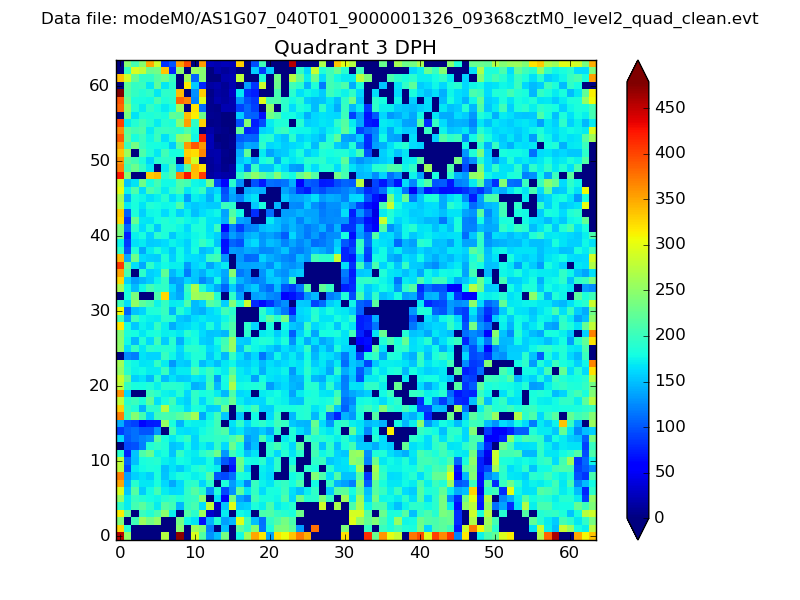 |
 |
Quadrant C |
| Plot type | Count rate plots | Images |
|---|---|---|
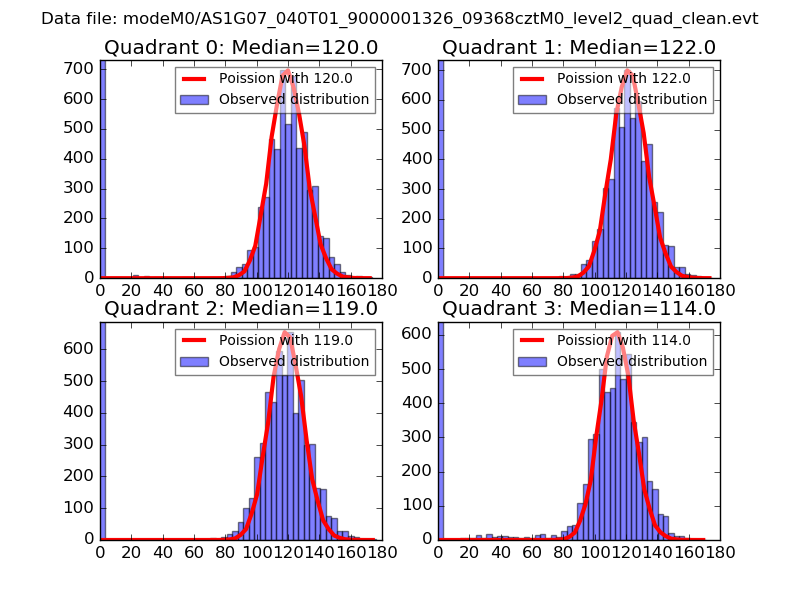
| Comparison with Poisson distribution Blue bars denote a histogram of data divided into 1 sec bins. Red curve is a Poisson curve with rate = median count rate of data. |
 |
 |
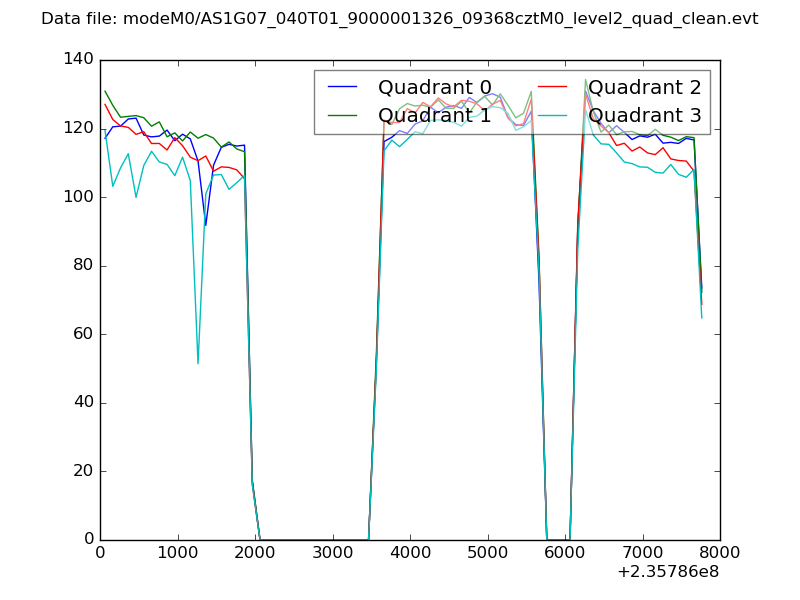
| Quadrant-wise count rates Data is divided into 100 sec bins |
 |
|
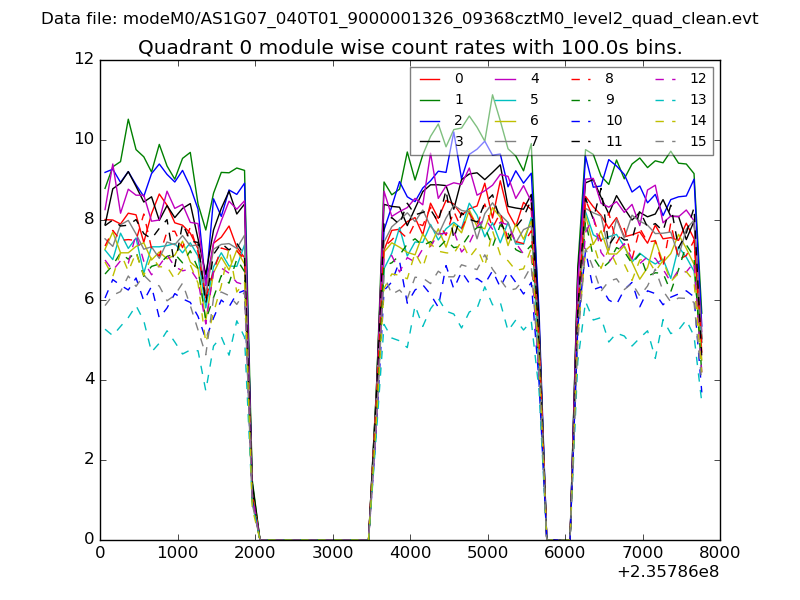
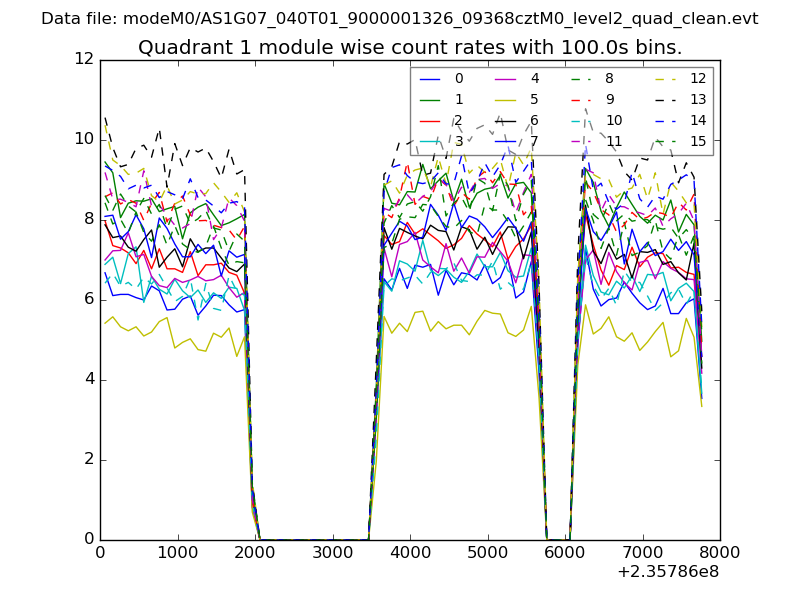
| Module-wise count rates for Quadrant A Data is divided into 100 sec bins |
 |
 |
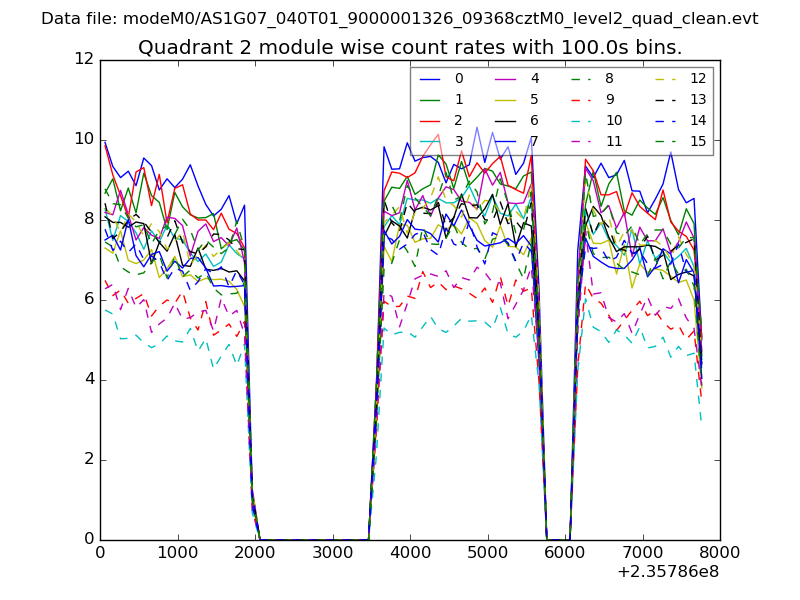
| Module-wise count rates for Quadrant B Data is divided into 100 sec bins |
 |
 |
| Module-wise count rates for Quadrant C Data is divided into 100 sec bins |
 |
 |
| Module-wise count rates for Quadrant D Data is divided into 100 sec bins |
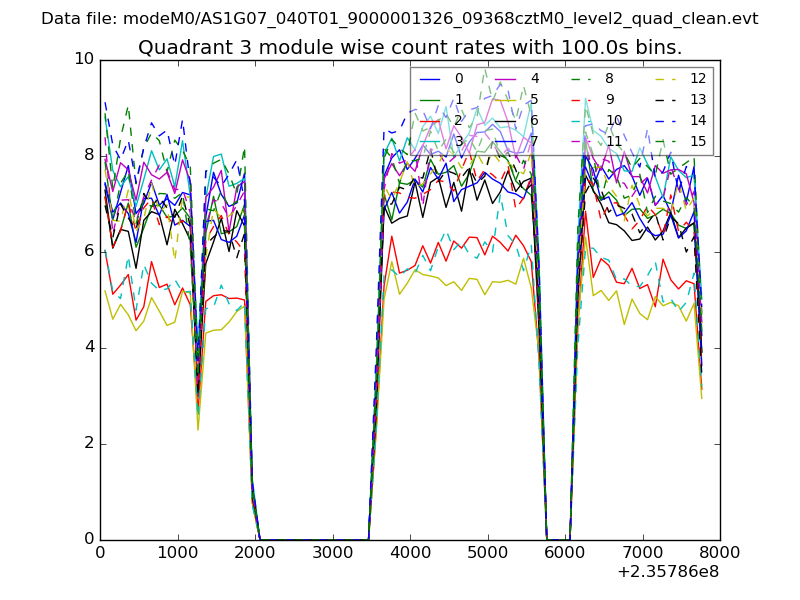 |
 |
| Parameter | Plot |
|---|---|
| CZT HV Monitor | 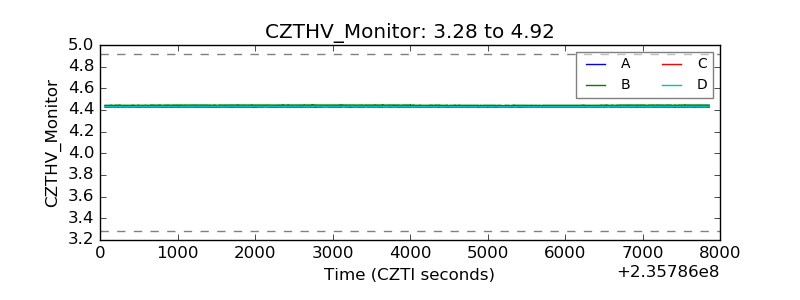 |
| D_VDD | 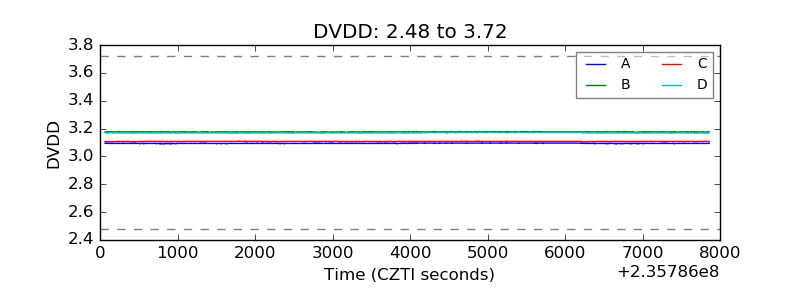 |
| Temperature 1 | 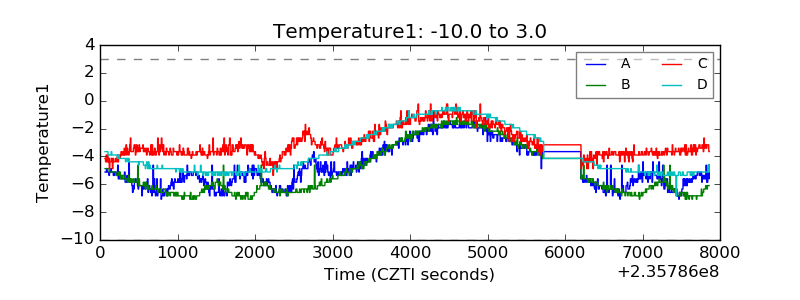 |
| Veto HV Monitor |  |
| Veto LLD | 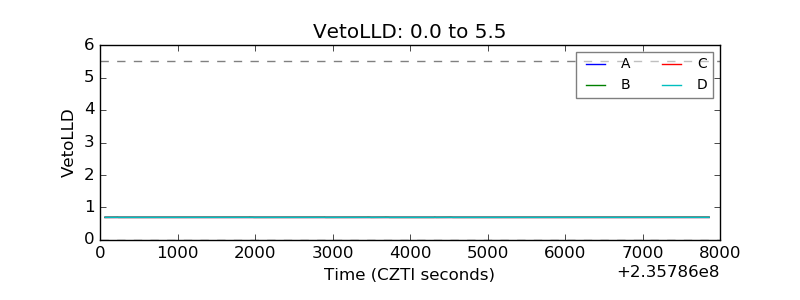 |
| Alpha Counter | 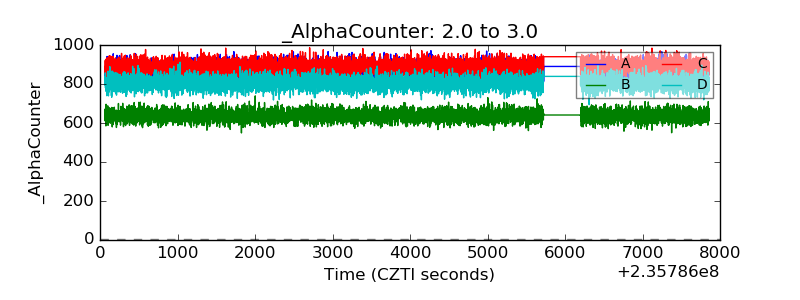 |
| _CPM_Rate | 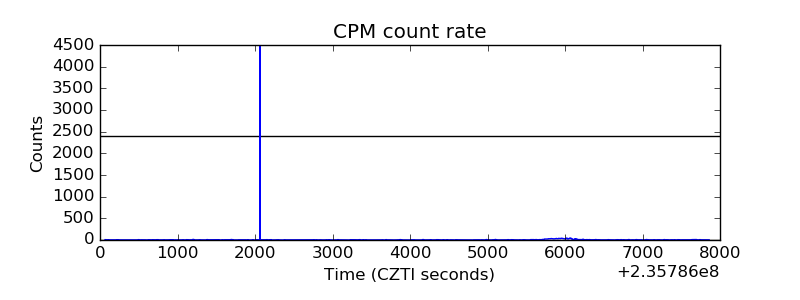 |
| CZT Counter | 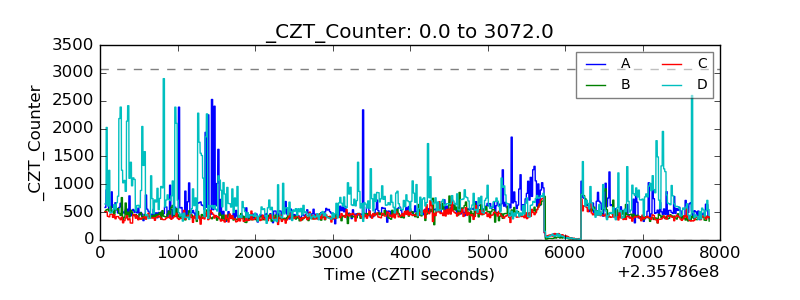 |
| +2.5 Volts monitor | 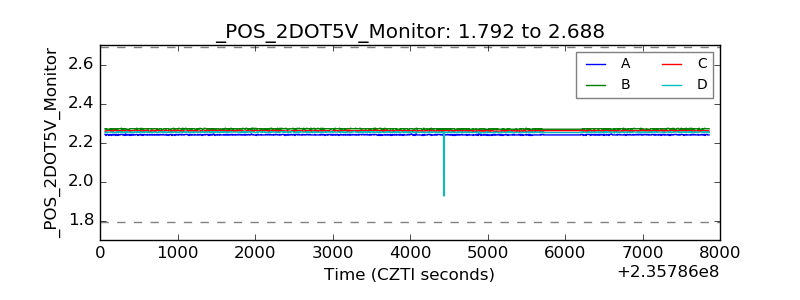 |
| +5 Volts monitor |  |
| _ROLL_ROT | 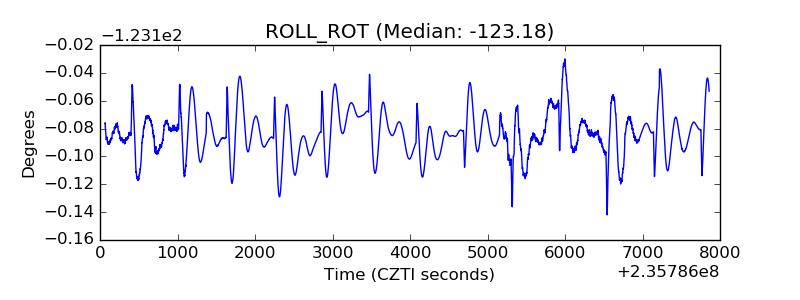 |
| _Roll_DEC | 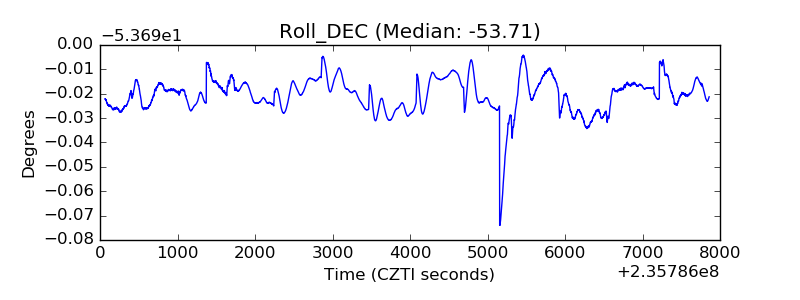 |
| _Roll_RA | 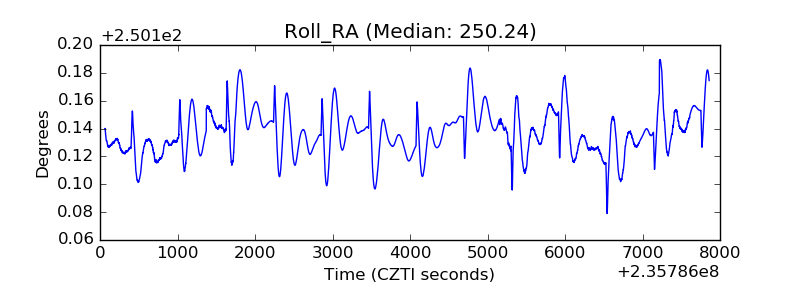 |
| Veto Counter |  |