| Param | Original file | Final file |
|---|---|---|
| Filename | modeM0/AS1G07_040T01_9000001326_09369cztM0_level2.evt | modeM0/AS1G07_040T01_9000001326_09369cztM0_level2_quad_clean.evt |
| Size (bytes) | 517,939,200 | 92,249,280 |
| Size | 493.9 MB | 88.0 MB |
| Events in quadrant A | 4,543,402 | 589,326 |
| Events in quadrant B | 3,010,610 | 598,724 |
| Events in quadrant C | 2,837,707 | 586,814 |
| Events in quadrant D | 4,848,935 | 560,742 |
| Mode M0 | |||
|---|---|---|---|
| Quadrant | BADHDUFLAG | Total packets | Discarded packets |
| A | 0 | 18074 | 1 |
| B | 0 | 13457 | 1 |
| C | 0 | 13307 | 1 |
| D | 0 | 19128 | 1 |
| Mode M9 | |||
|---|---|---|---|
| Quadrant | BADHDUFLAG | Total packets | Discarded packets |
| A | 0 | 3 | 0 |
| B | 0 | 3 | 0 |
| C | 0 | 3 | 0 |
| D | 0 | 3 | 0 |
| Mode SS | |||
|---|---|---|---|
| Quadrant | BADHDUFLAG | Total packets | Discarded packets |
| A | 0 | 134 | 0 |
| B | 0 | 134 | 0 |
| C | 0 | 134 | 0 |
| D | 0 | 134 | 0 |
| Quadrant | Total seconds | Saturated seconds | Saturation percentage |
|---|---|---|---|
| A | 6566 | 62 | 0.944258% |
| B | 6566 | 27 | 0.411209% |
| C | 6566 | 5 | 0.076150% |
| D | 6566 | 98 | 1.492537% |
Noise dominated data is calculated using 1-second bins in cleaned event files. If a bin has >2000 counts, and if more than 50% of those come from <1% of pixels, then it is considered to be noise-dominated and hence unusable.
| Quadrant | # 1 sec bins | Bins with >0 counts | Bins with >2000 counts | High rate bins dominated by noise | Noise dominated (total time) | Noise dominated (detector-on time) | Marked lightcurve |
|---|---|---|---|---|---|---|---|
| A | 6931 | 6567 | 22 | 22 | 0.32% | 0.34% | 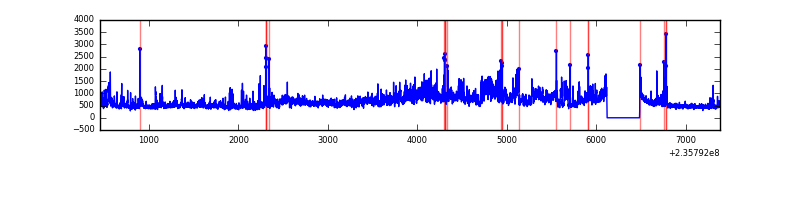 |
| B | 6931 | 6567 | 0 | 0 | 0.00% | 0.00% | 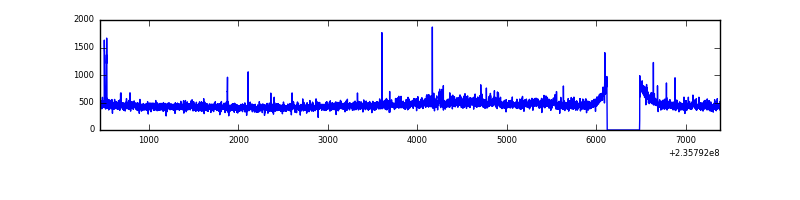 |
| C | 6931 | 6567 | 1 | 1 | 0.01% | 0.02% | 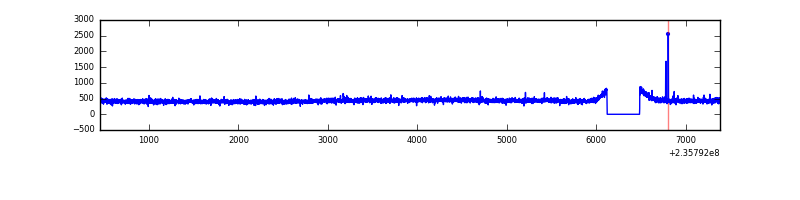 |
| D | 6931 | 6567 | 81 | 81 | 1.17% | 1.23% | 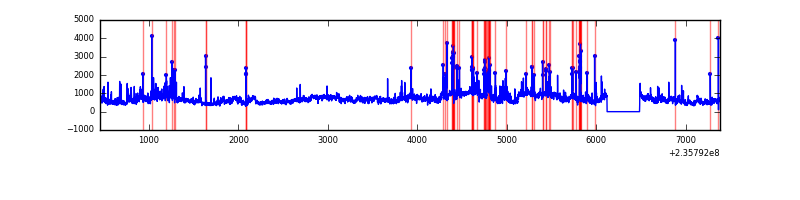 |
Top three noisy pixels from each quadrant. If the there are fewer than three noisy pixels in the level2.evt file, extra rows are filled as -1
| Pixel properties | Quadrant properties | ||||||
|---|---|---|---|---|---|---|---|
| Quadrant | DetID | PixID | Counts | Sigma | Mean | Median | Sigma |
| A | 8 | 5 | 1547067 | 10193.19 | 741 | 723 | 151.7 |
| A | 5 | 112 | 47418 | 307.8 | 741 | 723 | 151.7 |
| A | 1 | 162 | 33556 | 216.43 | 741 | 723 | 151.7 |
| B | 0 | 214 | 30098 | 203.32 | 751 | 731 | 144.4 |
| B | 5 | 255 | 23989 | 161.02 | 751 | 731 | 144.4 |
| B | 12 | 111 | 15691 | 103.57 | 751 | 731 | 144.4 |
| C | 9 | 68 | 13178 | 73.91 | 722 | 723 | 168.5 |
| C | 13 | 61 | 5470 | 28.17 | 722 | 723 | 168.5 |
| C | 8 | 222 | 4509 | 22.47 | 722 | 723 | 168.5 |
| D | 8 | 195 | 1525224 | 8202.53 | 708 | 689 | 185.9 |
| D | 1 | 52 | 234790 | 1259.55 | 708 | 689 | 185.9 |
| D | 12 | 233 | 198283 | 1063.13 | 708 | 689 | 185.9 |
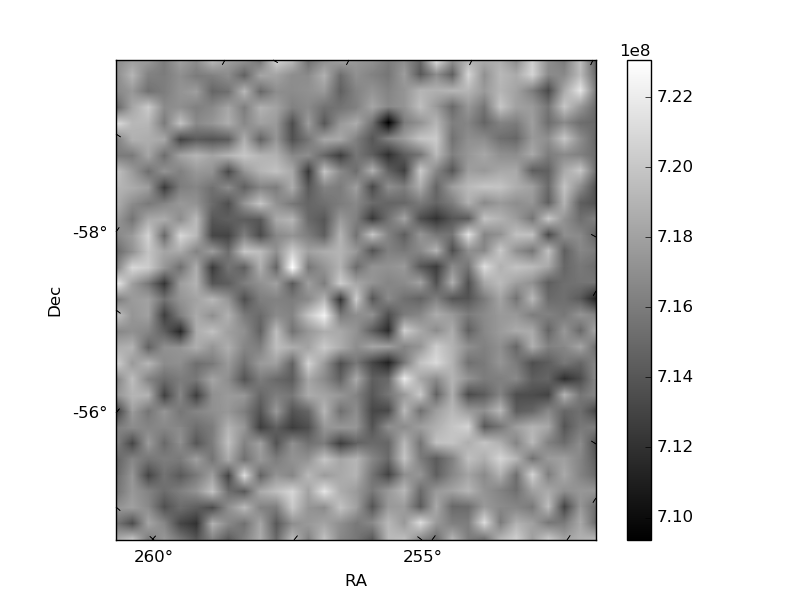
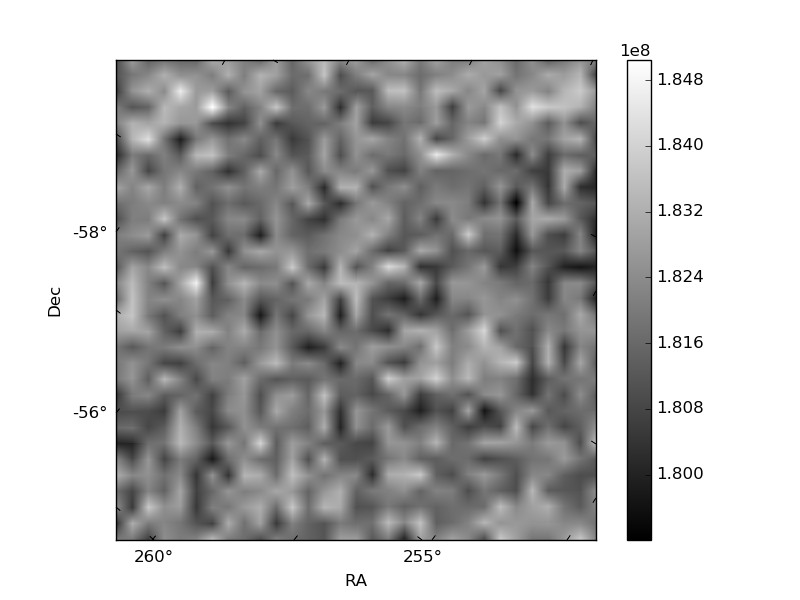
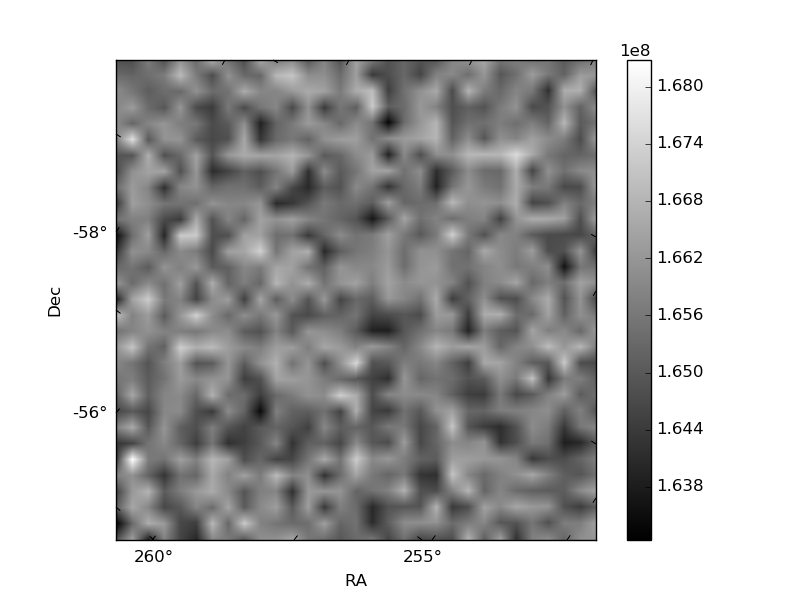
Histogram calculated using DETX and DETY for each event in the final _common_clean file
| Quadrant A | 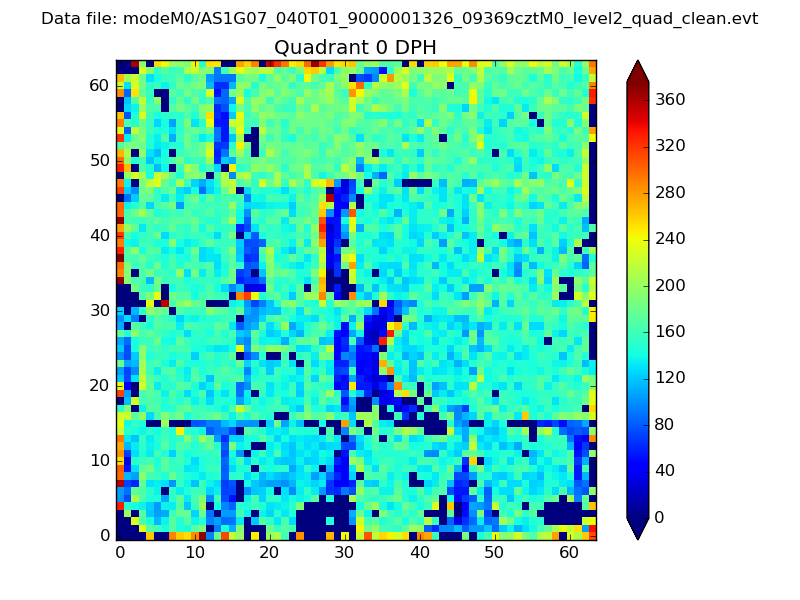 |
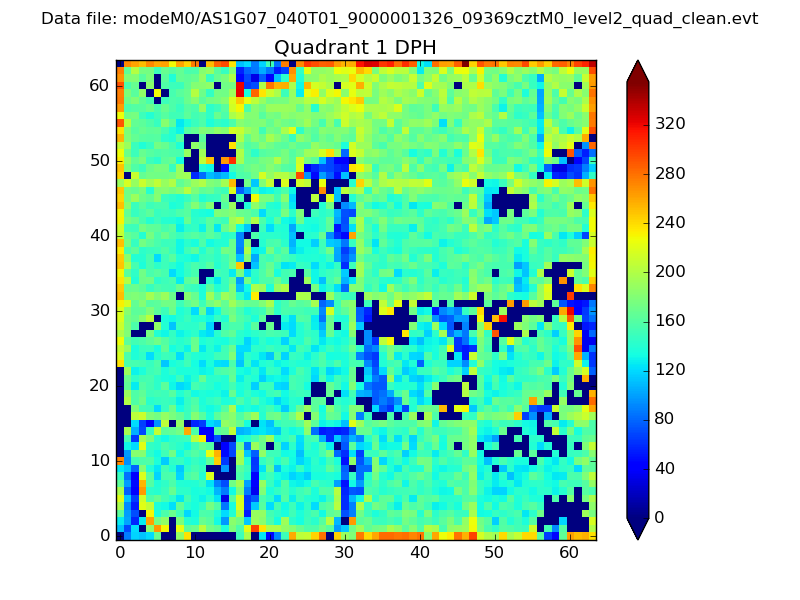 |
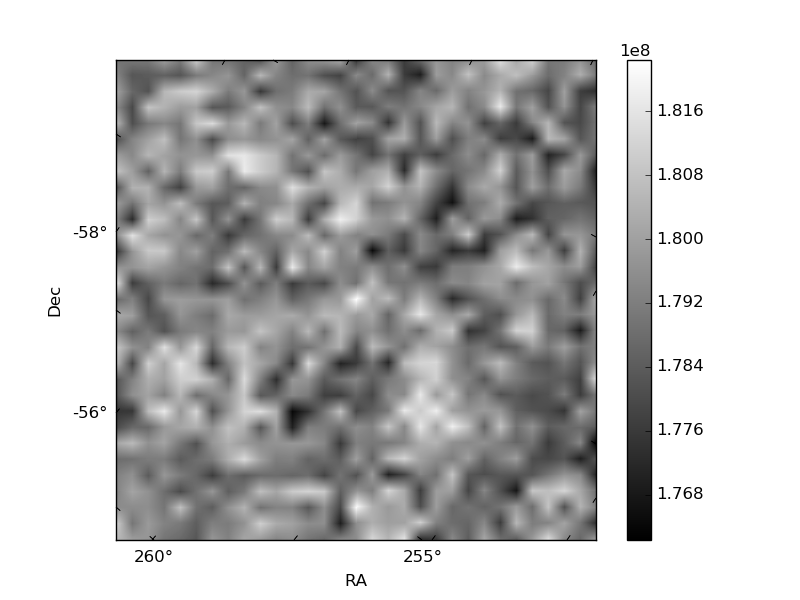
Quadrant B |
|---|---|---|---|
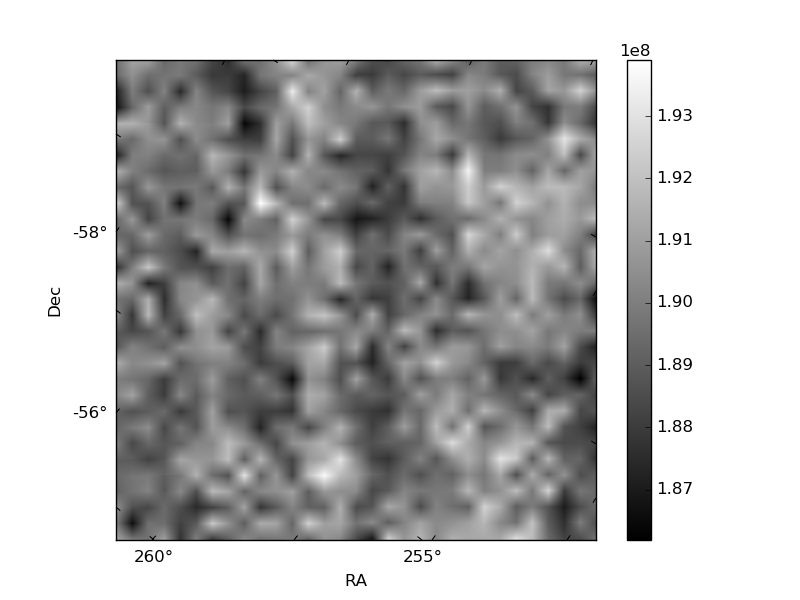
| Quadrant D | 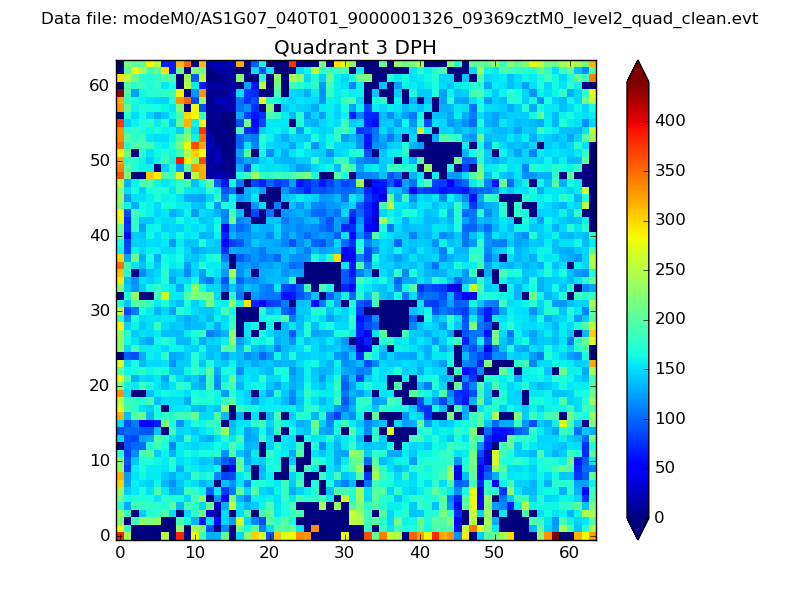 |
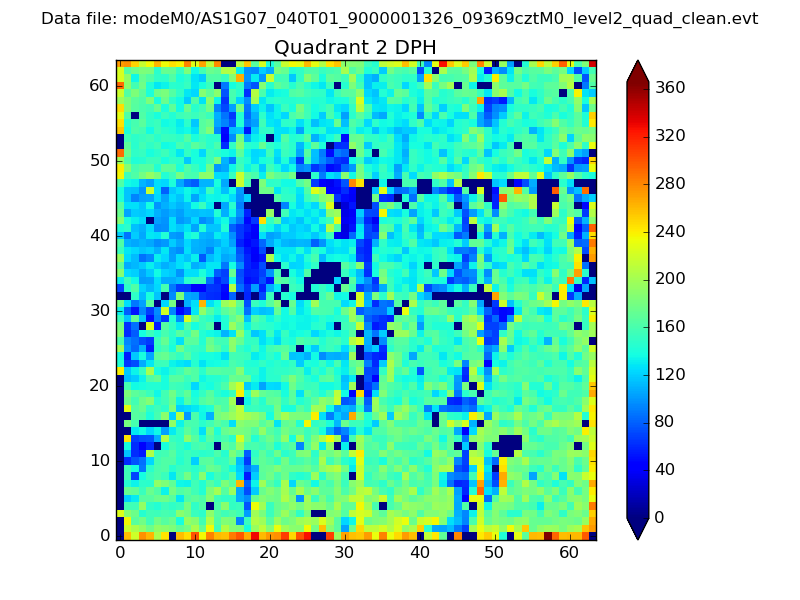 |
Quadrant C |
| Plot type | Count rate plots | Images |
|---|---|---|
| Comparison with Poisson distribution Blue bars denote a histogram of data divided into 1 sec bins. Red curve is a Poisson curve with rate = median count rate of data. |
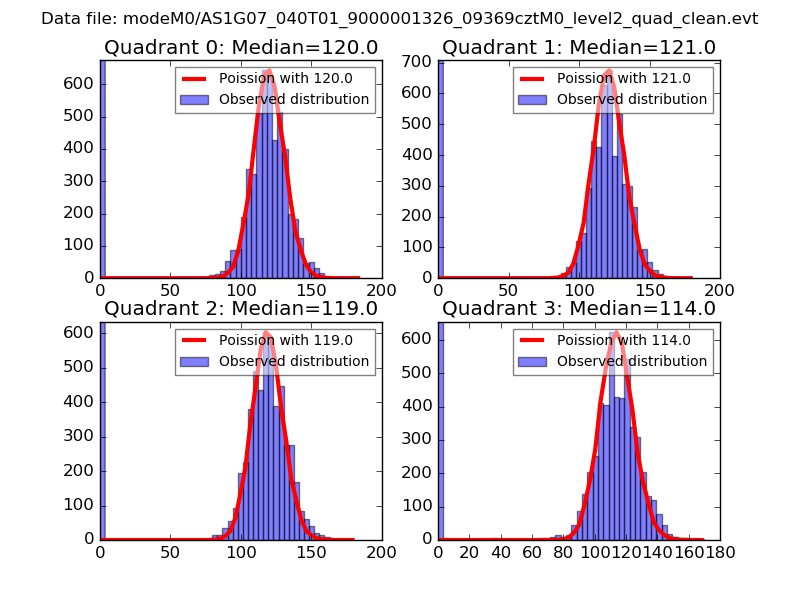 |
 |
| Quadrant-wise count rates Data is divided into 100 sec bins |
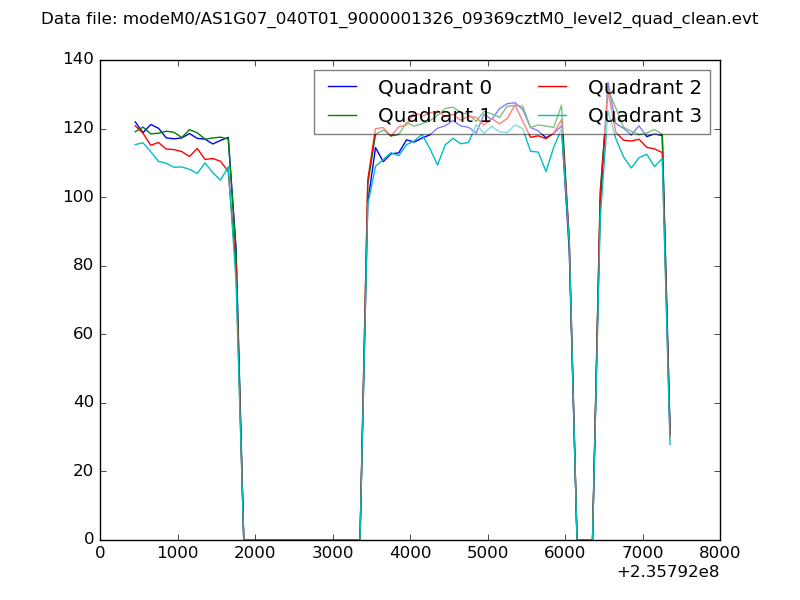 |
|
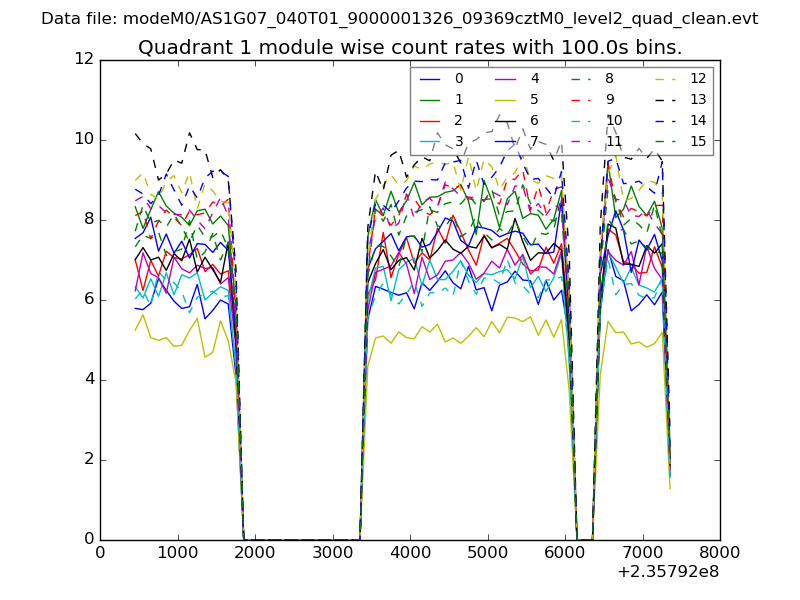
| Module-wise count rates for Quadrant A Data is divided into 100 sec bins |
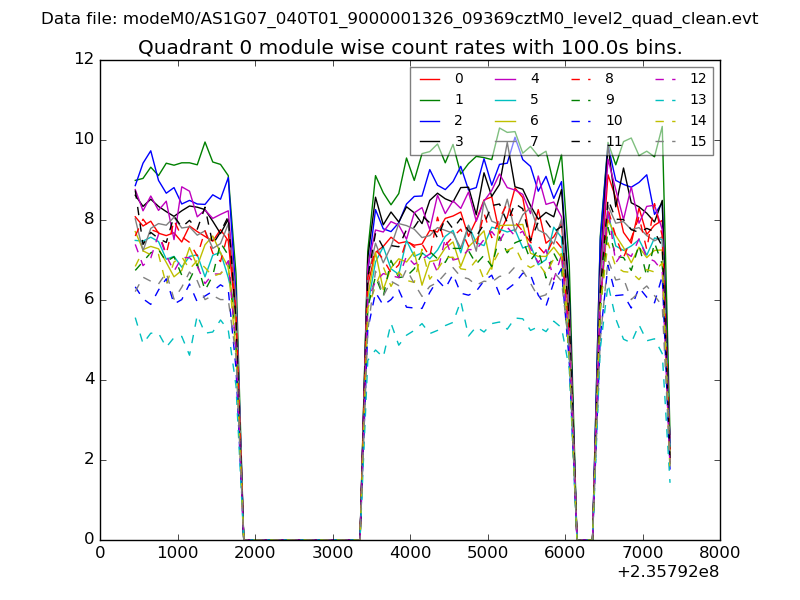 |
 |
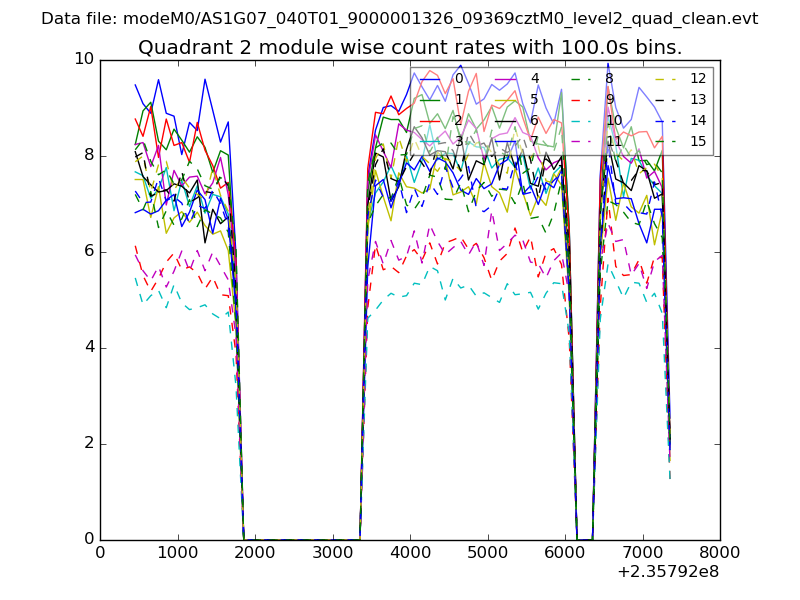
| Module-wise count rates for Quadrant B Data is divided into 100 sec bins |
 |
 |
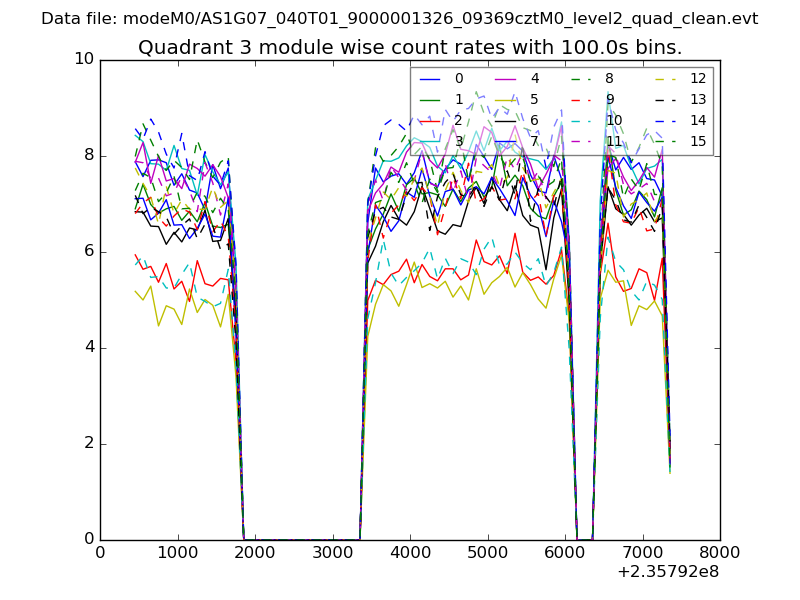
| Module-wise count rates for Quadrant C Data is divided into 100 sec bins |
 |
 |
| Module-wise count rates for Quadrant D Data is divided into 100 sec bins |
 |
 |
| Parameter | Plot |
|---|---|
| CZT HV Monitor | 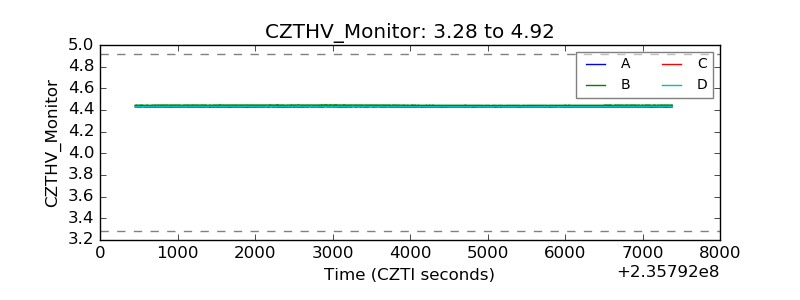 |
| D_VDD | 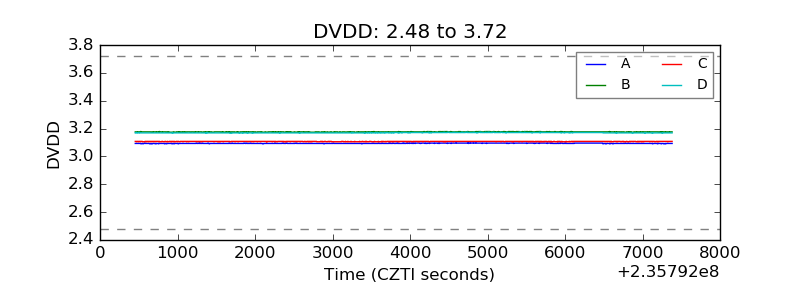 |
| Temperature 1 | 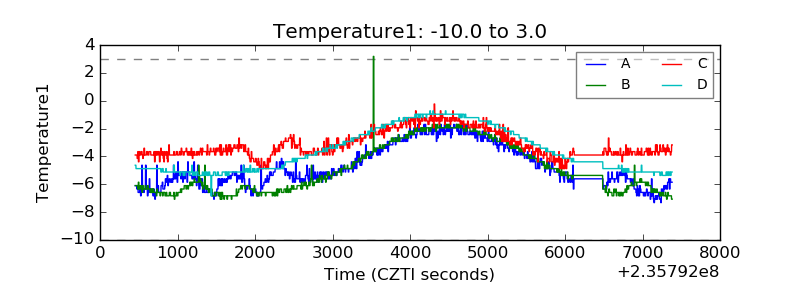 |
| Veto HV Monitor | 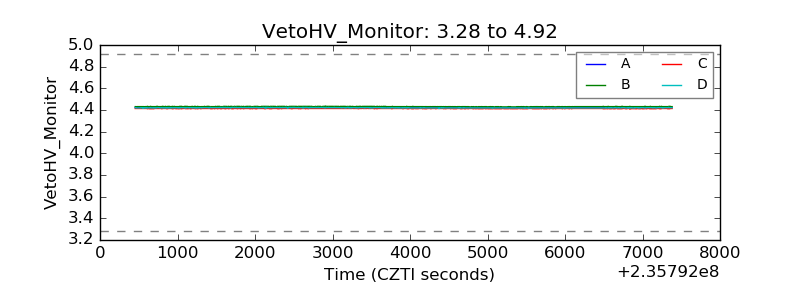 |
| Veto LLD | 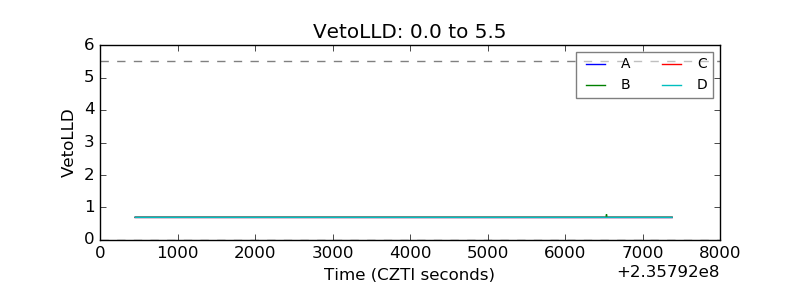 |
| Alpha Counter | 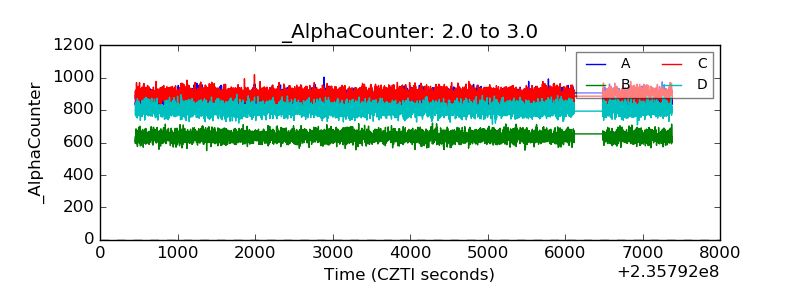 |
| _CPM_Rate | 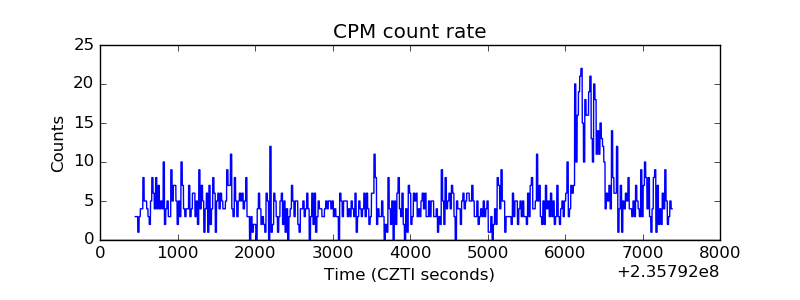 |
| CZT Counter | 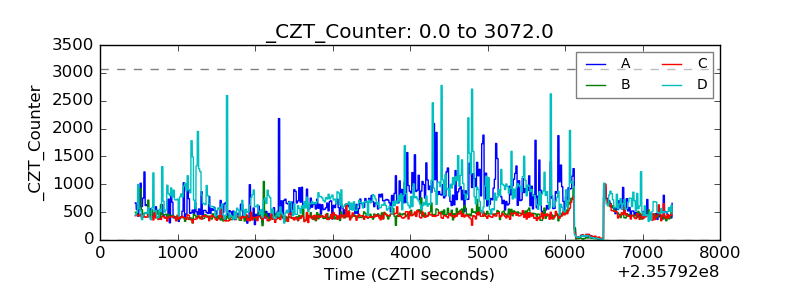 |
| +2.5 Volts monitor | 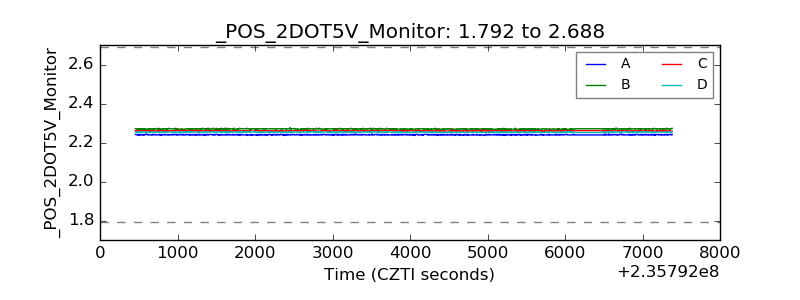 |
| +5 Volts monitor |  |
| _ROLL_ROT | 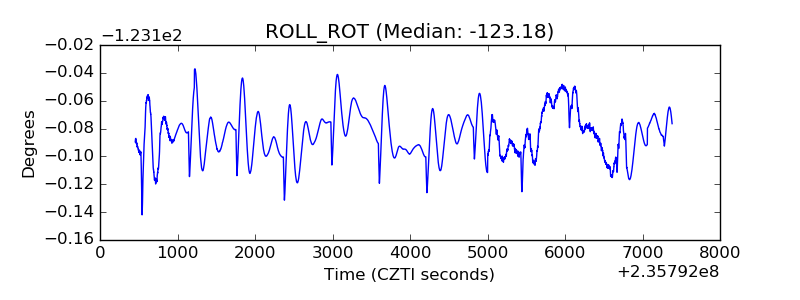 |
| _Roll_DEC | 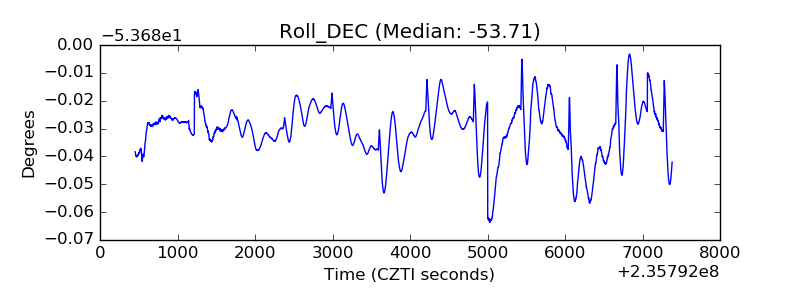 |
| _Roll_RA | 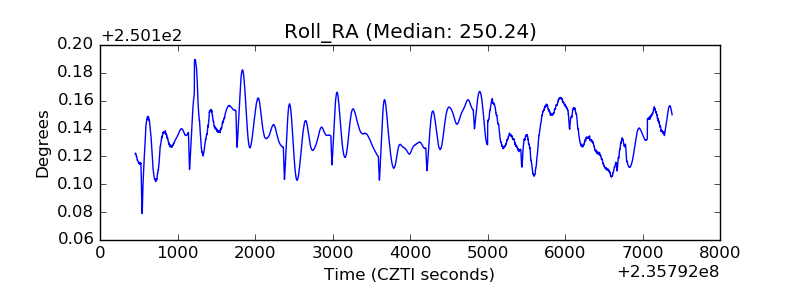 |
| Veto Counter | 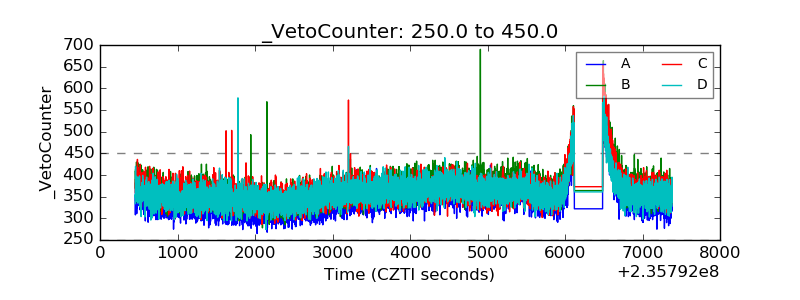 |