| Param | Original file | Final file |
|---|---|---|
| Filename | modeM0/AS1G07_040T01_9000001326_09370cztM0_level2.evt | modeM0/AS1G07_040T01_9000001326_09370cztM0_level2_quad_clean.evt |
| Size (bytes) | 34,381,440 | 8,570,880 |
| Size | 32.8 MB | 8.2 MB |
| Events in quadrant A | 265,340 | 55,523 |
| Events in quadrant B | 218,978 | 55,939 |
| Events in quadrant C | 216,451 | 54,766 |
| Events in quadrant D | 305,636 | 52,716 |
| Mode M0 | |||
|---|---|---|---|
| Quadrant | BADHDUFLAG | Total packets | Discarded packets |
| A | 0 | 1822 | 745 |
| B | 0 | 1659 | 714 |
| C | 0 | 1671 | 709 |
| D | 0 | 2024 | 782 |
| Mode SS | |||
|---|---|---|---|
| Quadrant | BADHDUFLAG | Total packets | Discarded packets |
| A | 0 | 16 | 8 |
| B | 0 | 16 | 6 |
| C | 0 | 15 | 5 |
| D | 0 | 16 | 6 |
| Quadrant | Total seconds | Saturated seconds | Saturation percentage |
|---|---|---|---|
| A | 455 | 3 | 0.659341% |
| B | 457 | 2 | 0.437637% |
| C | 461 | 2 | 0.433839% |
| D | 460 | 3 | 0.652174% |
Noise dominated data is calculated using 1-second bins in cleaned event files. If a bin has >2000 counts, and if more than 50% of those come from <1% of pixels, then it is considered to be noise-dominated and hence unusable.
| Quadrant | # 1 sec bins | Bins with >0 counts | Bins with >2000 counts | High rate bins dominated by noise | Noise dominated (total time) | Noise dominated (detector-on time) | Marked lightcurve |
|---|---|---|---|---|---|---|---|
| A | 613 | 493 | 3 | 3 | 0.49% | 0.61% | 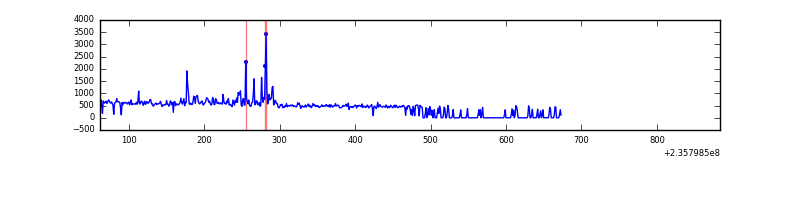 |
| B | 820 | 508 | 0 | 0 | 0.00% | 0.00% | 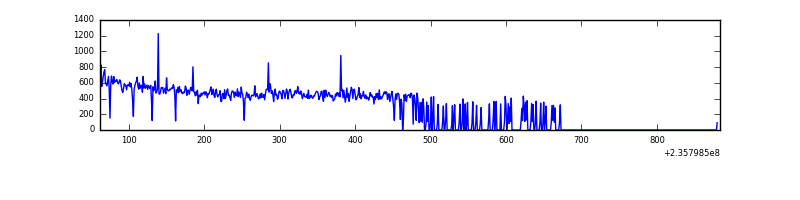 |
| C | 822 | 513 | 1 | 1 | 0.12% | 0.19% | 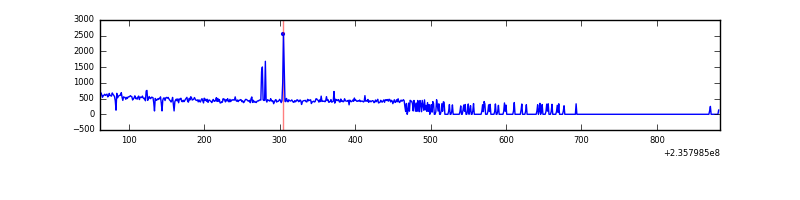 |
| D | 628 | 496 | 1 | 1 | 0.16% | 0.20% | 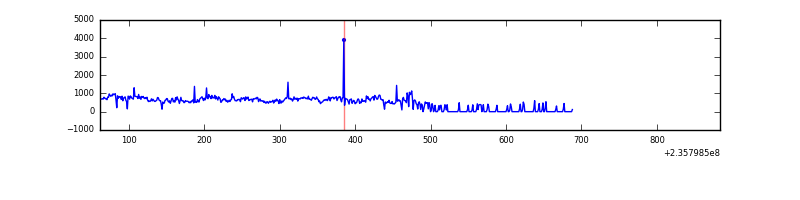 |
Top three noisy pixels from each quadrant. If the there are fewer than three noisy pixels in the level2.evt file, extra rows are filled as -1
| Pixel properties | Quadrant properties | ||||||
|---|---|---|---|---|---|---|---|
| Quadrant | DetID | PixID | Counts | Sigma | Mean | Median | Sigma |
| A | 8 | 5 | 57012 | 4305.1 | 53 | 51 | 13.2 |
| A | 1 | 162 | 1516 | 110.72 | 53 | 51 | 13.2 |
| A | 5 | 16 | 1165 | 84.2 | 53 | 51 | 13.2 |
| B | 4 | 173 | 2128 | 158.12 | 54 | 53 | 13.1 |
| B | 5 | 255 | 1548 | 113.92 | 54 | 53 | 13.1 |
| B | 3 | 209 | 1370 | 100.36 | 54 | 53 | 13.1 |
| C | 9 | 68 | 8964 | 627.94 | 53 | 53 | 14.2 |
| C | 13 | 61 | 369 | 22.27 | 53 | 53 | 14.2 |
| C | 10 | 22 | 213 | 11.27 | 53 | 53 | 14.2 |
| D | 8 | 195 | 90523 | 6175.95 | 51 | 49 | 14.6 |
| D | 1 | 52 | 10993 | 747.06 | 51 | 49 | 14.6 |
| D | 12 | 233 | 4052 | 273.25 | 51 | 49 | 14.6 |
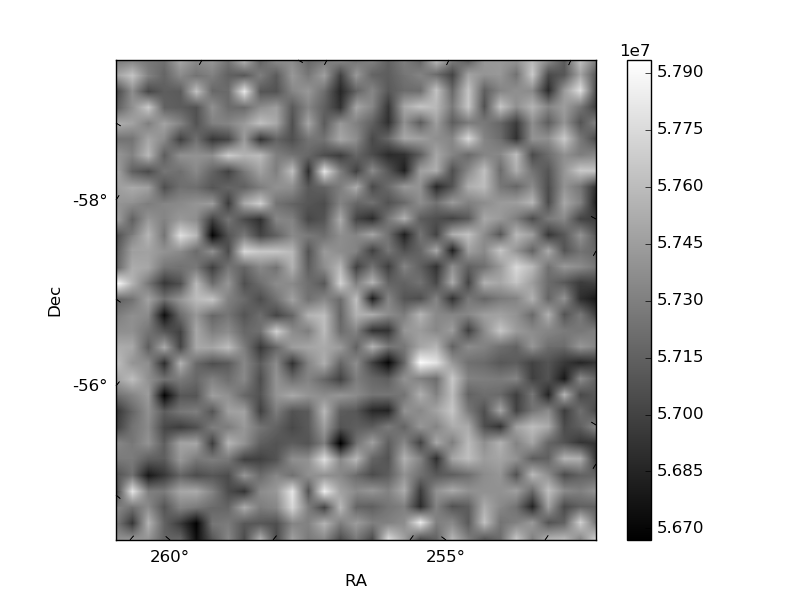
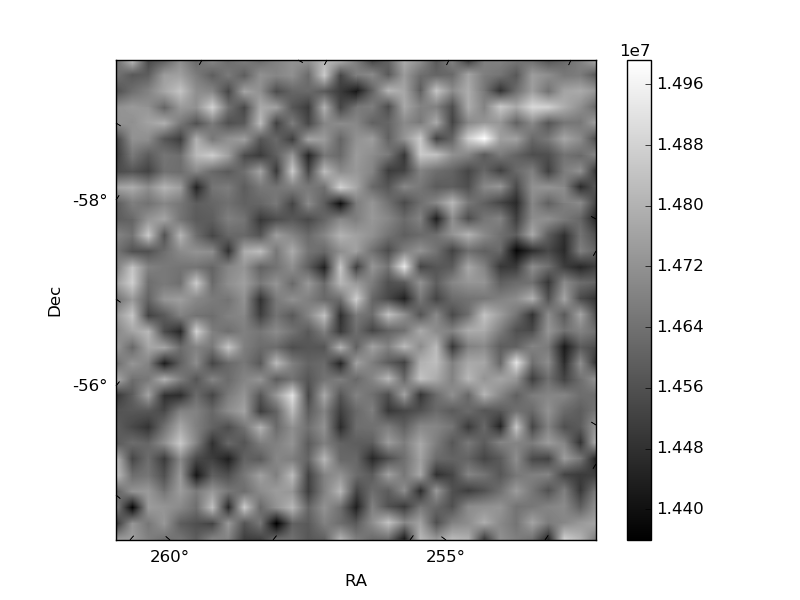
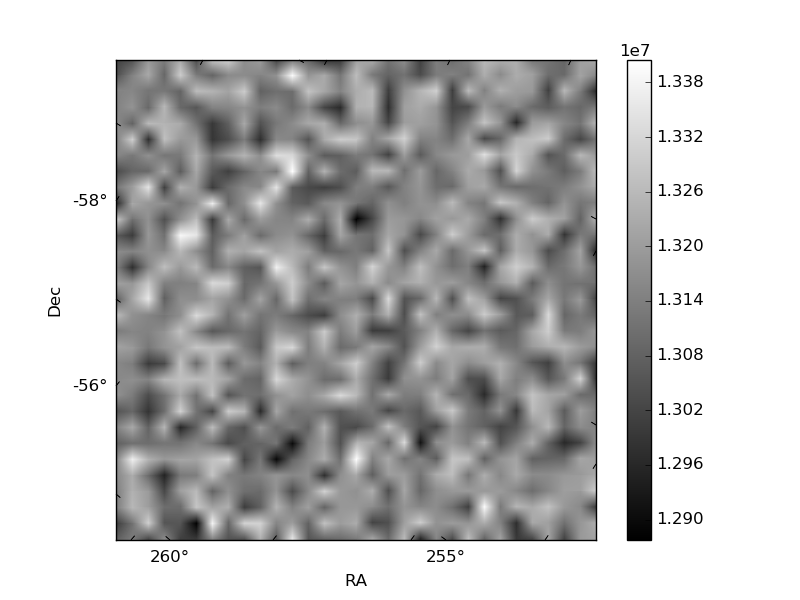
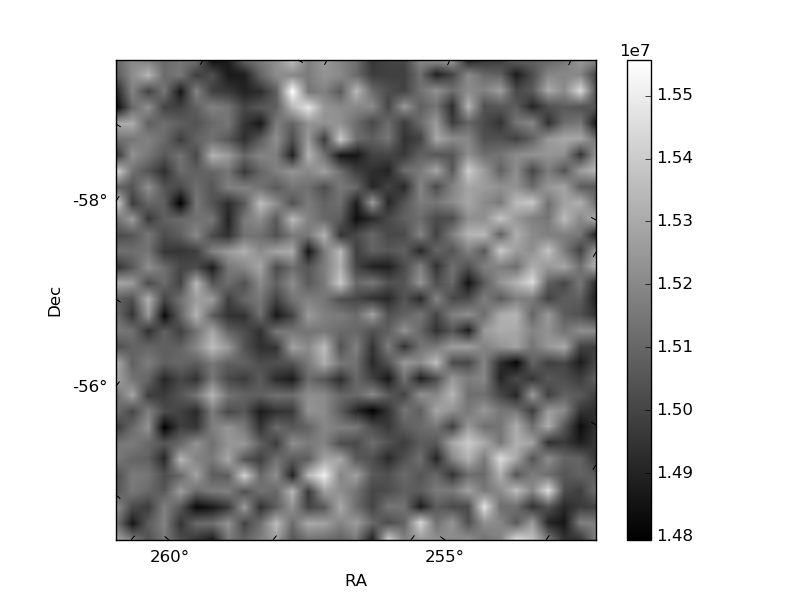
Histogram calculated using DETX and DETY for each event in the final _common_clean file
| Quadrant A | 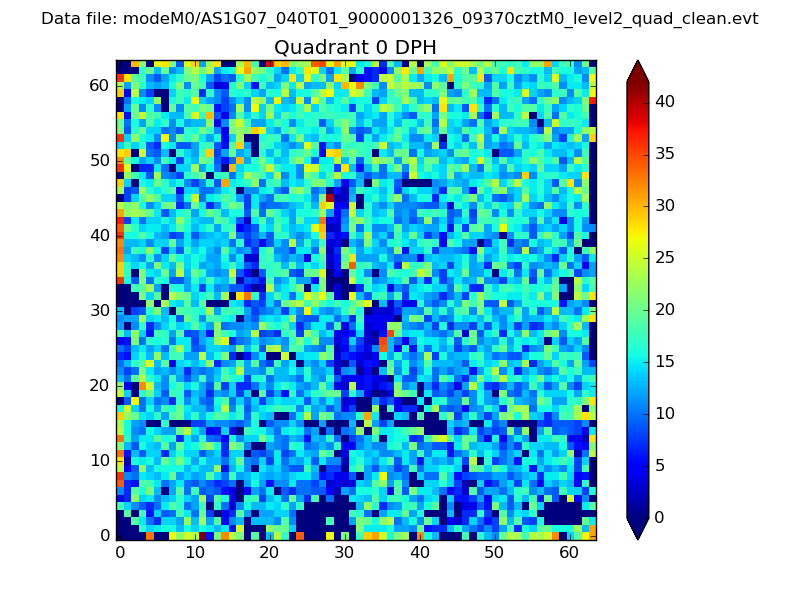 |
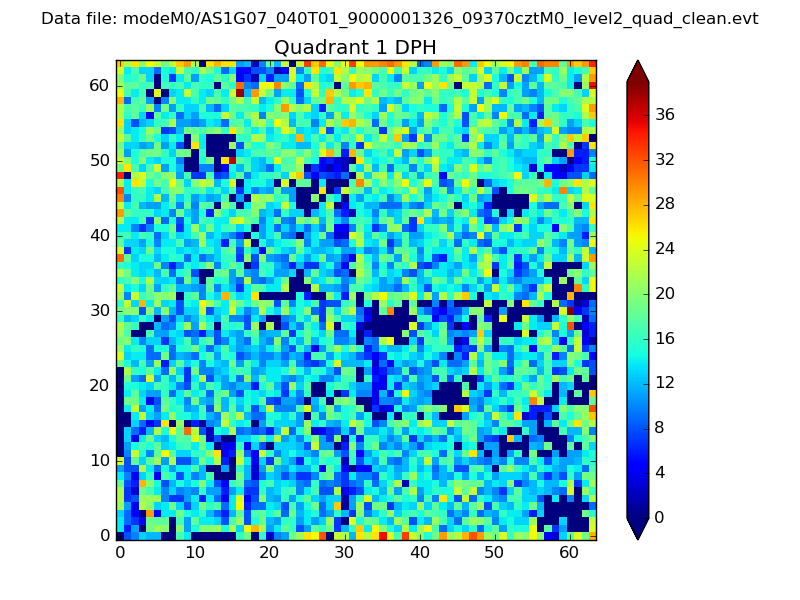 |
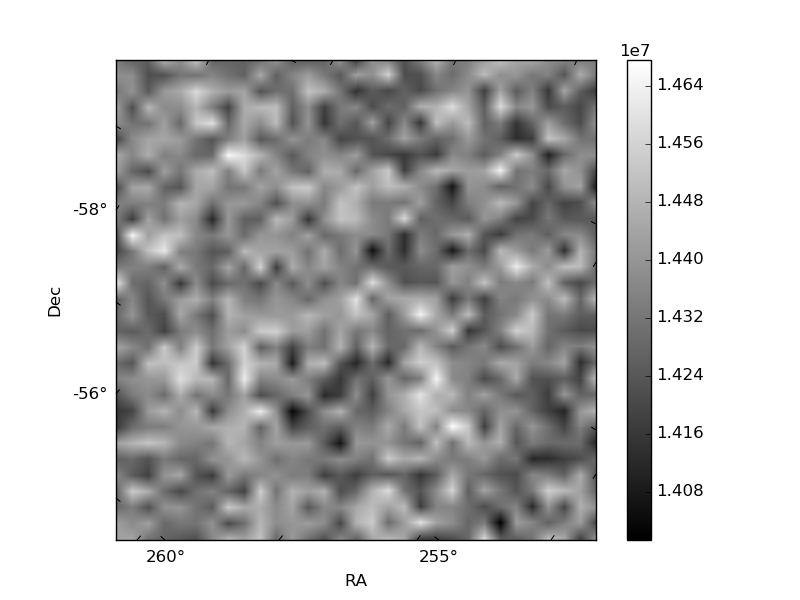
Quadrant B |
|---|---|---|---|
| Quadrant D | 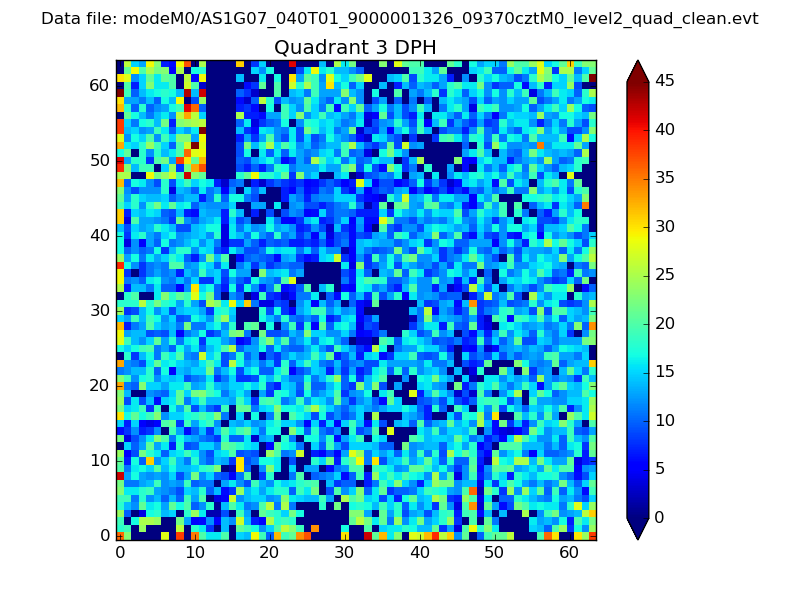 |
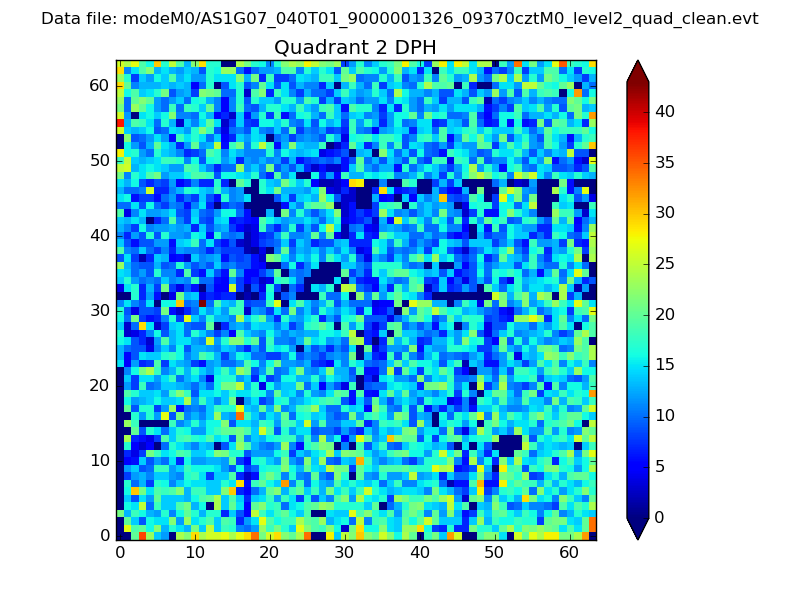 |
Quadrant C |
| Plot type | Count rate plots | Images |
|---|---|---|
| Comparison with Poisson distribution Blue bars denote a histogram of data divided into 1 sec bins. Red curve is a Poisson curve with rate = median count rate of data. |
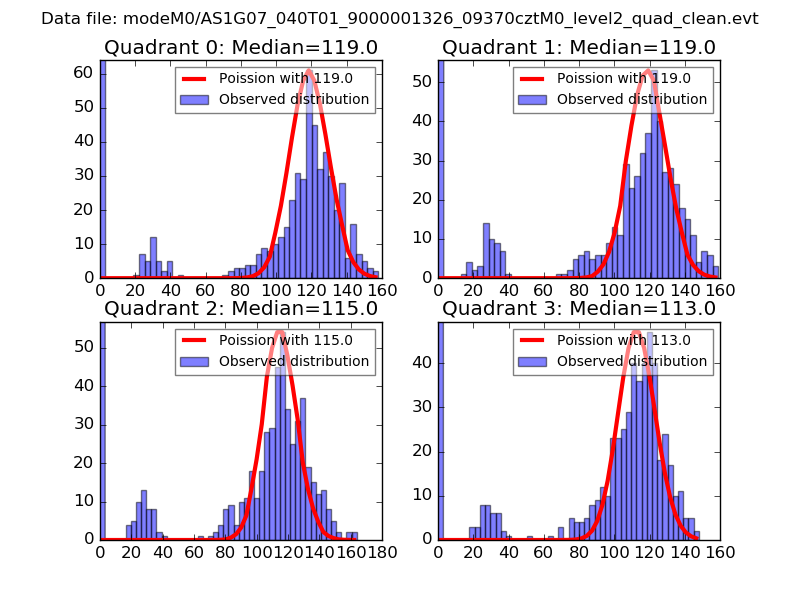 |
 |
| Quadrant-wise count rates Data is divided into 100 sec bins |
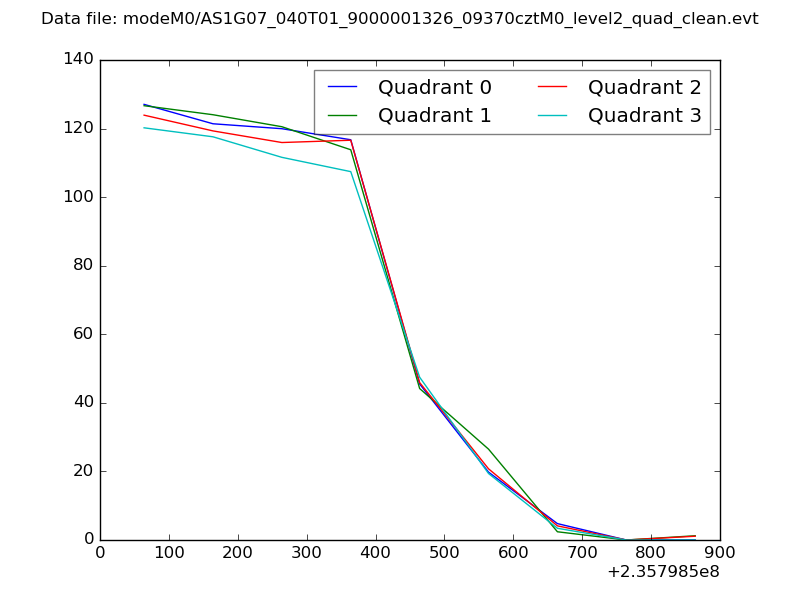 |
|
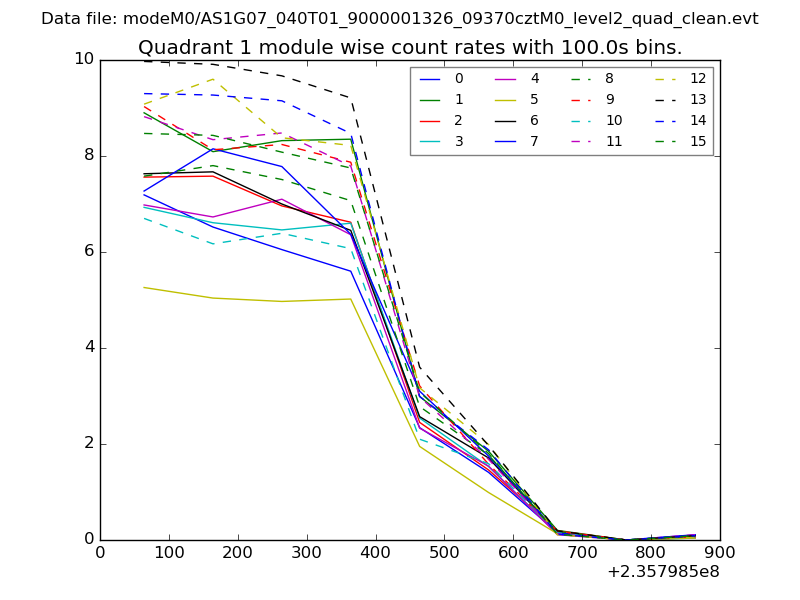
| Module-wise count rates for Quadrant A Data is divided into 100 sec bins |
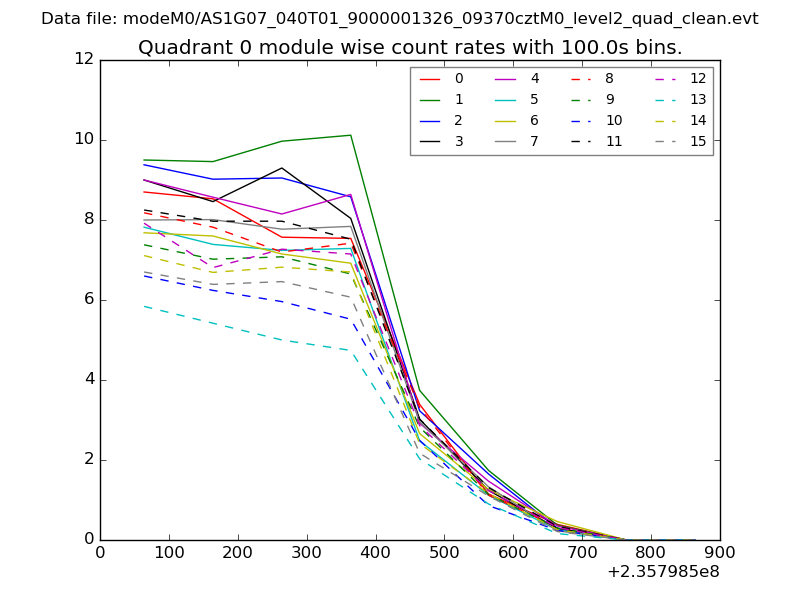 |
 |
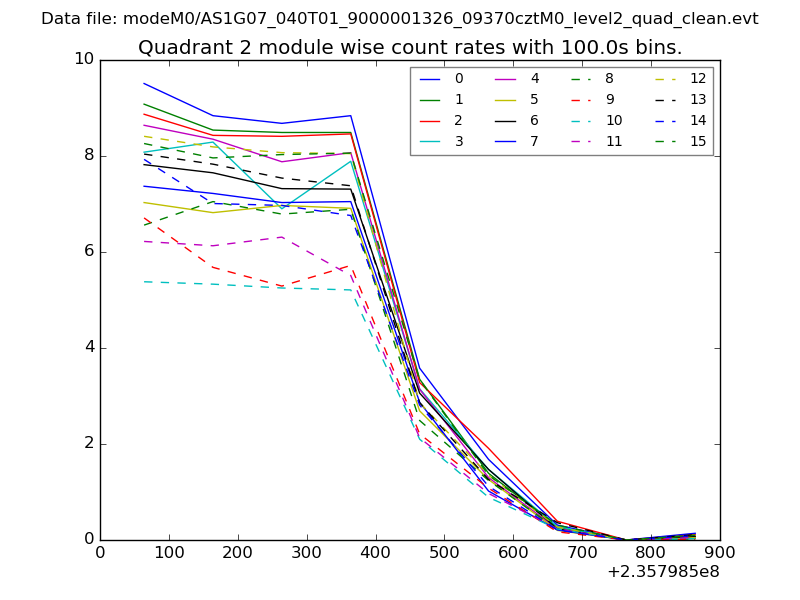
| Module-wise count rates for Quadrant B Data is divided into 100 sec bins |
 |
 |
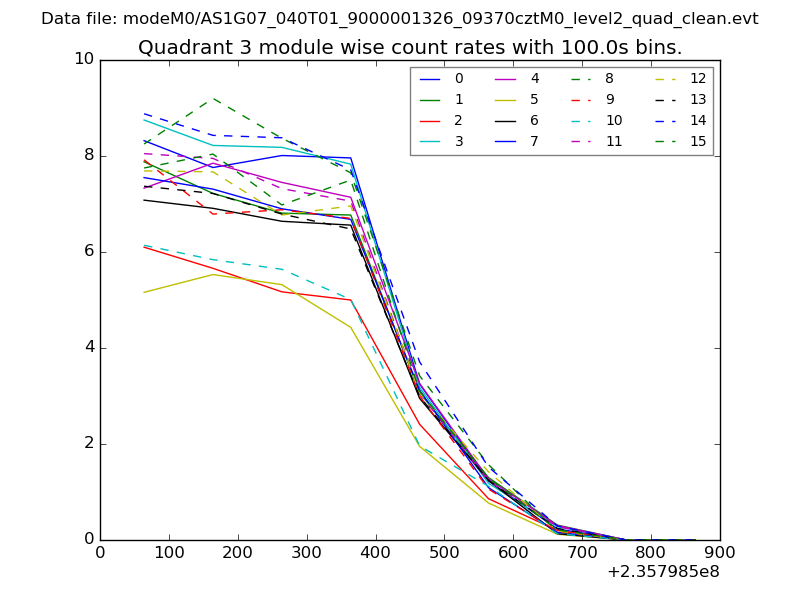
| Module-wise count rates for Quadrant C Data is divided into 100 sec bins |
 |
 |
| Module-wise count rates for Quadrant D Data is divided into 100 sec bins |
 |
 |
| Parameter | Plot |
|---|---|
| CZT HV Monitor | 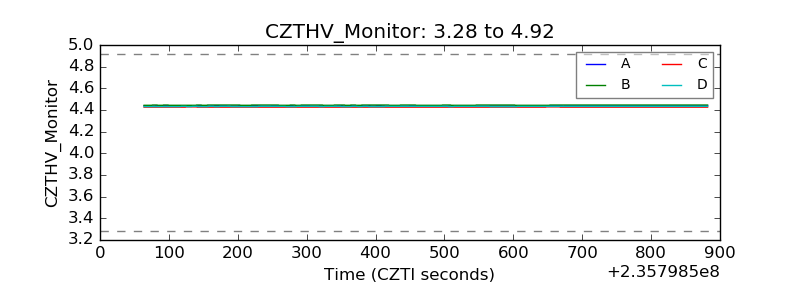 |
| D_VDD | 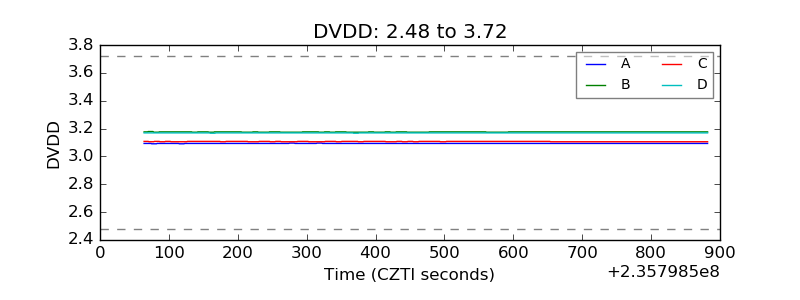 |
| Temperature 1 | 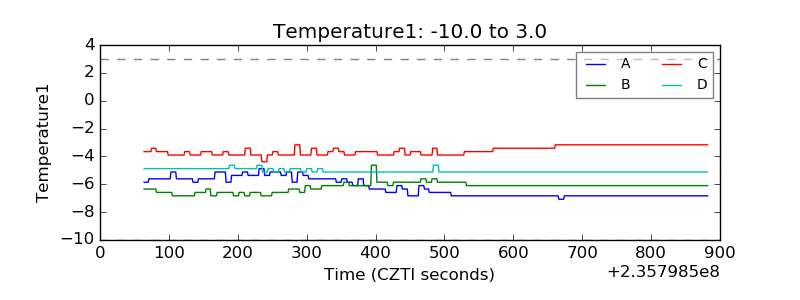 |
| Veto HV Monitor | 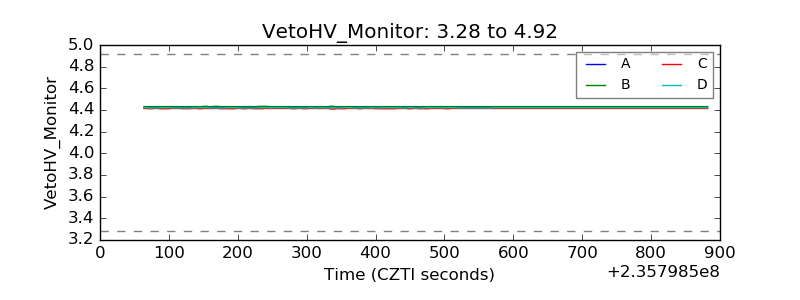 |
| Veto LLD | 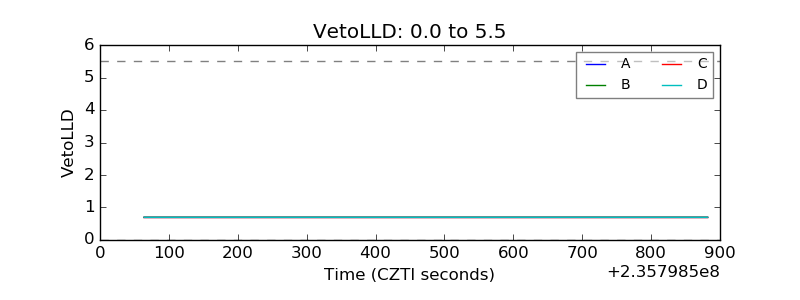 |
| Alpha Counter | 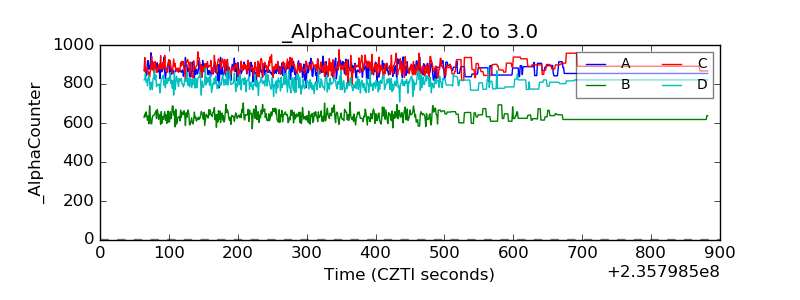 |
| _CPM_Rate | 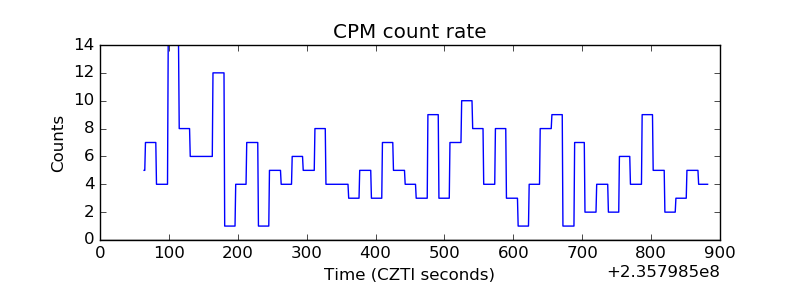 |
| CZT Counter | 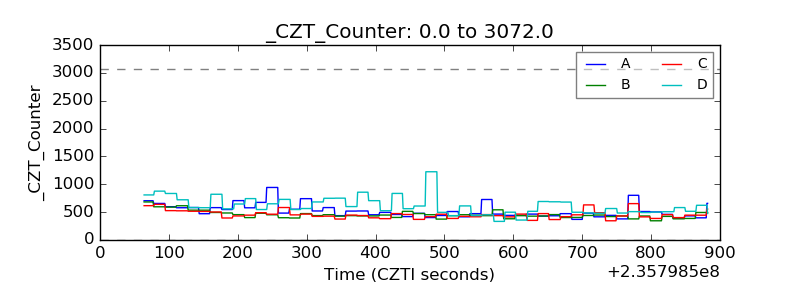 |
| +2.5 Volts monitor |  |
| +5 Volts monitor |  |
| _ROLL_ROT | 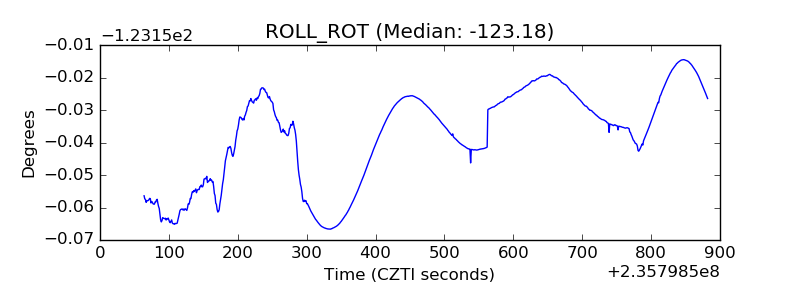 |
| _Roll_DEC | 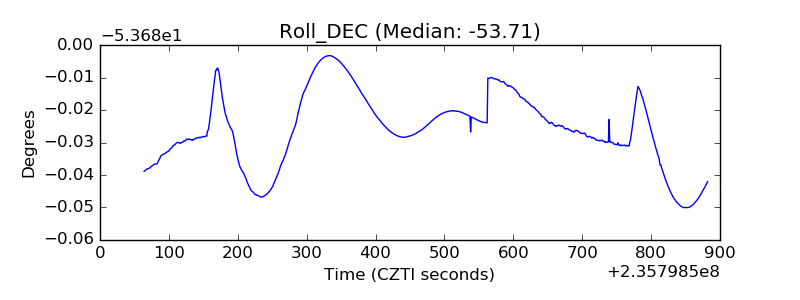 |
| _Roll_RA | 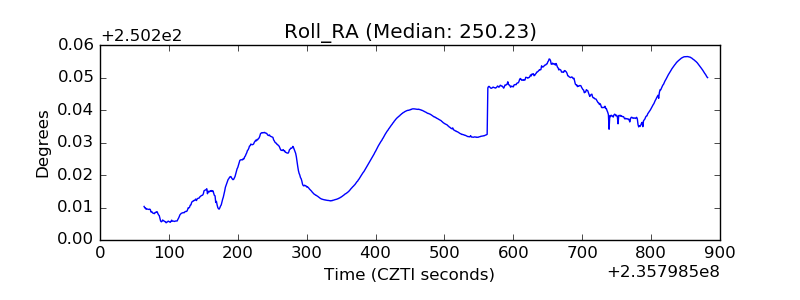 |
| Veto Counter | 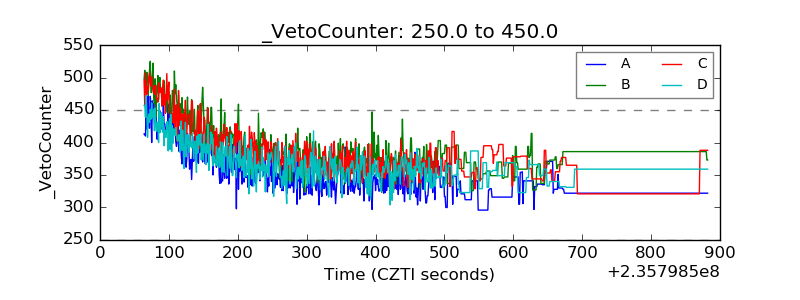 |