| Param | Original file | Final file |
|---|---|---|
| Filename | modeM0/AS1A03_009T01_9000001328cztM0_level2.fits | modeM0/AS1A03_009T01_9000001328cztM0_level2_quad_clean.evt |
| Size (bytes) | 177,125,760 | 175,199,040 |
| Size | 168.9 MB | 167.1 MB |
| Events in quadrant A | 1,038,362 | 1,015,720 |
| Events in quadrant B | 1,017,570 | 1,021,624 |
| Events in quadrant C | 1,041,596 | 986,998 |
| Events in quadrant D | 884,162 | 898,656 |
| Mode M0 | |||
|---|---|---|---|
| Quadrant | BADHDUFLAG | Total packets | Discarded packets |
| A | 0 | 50047 | 0 |
| B | 0 | 42003 | 0 |
| C | 0 | 46087 | 0 |
| D | 0 | 52055 | 0 |
| Mode SS | |||
|---|---|---|---|
| Quadrant | BADHDUFLAG | Total packets | Discarded packets |
| A | 0 | 406 | 0 |
| B | 0 | 408 | 0 |
| C | 0 | 408 | 0 |
| D | 0 | 408 | 0 |
| Mode M9 | |||
|---|---|---|---|
| Quadrant | BADHDUFLAG | Total packets | Discarded packets |
| A | 0 | 16 | 0 |
| B | 0 | 16 | 0 |
| C | 0 | 15 | 0 |
| D | 0 | 16 | 0 |
| Quadrant | Total seconds | Saturated seconds | Saturation percentage |
|---|---|---|---|
| A | 20065 | 312 | 1.554946% |
| B | 20089 | 314 | 1.563044% |
| C | 20077 | 280 | 1.394631% |
| D | 20062 | 613 | 3.055528% |
Noise dominated data is calculated using 1-second bins in cleaned event files. If a bin has >2000 counts, and if more than 50% of those come from <1% of pixels, then it is considered to be noise-dominated and hence unusable.
| Quadrant | # 1 sec bins | Bins with >0 counts | Bins with >2000 counts | High rate bins dominated by noise | Noise dominated (total time) | Noise dominated (detector-on time) | Marked lightcurve |
|---|---|---|---|---|---|---|---|
| A | 21668 | 20145 | 0 | 0 | 0.00% | 0.00% | 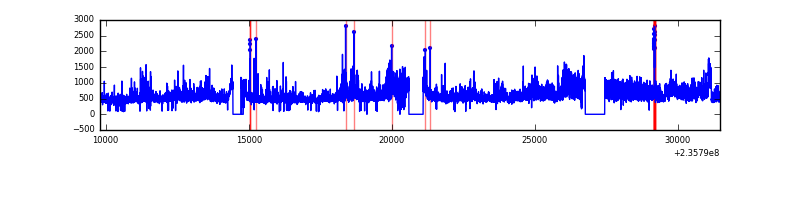 |
| B | 21668 | 20147 | 0 | 0 | 0.00% | 0.00% | 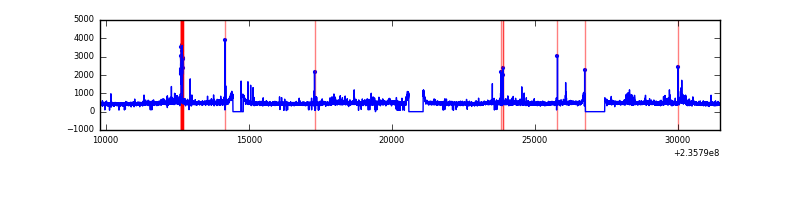 |
| C | 21668 | 20145 | 0 | 0 | 0.00% | 0.00% |  |
| D | 21668 | 20145 | 0 | 0 | 0.00% | 0.00% | 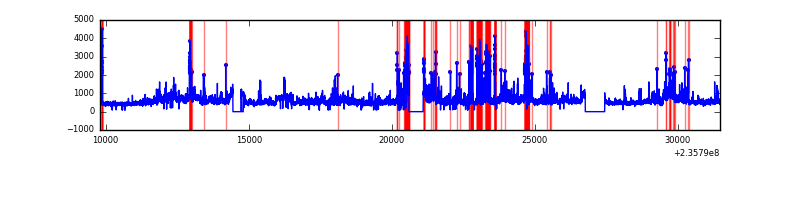 |
Top three noisy pixels from each quadrant. If the there are fewer than three noisy pixels in the level2.evt file, extra rows are filled as -1
| Pixel properties | Quadrant properties | ||||||
|---|---|---|---|---|---|---|---|
| Quadrant | DetID | PixID | Counts | Sigma | Mean | Median | Sigma |
| A | 0 | 29 | 997 | 10.72 | 269 | 252 | 69.5 |
| A | 7 | 110 | 850 | 8.6 | 269 | 252 | 69.5 |
| A | 9 | 19 | 792 | 7.77 | 269 | 252 | 69.5 |
| B | 2 | 9 | 842 | 10.49 | 268 | 254 | 56.0 |
| B | 14 | 254 | 735 | 8.58 | 268 | 254 | 56.0 |
| B | 12 | 226 | 721 | 8.33 | 268 | 254 | 56.0 |
| C | 1 | 80 | 809 | 7.51 | 274 | 253 | 74.1 |
| C | 1 | 81 | 774 | 7.03 | 274 | 253 | 74.1 |
| C | 12 | 241 | 755 | 6.78 | 274 | 253 | 74.1 |
| D | 1 | 19 | 694 | 6.69 | 251 | 228 | 69.7 |
| D | 3 | 14 | 690 | 6.63 | 251 | 228 | 69.7 |
| D | 6 | 231 | 656 | 6.14 | 251 | 228 | 69.7 |
Histogram calculated using DETX and DETY for each event in the final _common_clean file
| Quadrant A |  |
 |
Quadrant B |
|---|---|---|---|
| Quadrant D | 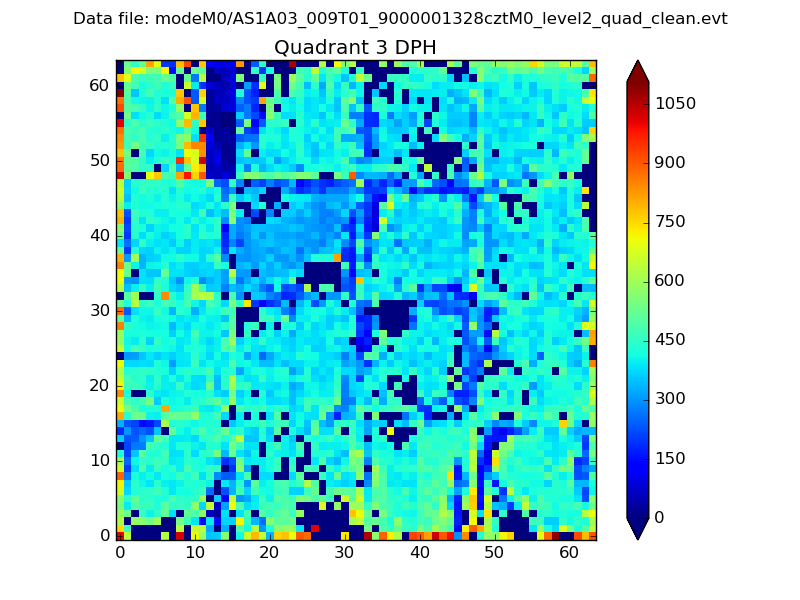 |
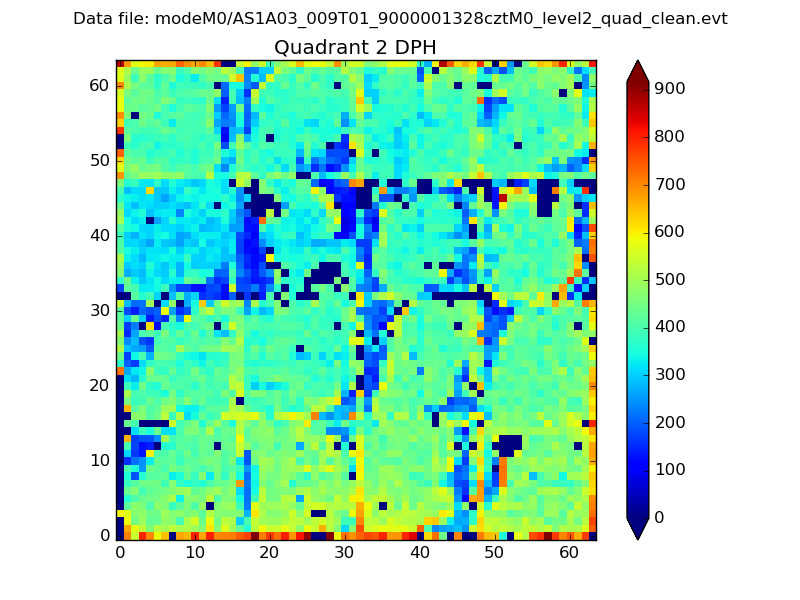 |
Quadrant C |
| Plot type | Count rate plots | Images |
|---|---|---|
| Comparison with Poisson distribution Blue bars denote a histogram of data divided into 1 sec bins. Red curve is a Poisson curve with rate = median count rate of data. |
 |
 |
| Quadrant-wise count rates Data is divided into 100 sec bins |
 |
|
| Module-wise count rates for Quadrant A Data is divided into 100 sec bins |
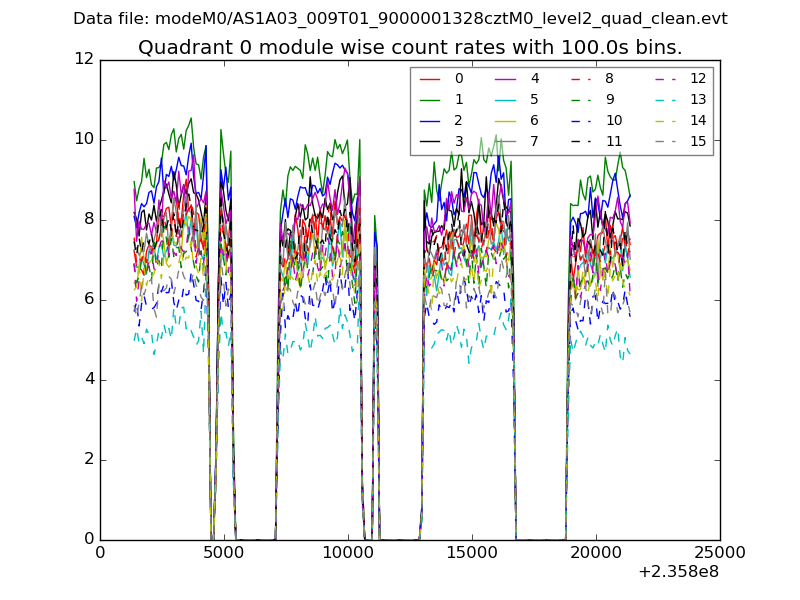 |
 |
| Module-wise count rates for Quadrant B Data is divided into 100 sec bins |
 |
 |
| Module-wise count rates for Quadrant C Data is divided into 100 sec bins |
 |
 |
| Module-wise count rates for Quadrant D Data is divided into 100 sec bins |
 |
 |
| Parameter | Plot |
|---|---|
| CZT HV Monitor | 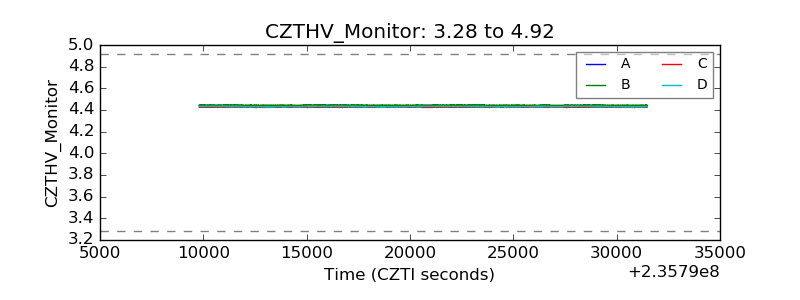 |
| D_VDD | 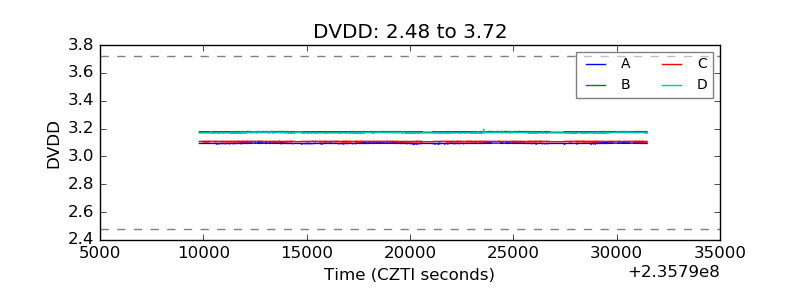 |
| Temperature 1 |  |
| Veto HV Monitor |  |
| Veto LLD |  |
| Alpha Counter | 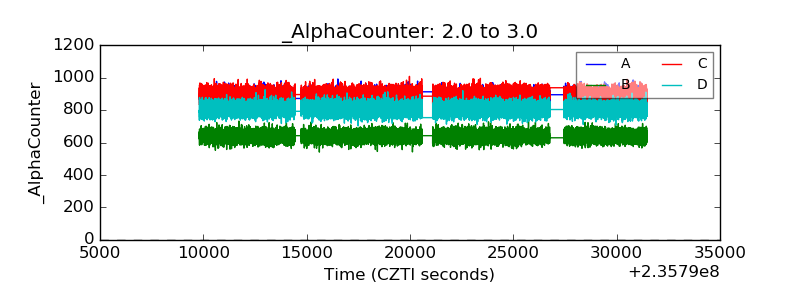 |
| _CPM_Rate |  |
| CZT Counter |  |
| +2.5 Volts monitor |  |
| +5 Volts monitor |  |
| _ROLL_ROT | 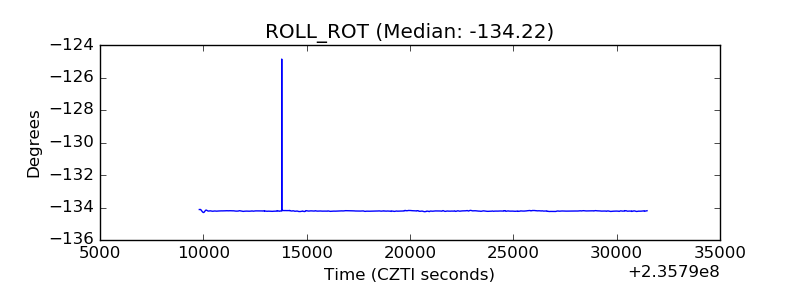 |
| _Roll_DEC |  |
| _Roll_RA | 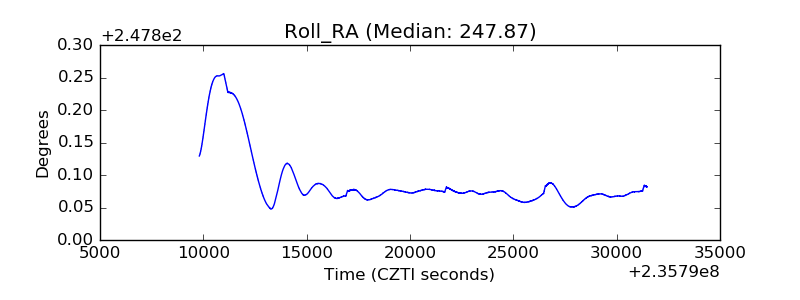 |
| Veto Counter |  |