| Param | Original file | Final file |
|---|---|---|
| Filename | modeM0/AS1A03_009T01_9000001328_09373cztM0_level2.evt | modeM0/AS1A03_009T01_9000001328_09373cztM0_level2_quad_clean.evt |
| Size (bytes) | 1,164,807,360 | 187,453,440 |
| Size | 1.1 GB | 178.8 MB |
| Events in quadrant A | 9,563,244 | 1,160,787 |
| Events in quadrant B | 7,099,036 | 1,183,595 |
| Events in quadrant C | 7,753,768 | 1,176,888 |
| Events in quadrant D | 9,843,592 | 1,116,954 |
| Mode M0 | |||
|---|---|---|---|
| Quadrant | BADHDUFLAG | Total packets | Discarded packets |
| A | 0 | 38703 | 202 |
| B | 0 | 31333 | 182 |
| C | 0 | 34446 | 297 |
| D | 0 | 39581 | 321 |
| Mode SS | |||
|---|---|---|---|
| Quadrant | BADHDUFLAG | Total packets | Discarded packets |
| A | 0 | 306 | 2 |
| B | 0 | 306 | 0 |
| C | 0 | 306 | 0 |
| D | 0 | 306 | 2 |
| Mode M9 | |||
|---|---|---|---|
| Quadrant | BADHDUFLAG | Total packets | Discarded packets |
| A | 0 | 12 | 0 |
| B | 0 | 12 | 0 |
| C | 0 | 12 | 1 |
| D | 0 | 12 | 0 |
| Quadrant | Total seconds | Saturated seconds | Saturation percentage |
|---|---|---|---|
| A | 15068 | 209 | 1.387045% |
| B | 15058 | 165 | 1.095763% |
| C | 15050 | 141 | 0.936877% |
| D | 15032 | 480 | 3.193188% |
Noise dominated data is calculated using 1-second bins in cleaned event files. If a bin has >2000 counts, and if more than 50% of those come from <1% of pixels, then it is considered to be noise-dominated and hence unusable.
| Quadrant | # 1 sec bins | Bins with >0 counts | Bins with >2000 counts | High rate bins dominated by noise | Noise dominated (total time) | Noise dominated (detector-on time) | Marked lightcurve |
|---|---|---|---|---|---|---|---|
| A | 16328 | 15143 | 20 | 20 | 0.12% | 0.13% | 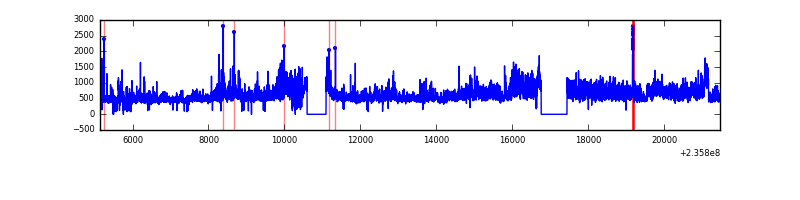 |
| B | 16328 | 15146 | 7 | 7 | 0.04% | 0.05% | 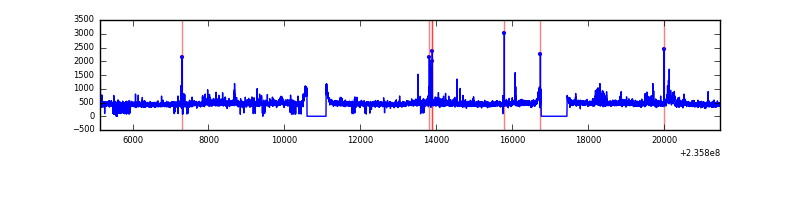 |
| C | 16328 | 15139 | 2 | 2 | 0.01% | 0.01% | 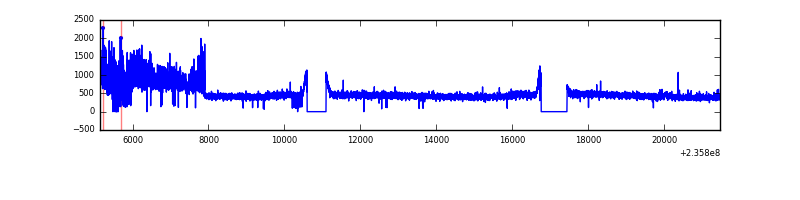 |
| D | 16328 | 15141 | 315 | 315 | 1.93% | 2.08% | 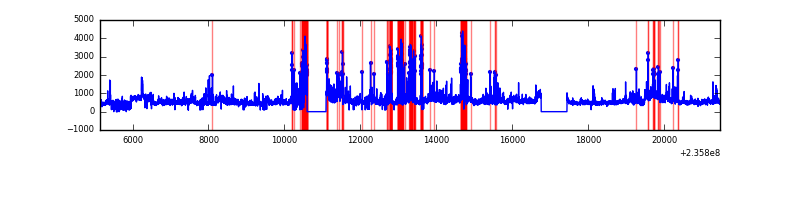 |
Top three noisy pixels from each quadrant. If the there are fewer than three noisy pixels in the level2.evt file, extra rows are filled as -1
| Pixel properties | Quadrant properties | ||||||
|---|---|---|---|---|---|---|---|
| Quadrant | DetID | PixID | Counts | Sigma | Mean | Median | Sigma |
| A | 8 | 5 | 2652665 | 7607.3 | 1711 | 1674 | 348.5 |
| A | 1 | 162 | 122974 | 348.08 | 1711 | 1674 | 348.5 |
| A | 15 | 174 | 36169 | 98.99 | 1711 | 1674 | 348.5 |
| B | 0 | 214 | 154830 | 465.17 | 1725 | 1683 | 329.2 |
| B | 0 | 219 | 56073 | 165.21 | 1725 | 1683 | 329.2 |
| B | 0 | 187 | 44825 | 131.04 | 1725 | 1683 | 329.2 |
| C | 9 | 68 | 1230122 | 3183.77 | 1666 | 1670 | 385.8 |
| C | 10 | 22 | 15721 | 36.42 | 1666 | 1670 | 385.8 |
| C | 13 | 61 | 12588 | 28.3 | 1666 | 1670 | 385.8 |
| D | 8 | 195 | 1459365 | 3536.07 | 1627 | 1581 | 412.3 |
| D | 1 | 52 | 1269433 | 3075.37 | 1627 | 1581 | 412.3 |
| D | 7 | 71 | 346325 | 836.23 | 1627 | 1581 | 412.3 |
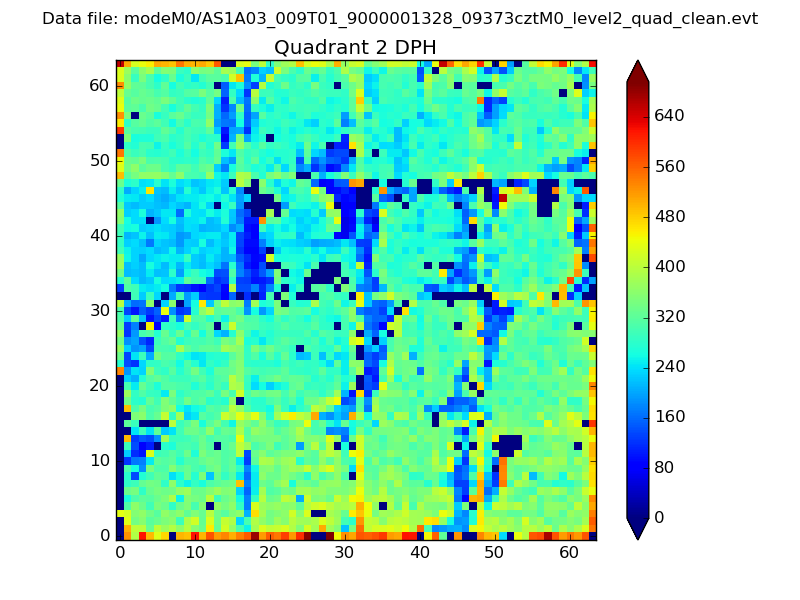
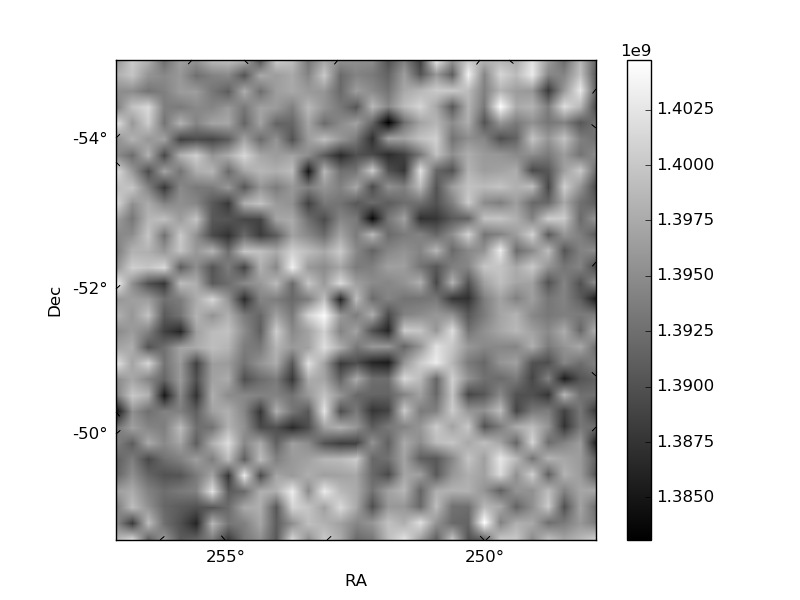
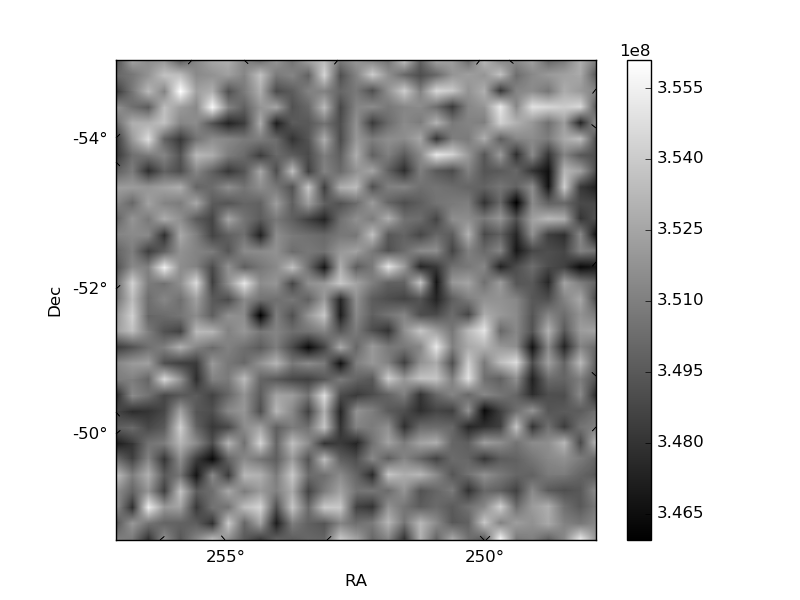
Histogram calculated using DETX and DETY for each event in the final _common_clean file
| Quadrant A | 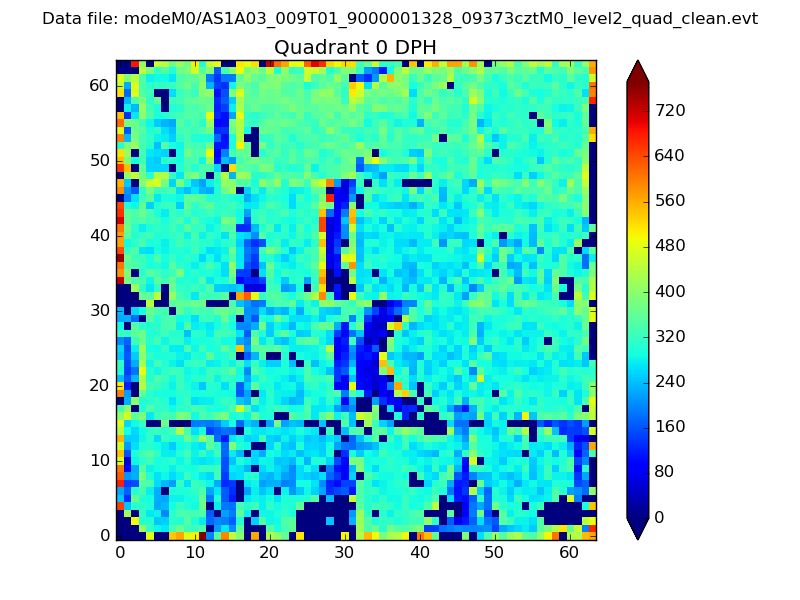 |
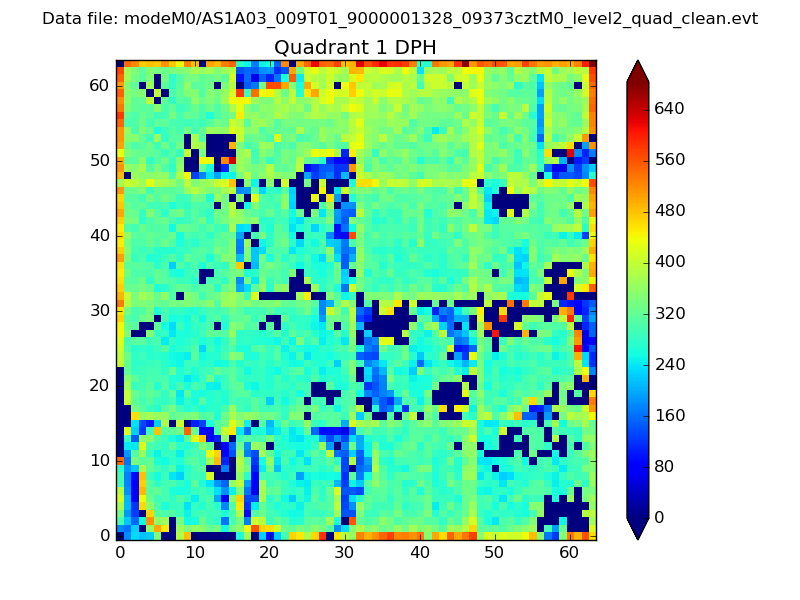 |
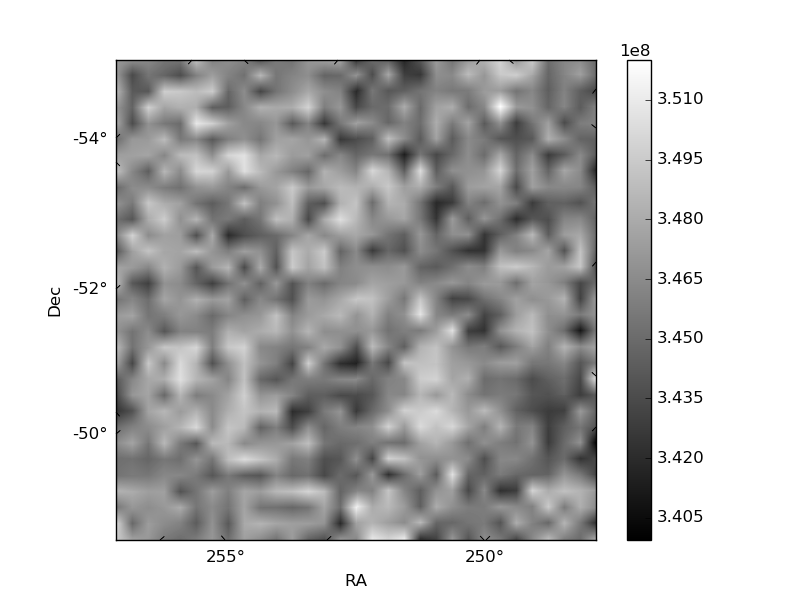
Quadrant B |
|---|---|---|---|
| Quadrant D | 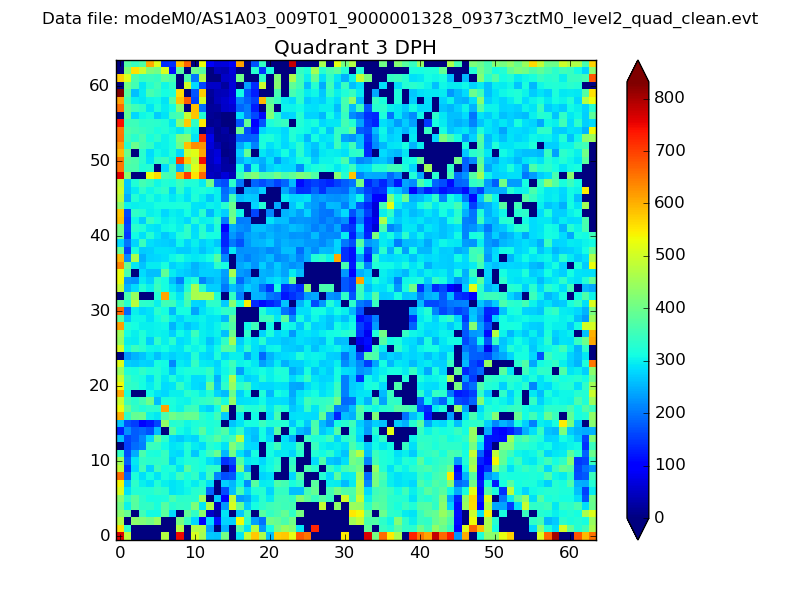 |
 |
Quadrant C |
| Plot type | Count rate plots | Images |
|---|---|---|
| Comparison with Poisson distribution Blue bars denote a histogram of data divided into 1 sec bins. Red curve is a Poisson curve with rate = median count rate of data. |
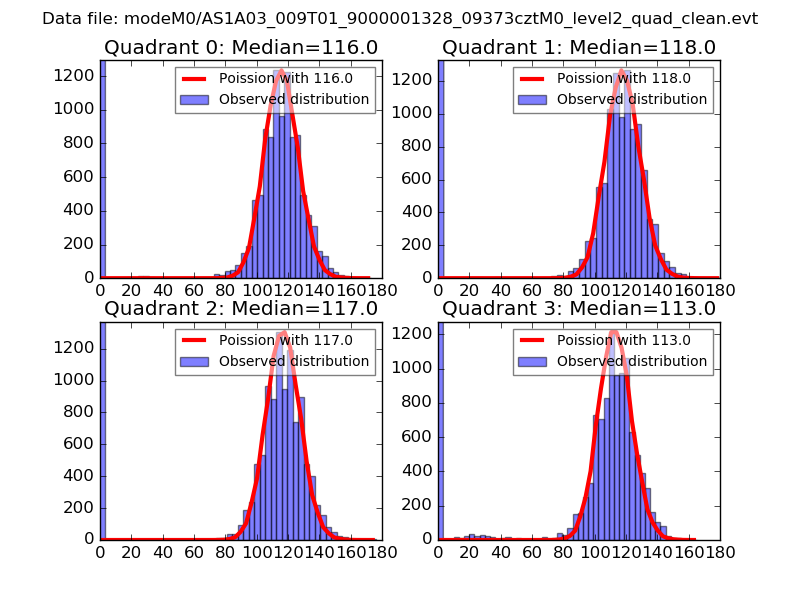 |
 |
| Quadrant-wise count rates Data is divided into 100 sec bins |
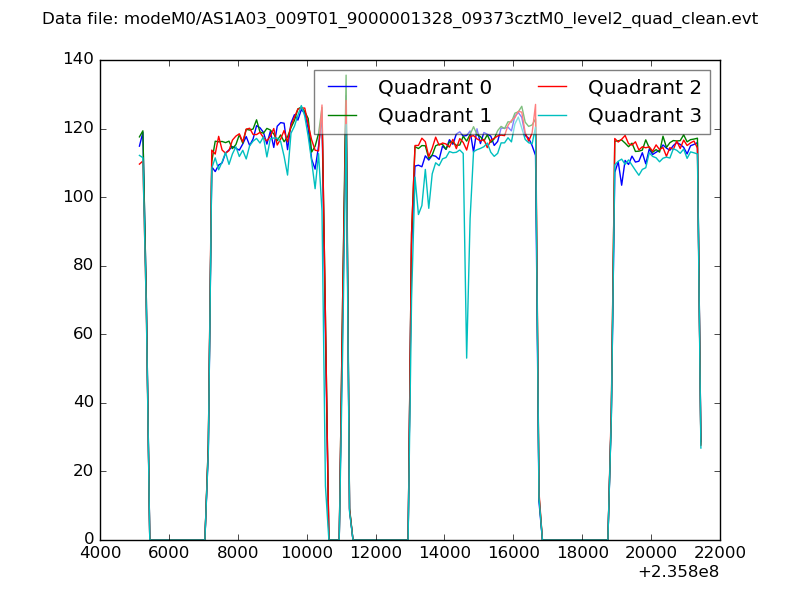 |
|
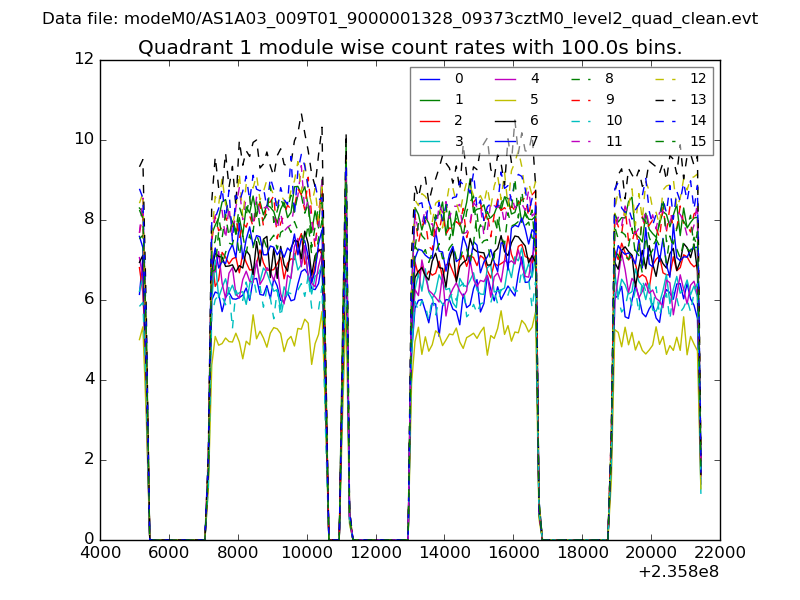
| Module-wise count rates for Quadrant A Data is divided into 100 sec bins |
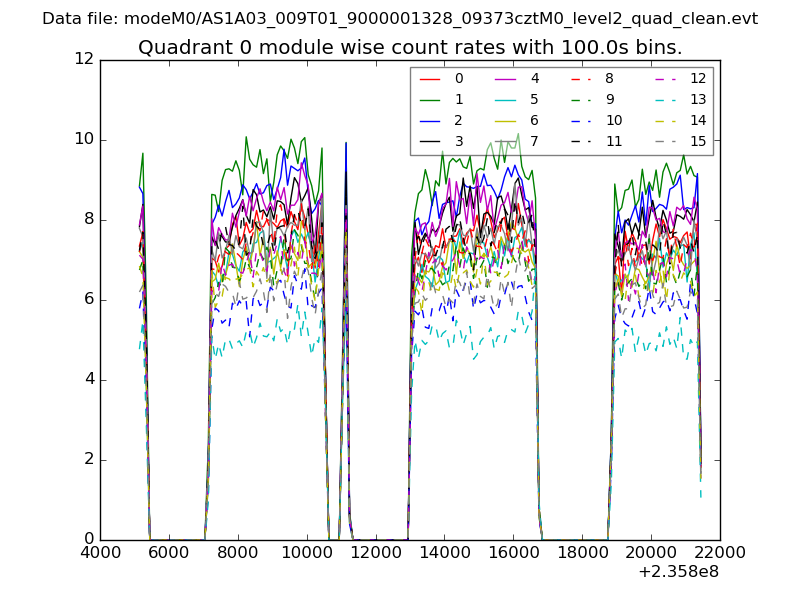 |
 |
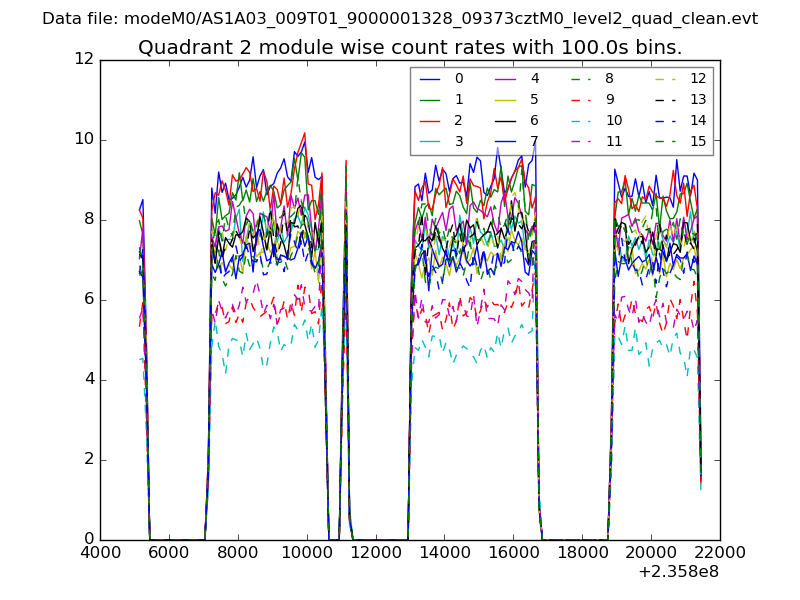
| Module-wise count rates for Quadrant B Data is divided into 100 sec bins |
 |
 |
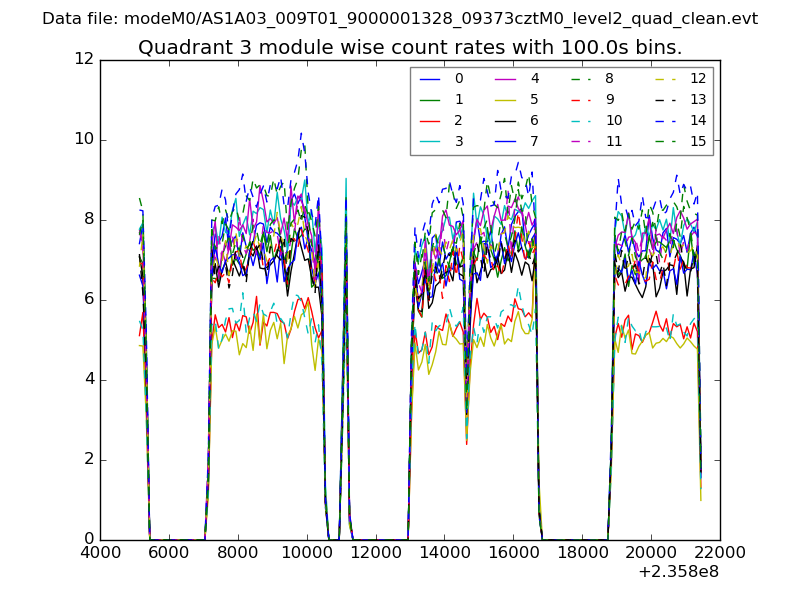
| Module-wise count rates for Quadrant C Data is divided into 100 sec bins |
 |
 |
| Module-wise count rates for Quadrant D Data is divided into 100 sec bins |
 |
 |
| Parameter | Plot |
|---|---|
| CZT HV Monitor | 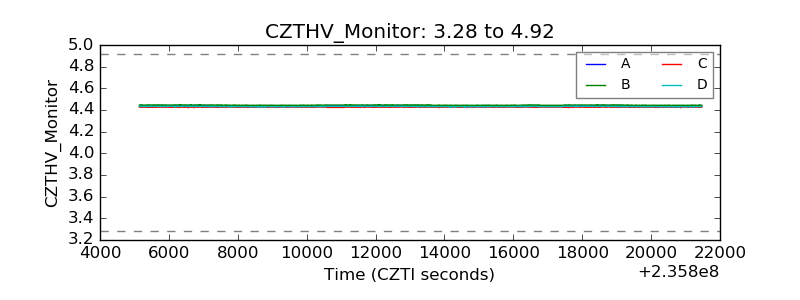 |
| D_VDD | 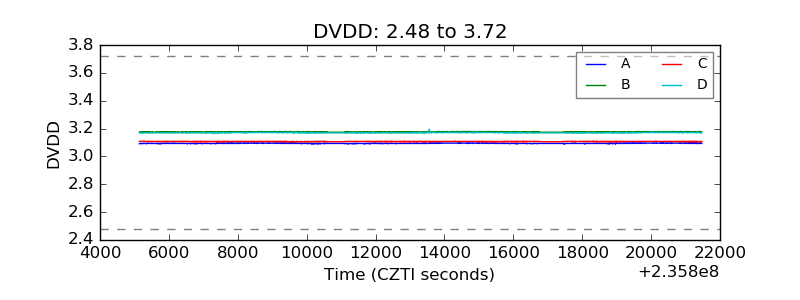 |
| Temperature 1 | 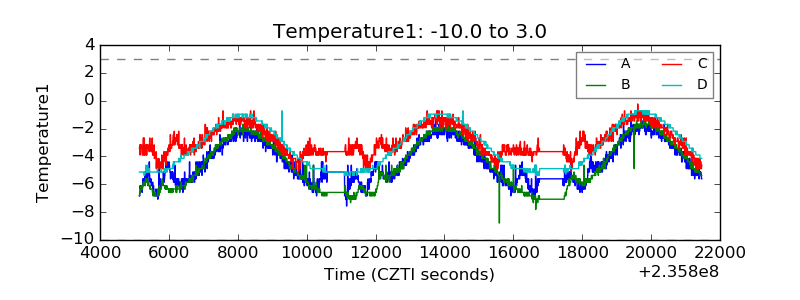 |
| Veto HV Monitor | 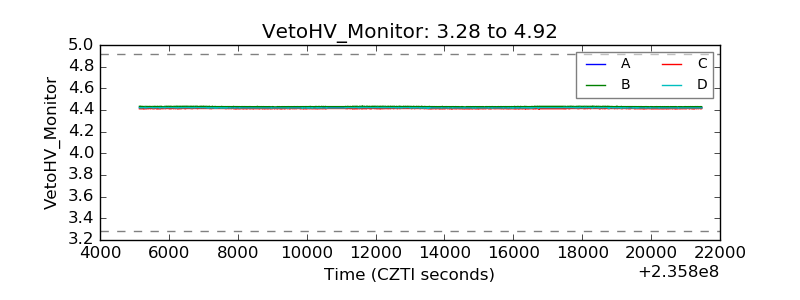 |
| Veto LLD | 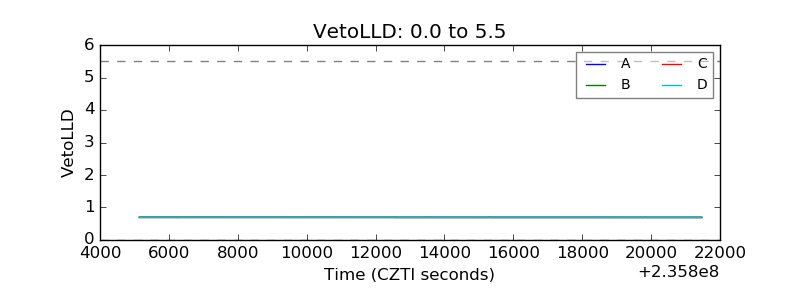 |
| Alpha Counter | 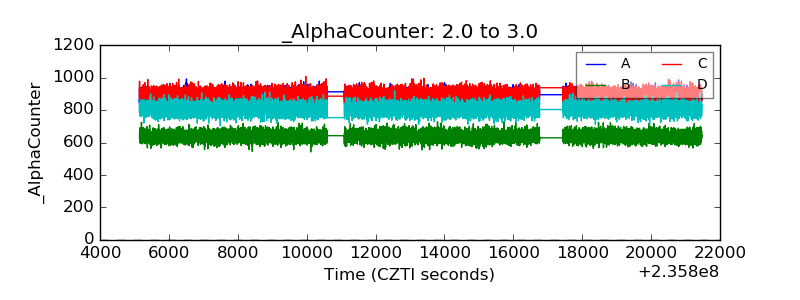 |
| _CPM_Rate | 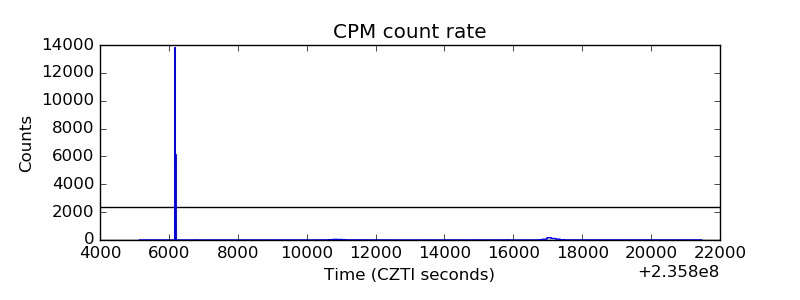 |
| CZT Counter | 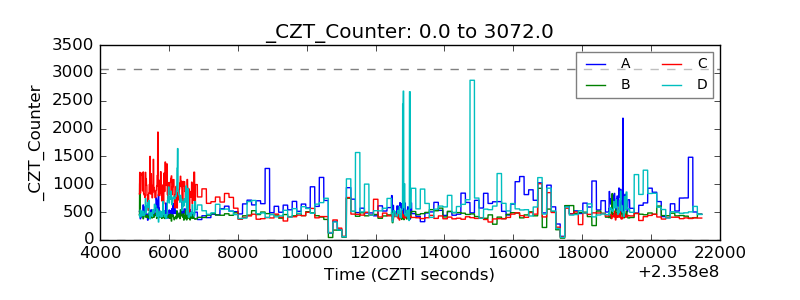 |
| +2.5 Volts monitor | 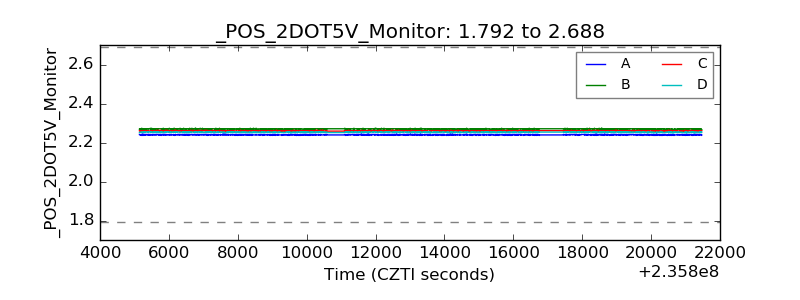 |
| +5 Volts monitor |  |
| _ROLL_ROT | 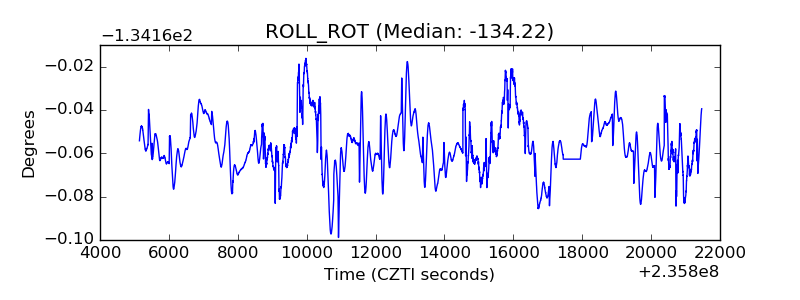 |
| _Roll_DEC | 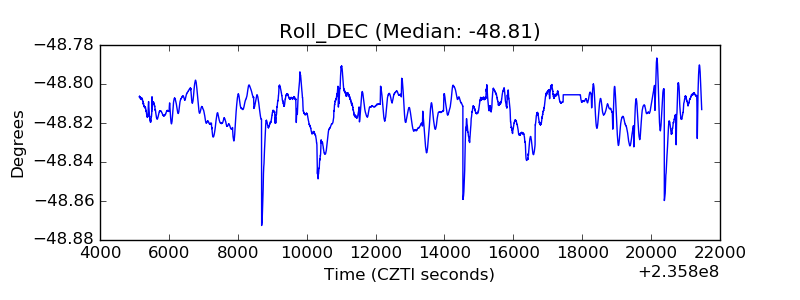 |
| _Roll_RA | 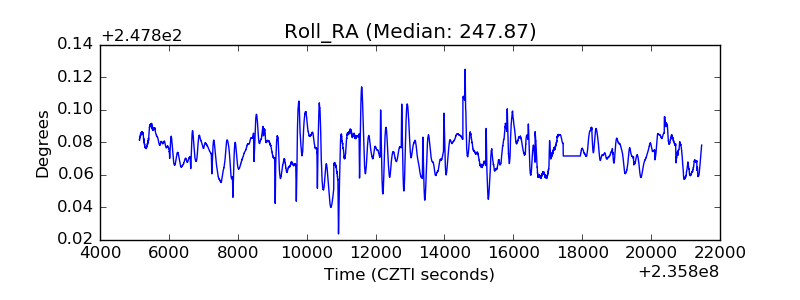 |
| Veto Counter | 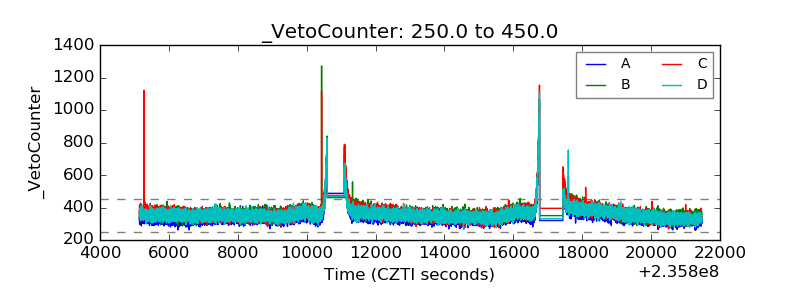 |