| Param | Original file | Final file |
|---|---|---|
| Filename | modeM0/AS1A03_057T01_9000001330cztM0_level2.fits | modeM0/AS1A03_057T01_9000001330cztM0_level2_quad_clean.evt |
| Size (bytes) | 469,883,520 | 496,048,320 |
| Size | 448.1 MB | 473.1 MB |
| Events in quadrant A | 2,828,644 | 3,031,285 |
| Events in quadrant B | 2,769,500 | 3,028,190 |
| Events in quadrant C | 2,789,847 | 2,866,354 |
| Events in quadrant D | 2,393,906 | 2,649,549 |
| Mode M9 | |||
|---|---|---|---|
| Quadrant | BADHDUFLAG | Total packets | Discarded packets |
| A | 0 | 100 | 0 |
| B | 0 | 100 | 0 |
| C | 0 | 100 | 0 |
| D | 0 | 100 | 0 |
| Mode M0 | |||
|---|---|---|---|
| Quadrant | BADHDUFLAG | Total packets | Discarded packets |
| A | 0 | 121979 | 0 |
| B | 0 | 106455 | 0 |
| C | 0 | 102840 | 0 |
| D | 0 | 120251 | 0 |
| Mode SS | |||
|---|---|---|---|
| Quadrant | BADHDUFLAG | Total packets | Discarded packets |
| A | 0 | 1028 | 0 |
| B | 0 | 1024 | 0 |
| C | 0 | 1026 | 0 |
| D | 0 | 1023 | 0 |
| Quadrant | Total seconds | Saturated seconds | Saturation percentage |
|---|---|---|---|
| A | 50126 | 709 | 1.414436% |
| B | 50300 | 490 | 0.974155% |
| C | 50329 | 242 | 0.480836% |
| D | 50179 | 1005 | 2.002830% |
Noise dominated data is calculated using 1-second bins in cleaned event files. If a bin has >2000 counts, and if more than 50% of those come from <1% of pixels, then it is considered to be noise-dominated and hence unusable.
| Quadrant | # 1 sec bins | Bins with >0 counts | Bins with >2000 counts | High rate bins dominated by noise | Noise dominated (total time) | Noise dominated (detector-on time) | Marked lightcurve |
|---|---|---|---|---|---|---|---|
| A | 62639 | 50854 | 0 | 0 | 0.00% | 0.00% |  |
| B | 62639 | 50982 | 0 | 0 | 0.00% | 0.00% |  |
| C | 62639 | 51035 | 0 | 0 | 0.00% | 0.00% |  |
| D | 62639 | 50883 | 0 | 0 | 0.00% | 0.00% |  |
Top three noisy pixels from each quadrant. If the there are fewer than three noisy pixels in the level2.evt file, extra rows are filled as -1
| Pixel properties | Quadrant properties | ||||||
|---|---|---|---|---|---|---|---|
| Quadrant | DetID | PixID | Counts | Sigma | Mean | Median | Sigma |
| A | 0 | 29 | 2679 | 10.8 | 736 | 692 | 184.0 |
| A | 7 | 110 | 2318 | 8.84 | 736 | 692 | 184.0 |
| A | 0 | 30 | 2129 | 7.81 | 736 | 692 | 184.0 |
| B | 2 | 9 | 2399 | 11.76 | 732 | 698 | 144.6 |
| B | 3 | 17 | 1914 | 8.41 | 732 | 698 | 144.6 |
| B | 12 | 226 | 1909 | 8.37 | 732 | 698 | 144.6 |
| C | 1 | 81 | 2009 | 6.8 | 738 | 686 | 194.4 |
| C | 1 | 80 | 1960 | 6.55 | 738 | 686 | 194.4 |
| C | 9 | 188 | 1918 | 6.34 | 738 | 686 | 194.4 |
| D | 6 | 231 | 1843 | 6.67 | 682 | 622 | 183.1 |
| D | 7 | 3 | 1726 | 6.03 | 682 | 622 | 183.1 |
| D | 4 | 160 | 1701 | 5.89 | 682 | 622 | 183.1 |
Histogram calculated using DETX and DETY for each event in the final _common_clean file
| Quadrant A |  |
 |
Quadrant B |
|---|---|---|---|
| Quadrant D | 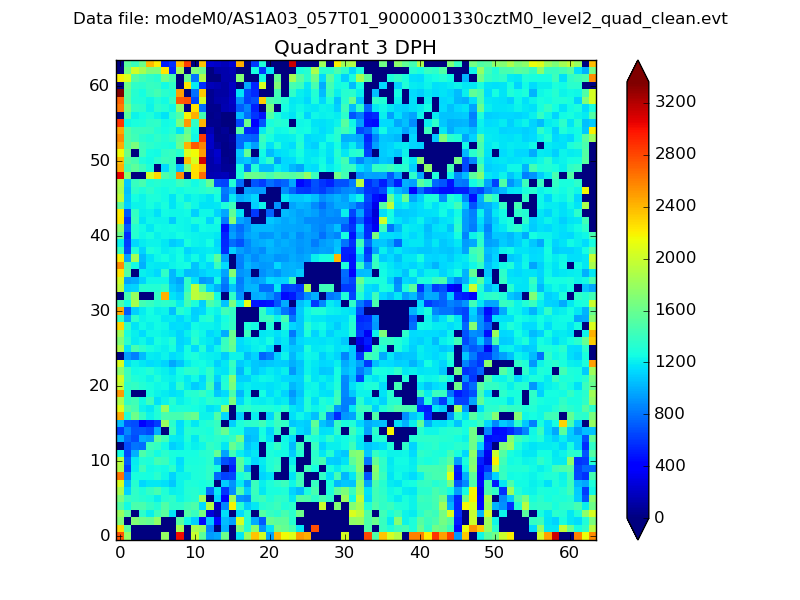 |
 |
Quadrant C |
| Plot type | Count rate plots | Images |
|---|---|---|
| Comparison with Poisson distribution Blue bars denote a histogram of data divided into 1 sec bins. Red curve is a Poisson curve with rate = median count rate of data. |
 |
 |
| Quadrant-wise count rates Data is divided into 100 sec bins |
 |
|
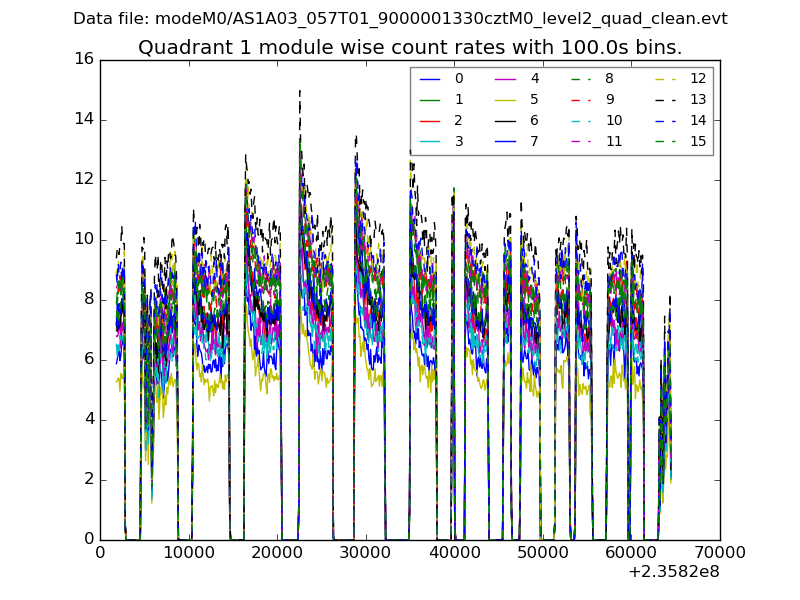
| Module-wise count rates for Quadrant A Data is divided into 100 sec bins |
 |
 |
| Module-wise count rates for Quadrant B Data is divided into 100 sec bins |
 |
 |
| Module-wise count rates for Quadrant C Data is divided into 100 sec bins |
 |
 |
| Module-wise count rates for Quadrant D Data is divided into 100 sec bins |
 |
 |
| Parameter | Plot |
|---|---|
| CZT HV Monitor |  |
| D_VDD |  |
| Temperature 1 |  |
| Veto HV Monitor |  |
| Veto LLD |  |
| Alpha Counter |  |
| _CPM_Rate |  |
| CZT Counter |  |
| +2.5 Volts monitor | 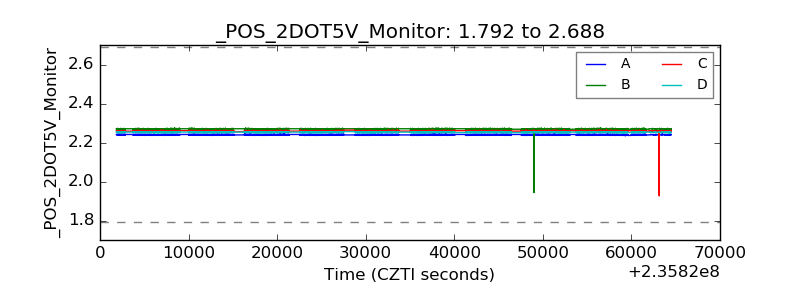 |
| +5 Volts monitor |  |
| _ROLL_ROT | 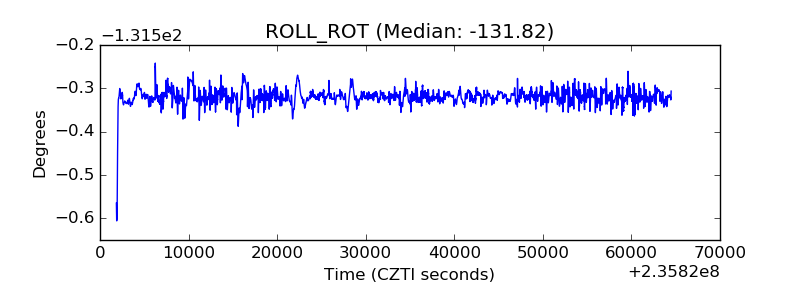 |
| _Roll_DEC |  |
| _Roll_RA |  |
| Veto Counter |  |