| Param | Original file | Final file |
|---|---|---|
| Filename | modeM0/AS1A03_057T01_9000001330_09374cztM0_level2.evt | modeM0/AS1A03_057T01_9000001330_09374cztM0_level2_quad_clean.evt |
| Size (bytes) | 444,600,000 | 82,517,760 |
| Size | 424.0 MB | 78.7 MB |
| Events in quadrant A | 3,981,260 | 518,875 |
| Events in quadrant B | 2,970,081 | 532,401 |
| Events in quadrant C | 2,741,576 | 528,388 |
| Events in quadrant D | 3,368,009 | 504,223 |
| Mode M9 | |||
|---|---|---|---|
| Quadrant | BADHDUFLAG | Total packets | Discarded packets |
| A | 0 | 16 | 0 |
| B | 0 | 16 | 0 |
| C | 0 | 16 | 0 |
| D | 0 | 17 | 1 |
| Mode M0 | |||
|---|---|---|---|
| Quadrant | BADHDUFLAG | Total packets | Discarded packets |
| A | 0 | 18005 | 2118 |
| B | 0 | 14132 | 1515 |
| C | 0 | 13626 | 1390 |
| D | 0 | 15773 | 2104 |
| Mode SS | |||
|---|---|---|---|
| Quadrant | BADHDUFLAG | Total packets | Discarded packets |
| A | 0 | 134 | 10 |
| B | 0 | 134 | 14 |
| C | 0 | 134 | 8 |
| D | 0 | 133 | 15 |
| Quadrant | Total seconds | Saturated seconds | Saturation percentage |
|---|---|---|---|
| A | 5867 | 126 | 2.147605% |
| B | 5970 | 73 | 1.222781% |
| C | 5976 | 50 | 0.836680% |
| D | 5892 | 96 | 1.629328% |
Noise dominated data is calculated using 1-second bins in cleaned event files. If a bin has >2000 counts, and if more than 50% of those come from <1% of pixels, then it is considered to be noise-dominated and hence unusable.
| Quadrant | # 1 sec bins | Bins with >0 counts | Bins with >2000 counts | High rate bins dominated by noise | Noise dominated (total time) | Noise dominated (detector-on time) | Marked lightcurve |
|---|---|---|---|---|---|---|---|
| A | 7645 | 6317 | 20 | 20 | 0.26% | 0.32% | 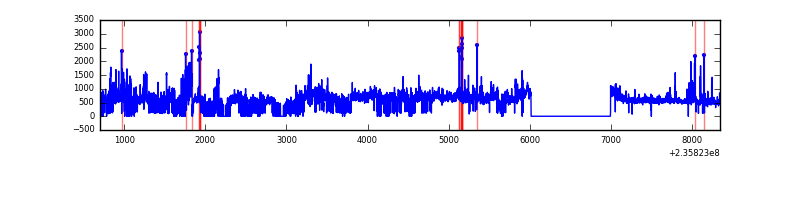 |
| B | 7645 | 6360 | 2 | 2 | 0.03% | 0.03% | 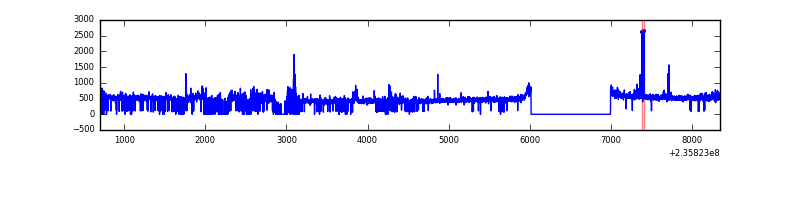 |
| C | 7644 | 6369 | 0 | 0 | 0.00% | 0.00% | 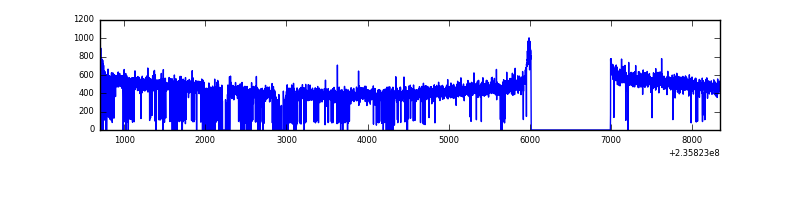 |
| D | 7645 | 6274 | 22 | 22 | 0.29% | 0.35% | 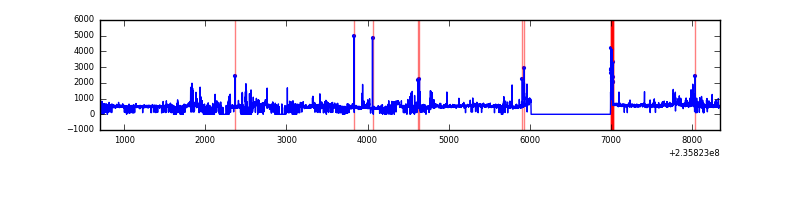 |
Top three noisy pixels from each quadrant. If the there are fewer than three noisy pixels in the level2.evt file, extra rows are filled as -1
| Pixel properties | Quadrant properties | ||||||
|---|---|---|---|---|---|---|---|
| Quadrant | DetID | PixID | Counts | Sigma | Mean | Median | Sigma |
| A | 8 | 5 | 1131382 | 7914.63 | 705 | 692 | 142.9 |
| A | 13 | 251 | 90865 | 631.2 | 705 | 692 | 142.9 |
| A | 5 | 16 | 22635 | 153.6 | 705 | 692 | 142.9 |
| B | 0 | 214 | 62874 | 448.72 | 722 | 705 | 138.5 |
| B | 4 | 173 | 46502 | 330.55 | 722 | 705 | 138.5 |
| B | 0 | 219 | 24318 | 170.43 | 722 | 705 | 138.5 |
| C | 13 | 61 | 5244 | 28.28 | 698 | 701 | 160.6 |
| C | 8 | 128 | 4733 | 25.1 | 698 | 701 | 160.6 |
| C | 8 | 222 | 4273 | 22.24 | 698 | 701 | 160.6 |
| D | 1 | 52 | 322623 | 1843.38 | 685 | 669 | 174.7 |
| D | 8 | 195 | 225557 | 1287.62 | 685 | 669 | 174.7 |
| D | 7 | 71 | 43652 | 246.1 | 685 | 669 | 174.7 |
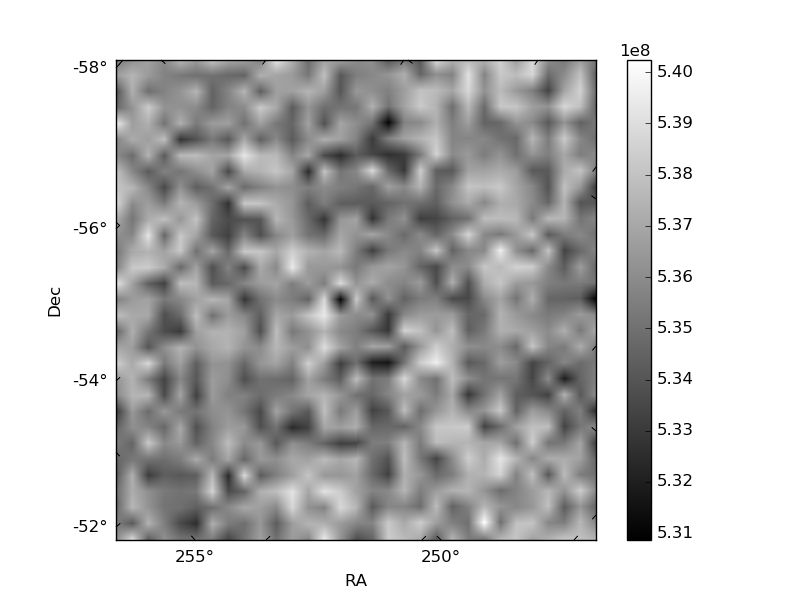
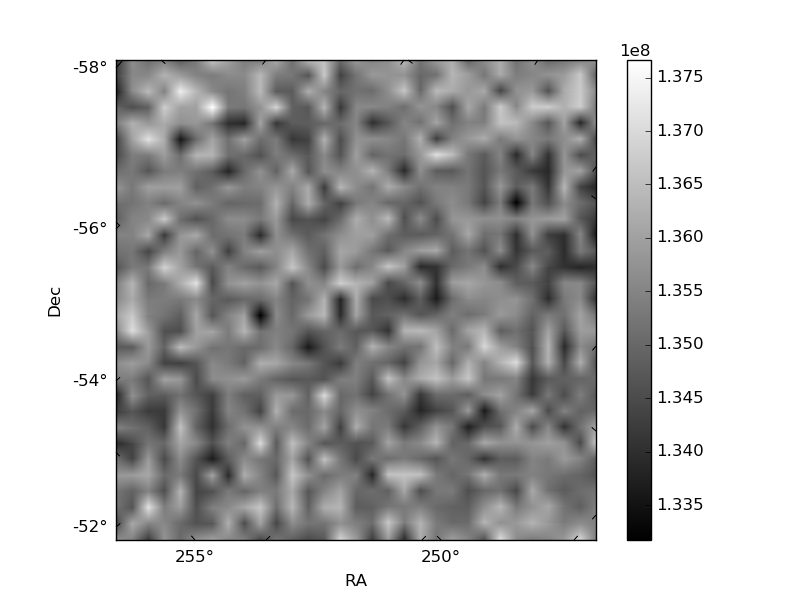
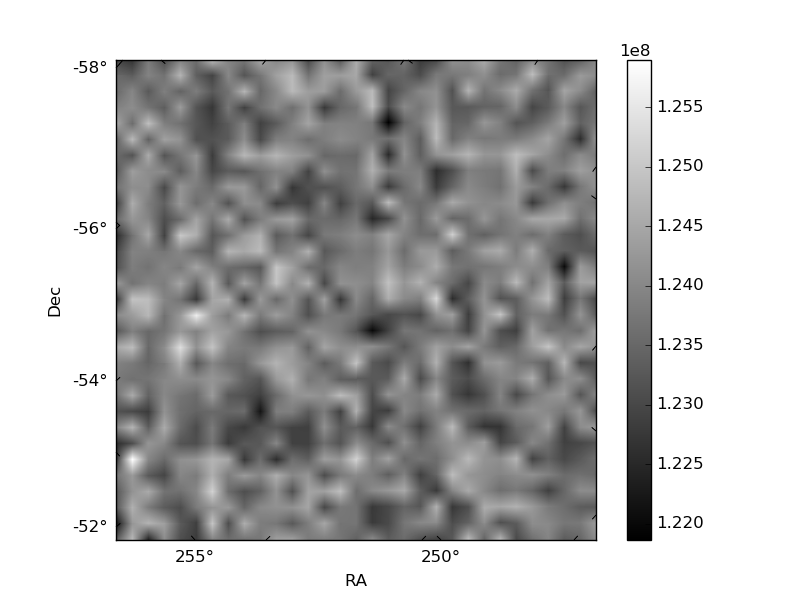
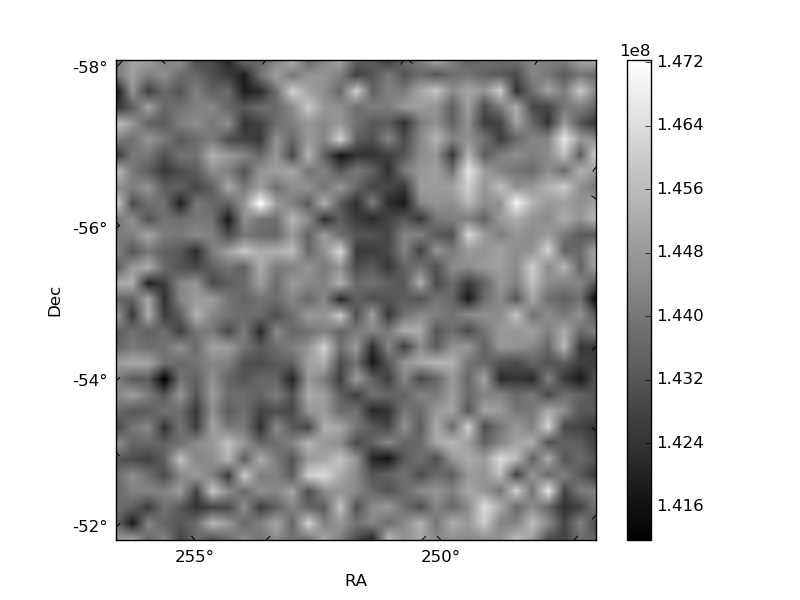
Histogram calculated using DETX and DETY for each event in the final _common_clean file
| Quadrant A | 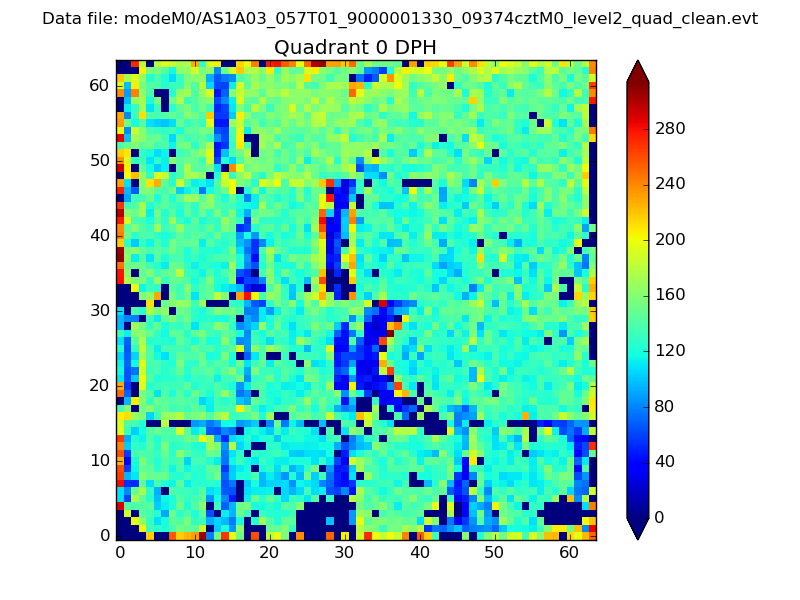 |
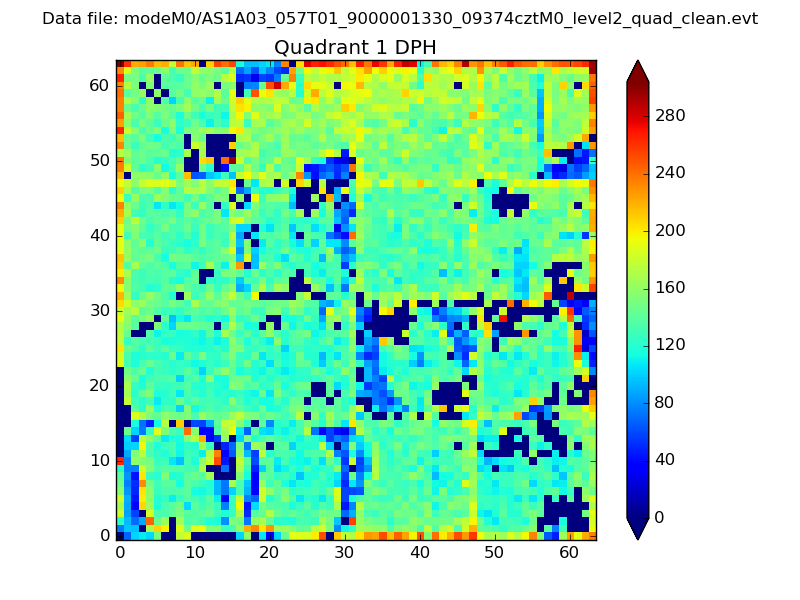 |
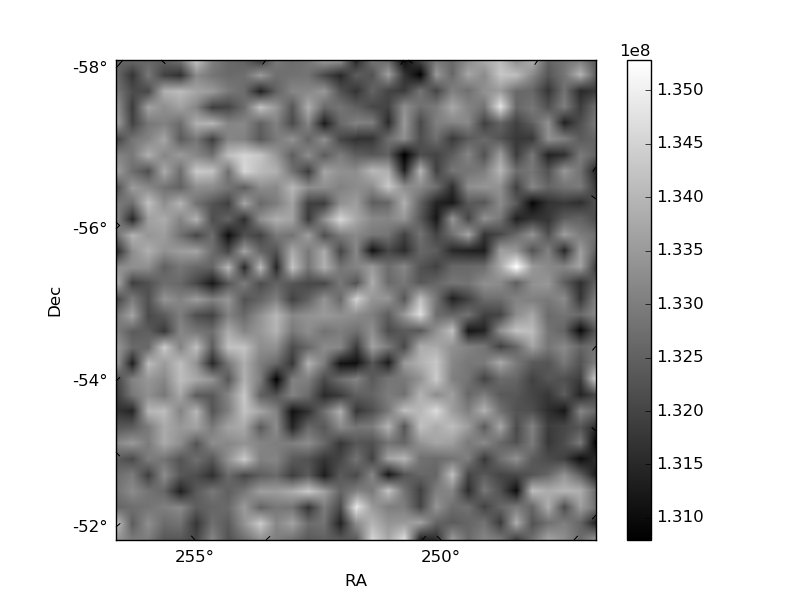
Quadrant B |
|---|---|---|---|
| Quadrant D | 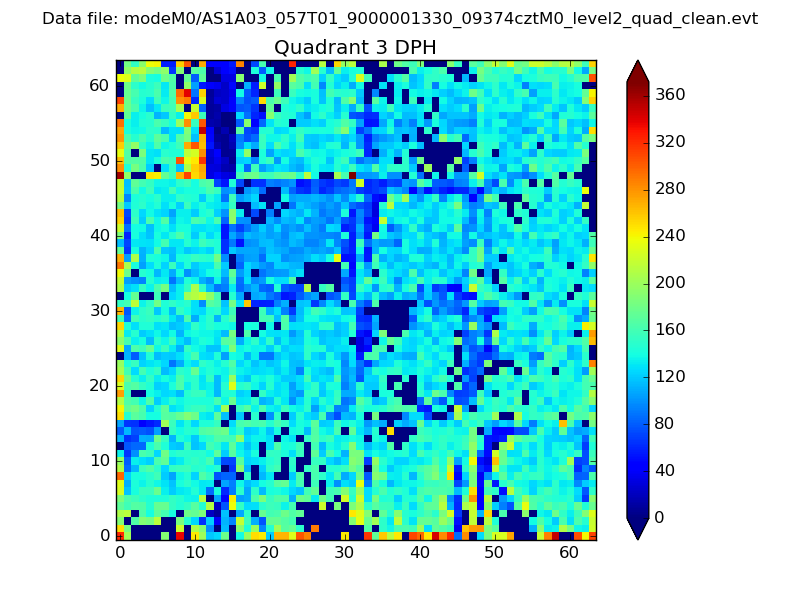 |
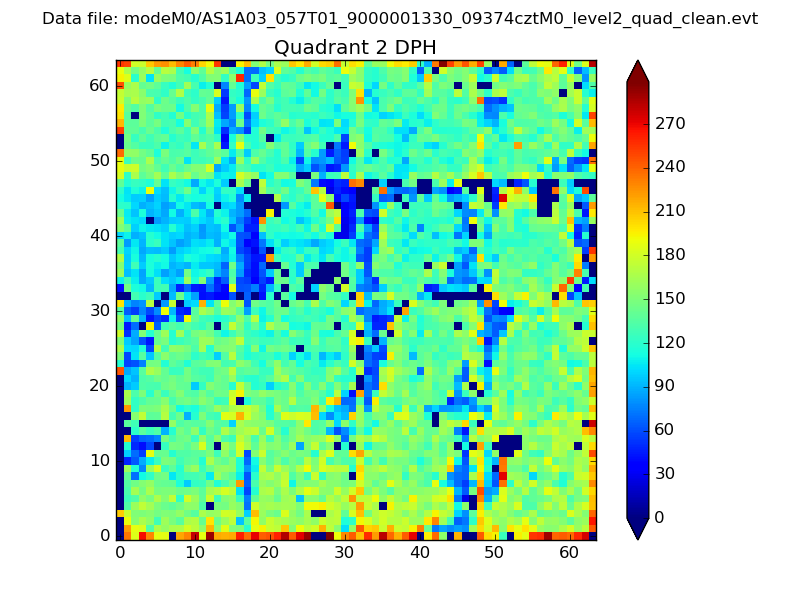 |
Quadrant C |
| Plot type | Count rate plots | Images |
|---|---|---|
| Comparison with Poisson distribution Blue bars denote a histogram of data divided into 1 sec bins. Red curve is a Poisson curve with rate = median count rate of data. |
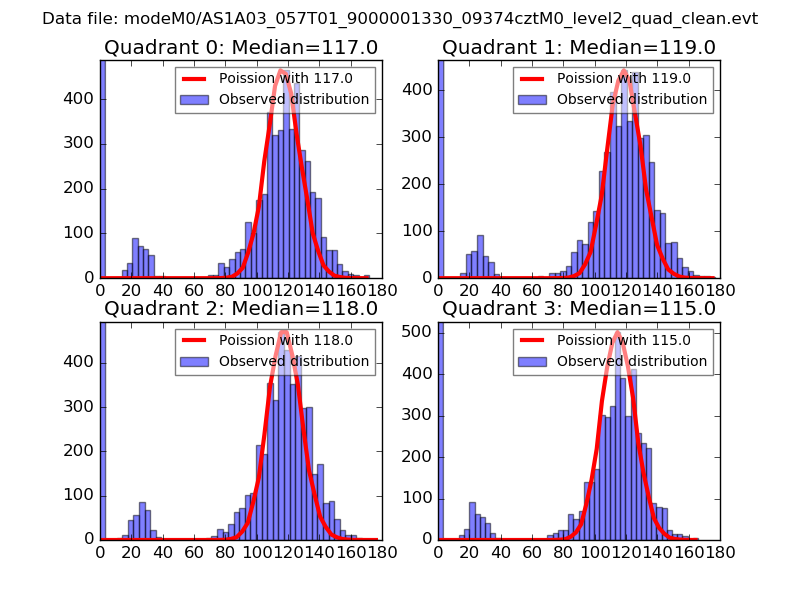 |
 |
| Quadrant-wise count rates Data is divided into 100 sec bins |
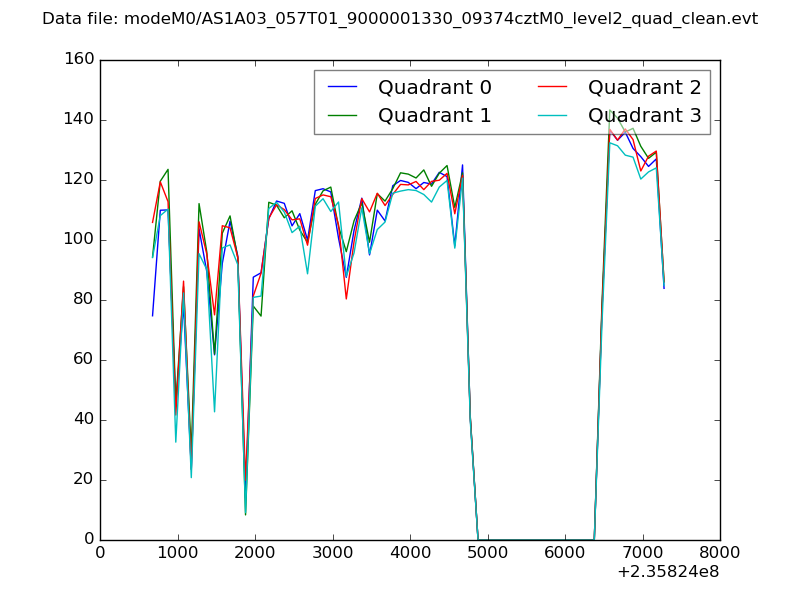 |
|
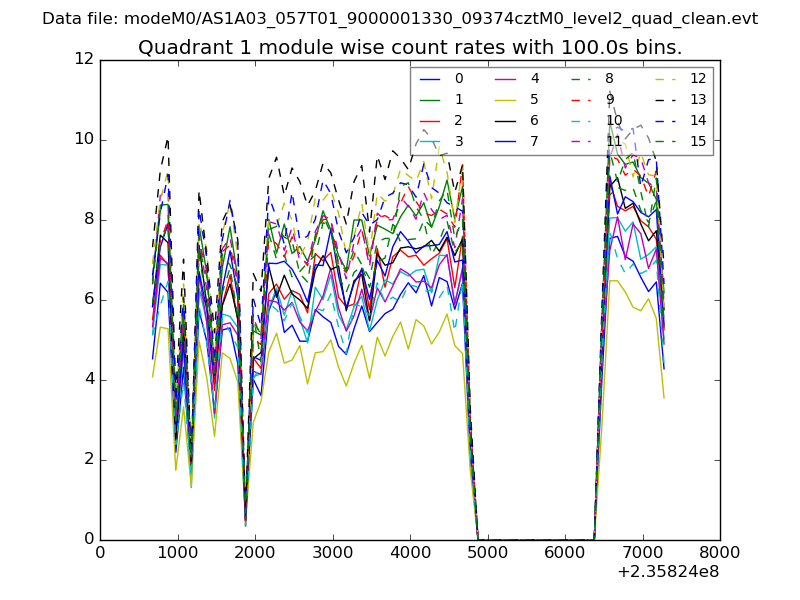
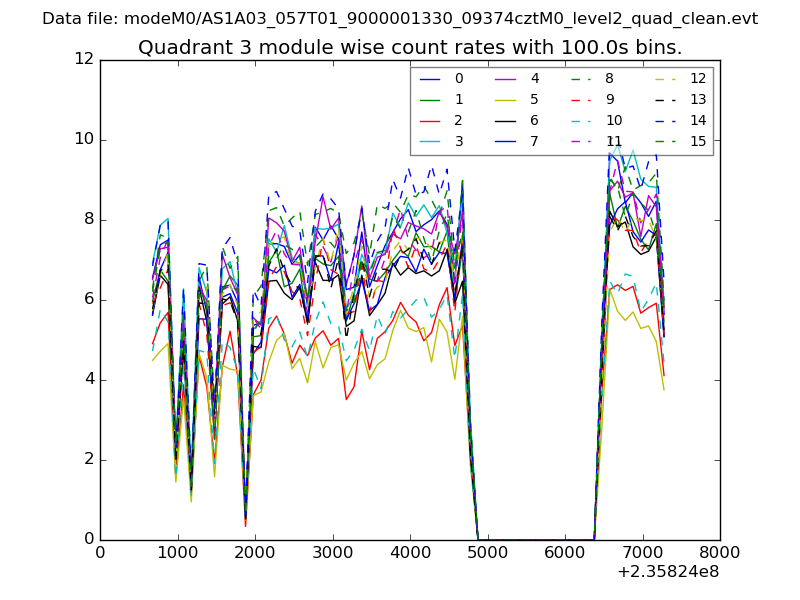
| Module-wise count rates for Quadrant A Data is divided into 100 sec bins |
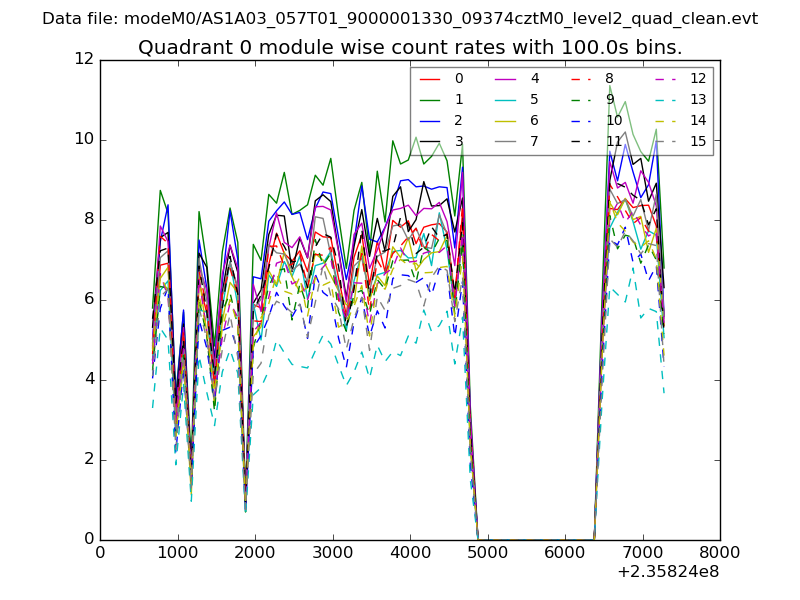 |
 |
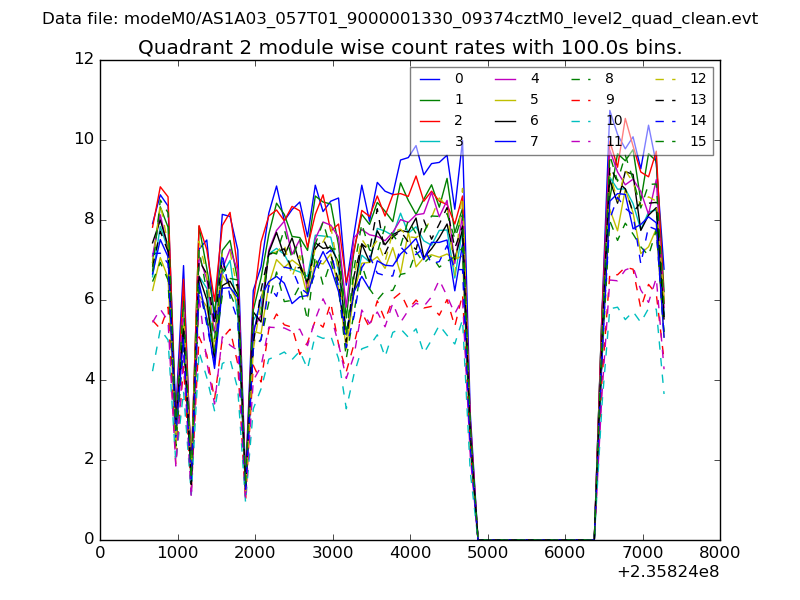
| Module-wise count rates for Quadrant B Data is divided into 100 sec bins |
 |
 |
| Module-wise count rates for Quadrant C Data is divided into 100 sec bins |
 |
 |
| Module-wise count rates for Quadrant D Data is divided into 100 sec bins |
 |
 |
| Parameter | Plot |
|---|---|
| CZT HV Monitor | 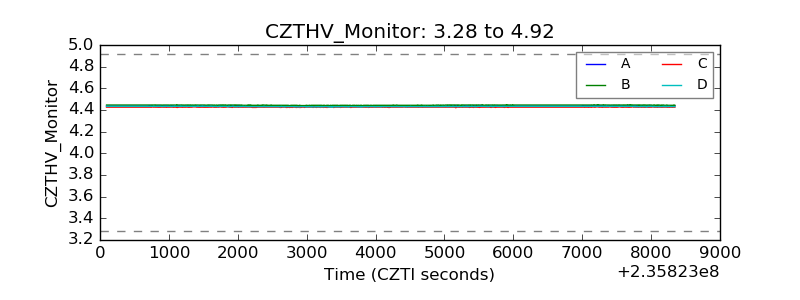 |
| D_VDD | 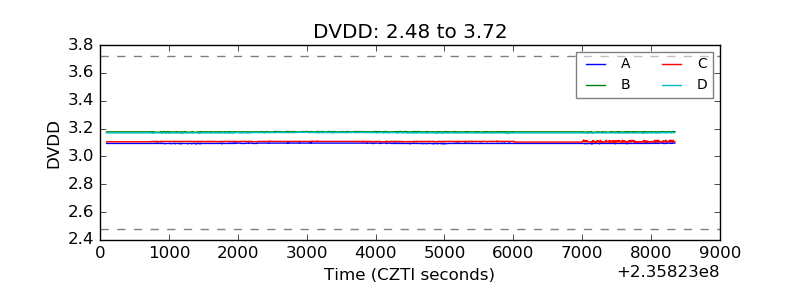 |
| Temperature 1 | 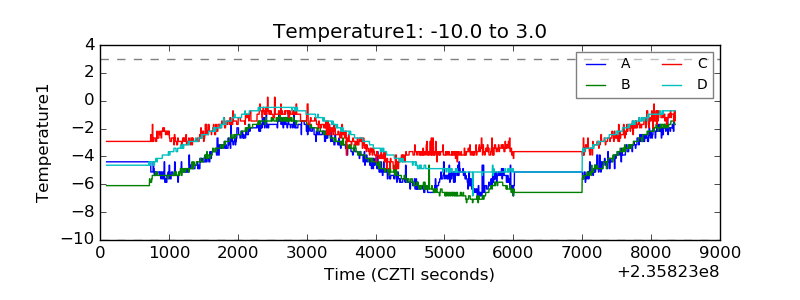 |
| Veto HV Monitor | 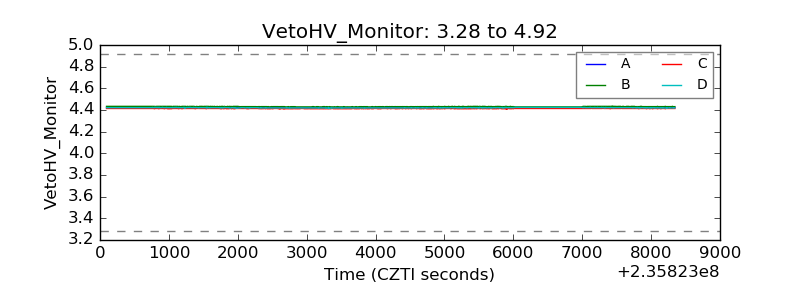 |
| Veto LLD | 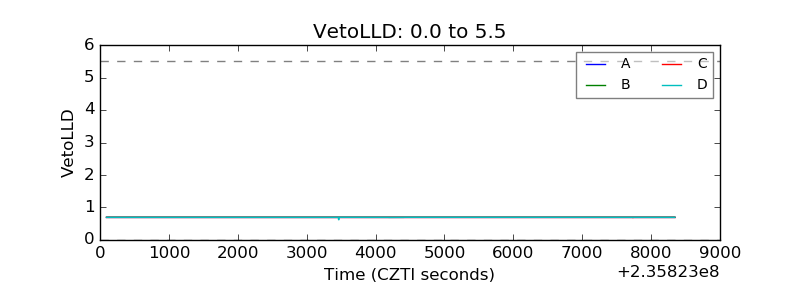 |
| Alpha Counter | 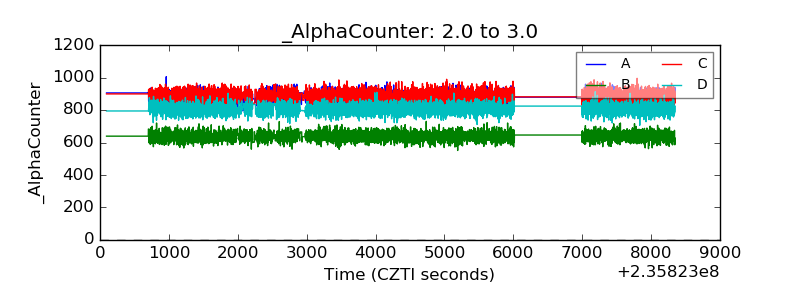 |
| _CPM_Rate | 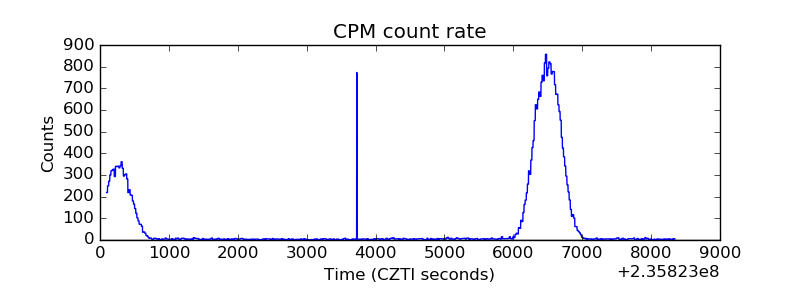 |
| CZT Counter | 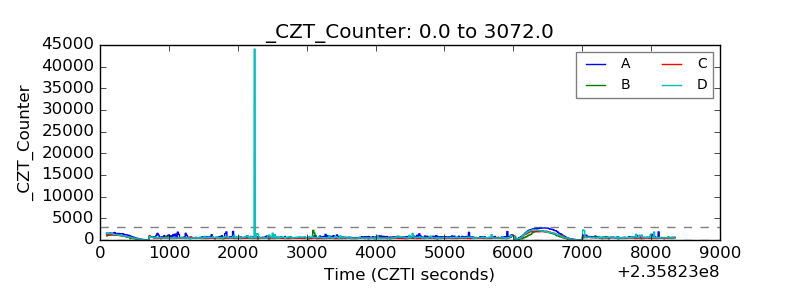 |
| +2.5 Volts monitor |  |
| +5 Volts monitor |  |
| _ROLL_ROT | 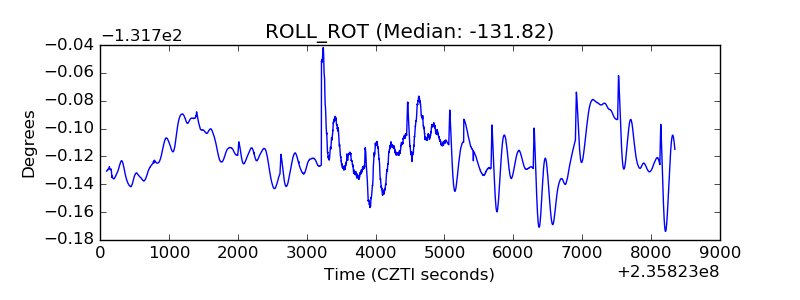 |
| _Roll_DEC | 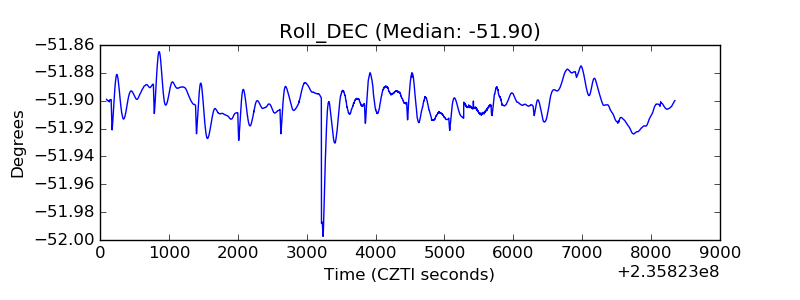 |
| _Roll_RA | 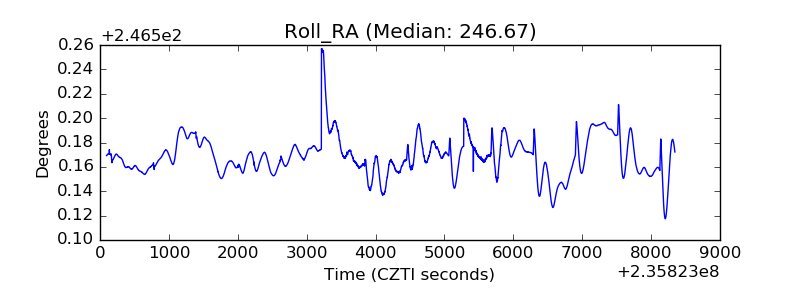 |
| Veto Counter | 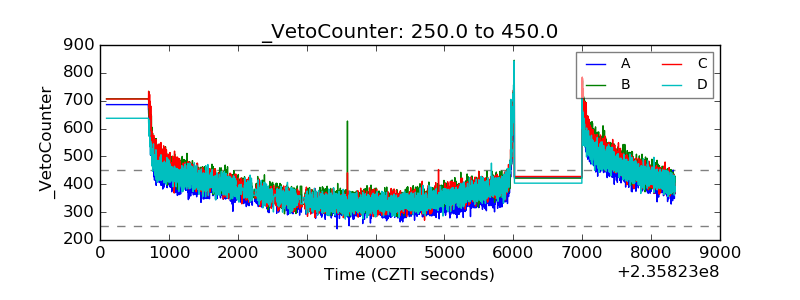 |