| Param | Original file | Final file |
|---|---|---|
| Filename | modeM0/AS1A03_057T01_9000001330_09376cztM0_level2.evt | modeM0/AS1A03_057T01_9000001330_09376cztM0_level2_quad_clean.evt |
| Size (bytes) | 449,006,400 | 110,332,800 |
| Size | 428.2 MB | 105.2 MB |
| Events in quadrant A | 3,625,508 | 732,577 |
| Events in quadrant B | 3,221,337 | 739,090 |
| Events in quadrant C | 2,919,779 | 720,605 |
| Events in quadrant D | 3,396,714 | 702,967 |
| Mode M9 | |||
|---|---|---|---|
| Quadrant | BADHDUFLAG | Total packets | Discarded packets |
| A | 0 | 11 | 0 |
| B | 0 | 11 | 0 |
| C | 0 | 11 | 0 |
| D | 0 | 11 | 0 |
| Mode M0 | |||
|---|---|---|---|
| Quadrant | BADHDUFLAG | Total packets | Discarded packets |
| A | 0 | 14998 | 2 |
| B | 0 | 13844 | 1 |
| C | 0 | 13113 | 1 |
| D | 0 | 14375 | 1 |
| Mode SS | |||
|---|---|---|---|
| Quadrant | BADHDUFLAG | Total packets | Discarded packets |
| A | 0 | 130 | 0 |
| B | 0 | 130 | 0 |
| C | 0 | 130 | 0 |
| D | 0 | 130 | 0 |
| Quadrant | Total seconds | Saturated seconds | Saturation percentage |
|---|---|---|---|
| A | 6399 | 67 | 1.047039% |
| B | 6399 | 47 | 0.734490% |
| C | 6399 | 30 | 0.468823% |
| D | 6399 | 71 | 1.109548% |
Noise dominated data is calculated using 1-second bins in cleaned event files. If a bin has >2000 counts, and if more than 50% of those come from <1% of pixels, then it is considered to be noise-dominated and hence unusable.
| Quadrant | # 1 sec bins | Bins with >0 counts | Bins with >2000 counts | High rate bins dominated by noise | Noise dominated (total time) | Noise dominated (detector-on time) | Marked lightcurve |
|---|---|---|---|---|---|---|---|
| A | 7519 | 6400 | 14 | 14 | 0.19% | 0.22% | 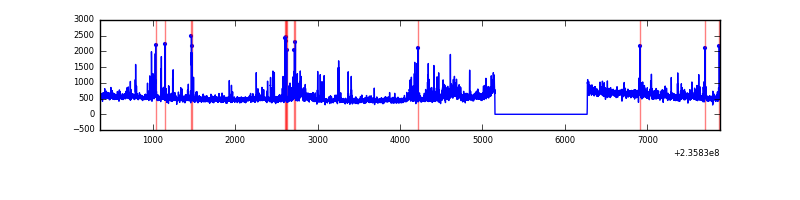 |
| B | 7519 | 6400 | 4 | 4 | 0.05% | 0.06% |  |
| C | 7519 | 6400 | 0 | 0 | 0.00% | 0.00% | 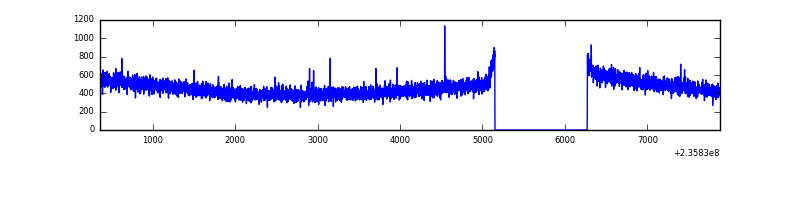 |
| D | 7519 | 6400 | 31 | 31 | 0.41% | 0.48% | 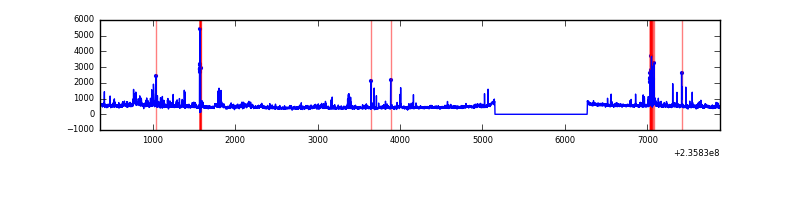 |
Top three noisy pixels from each quadrant. If the there are fewer than three noisy pixels in the level2.evt file, extra rows are filled as -1
| Pixel properties | Quadrant properties | ||||||
|---|---|---|---|---|---|---|---|
| Quadrant | DetID | PixID | Counts | Sigma | Mean | Median | Sigma |
| A | 8 | 5 | 574551 | 3656.78 | 777 | 761 | 156.9 |
| A | 13 | 251 | 22820 | 140.58 | 777 | 761 | 156.9 |
| A | 12 | 236 | 19015 | 116.33 | 777 | 761 | 156.9 |
| B | 0 | 214 | 82491 | 552.54 | 775 | 755 | 147.9 |
| B | 0 | 219 | 44093 | 292.97 | 775 | 755 | 147.9 |
| B | 4 | 173 | 34126 | 225.59 | 775 | 755 | 147.9 |
| C | 8 | 128 | 10515 | 57.03 | 742 | 745 | 171.3 |
| C | 8 | 112 | 5577 | 28.21 | 742 | 745 | 171.3 |
| C | 13 | 61 | 5557 | 28.09 | 742 | 745 | 171.3 |
| D | 1 | 52 | 223919 | 1167.19 | 743 | 724 | 191.2 |
| D | 8 | 195 | 127106 | 660.91 | 743 | 724 | 191.2 |
| D | 2 | 152 | 45193 | 232.55 | 743 | 724 | 191.2 |
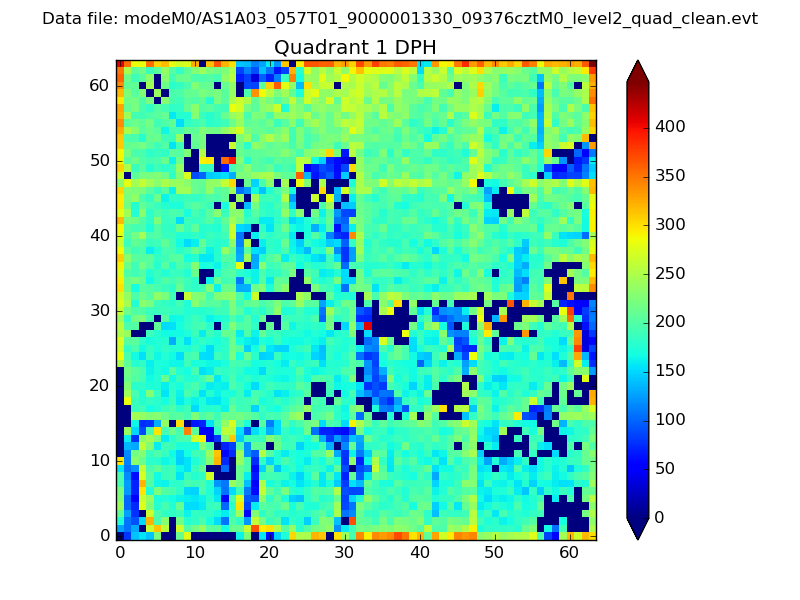
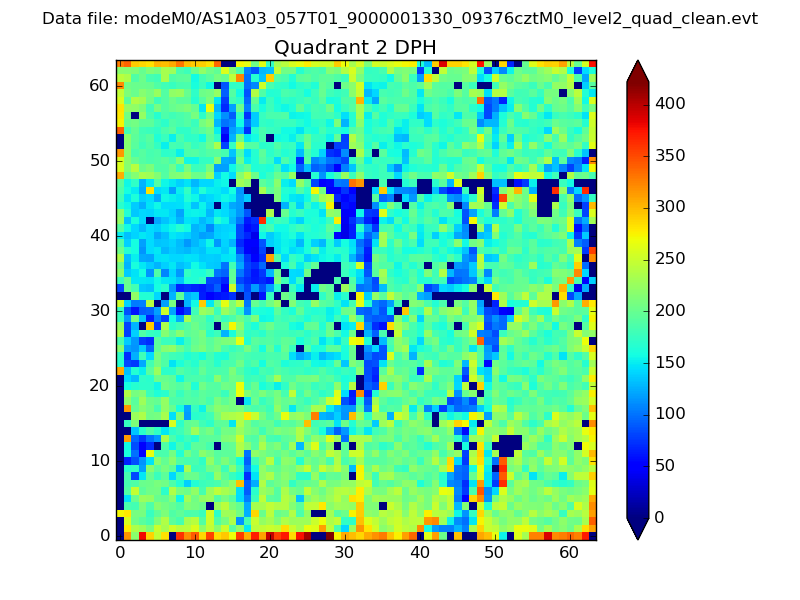
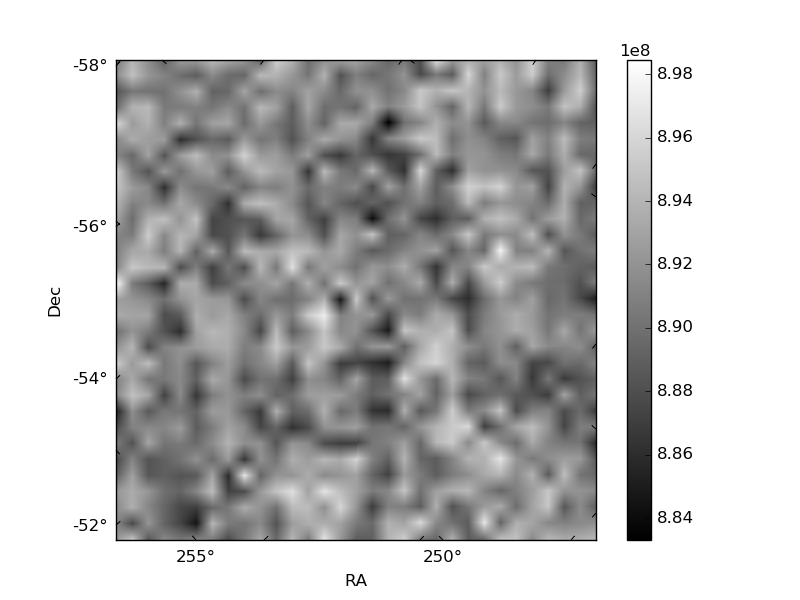
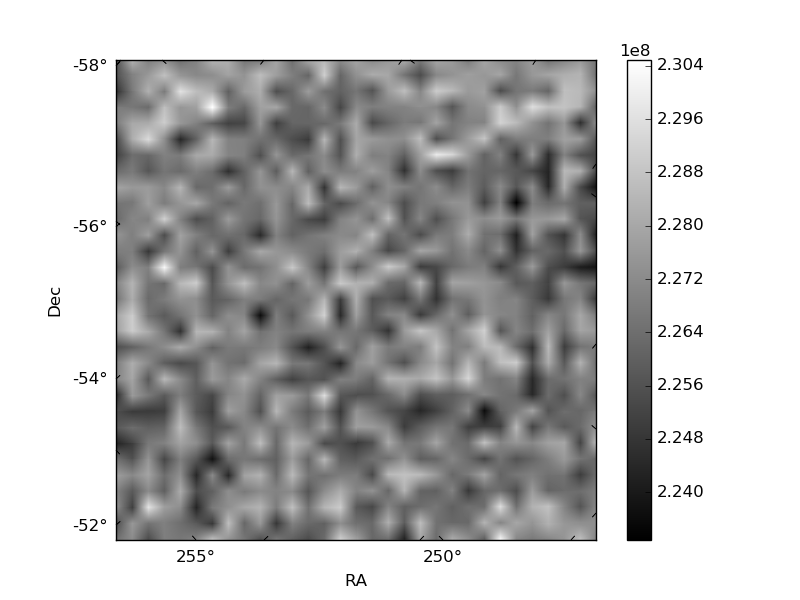
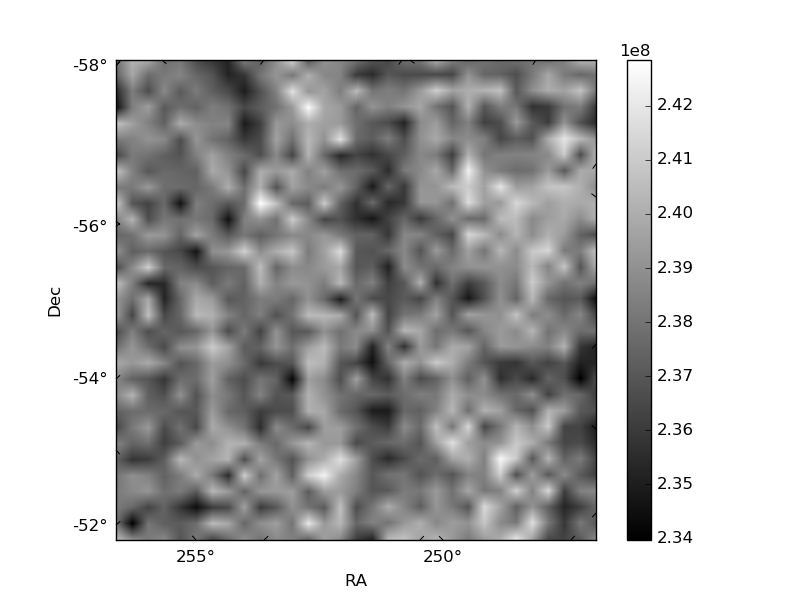
Histogram calculated using DETX and DETY for each event in the final _common_clean file
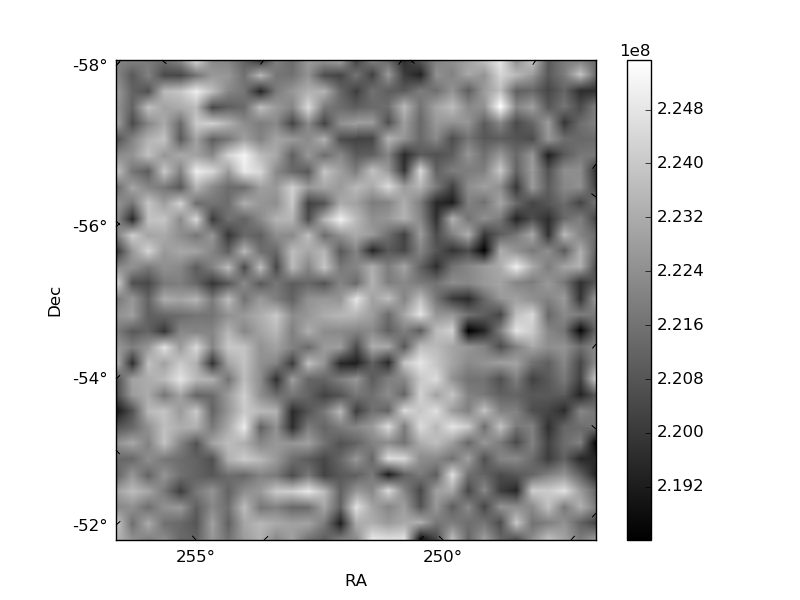
| Quadrant A | 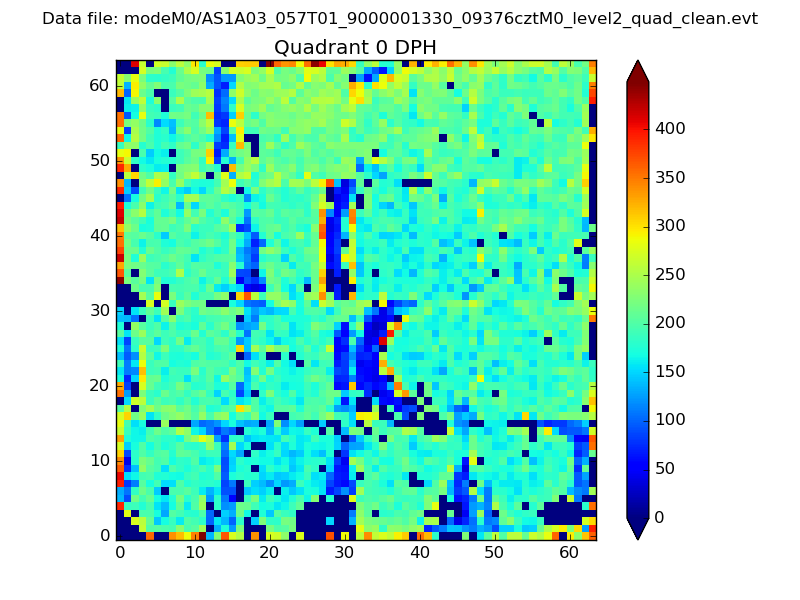 |
 |
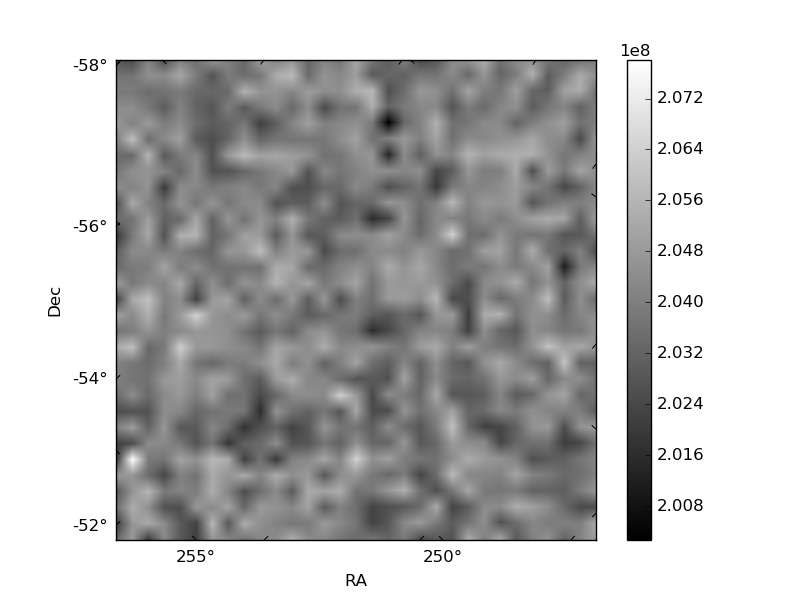
Quadrant B |
|---|---|---|---|
| Quadrant D | 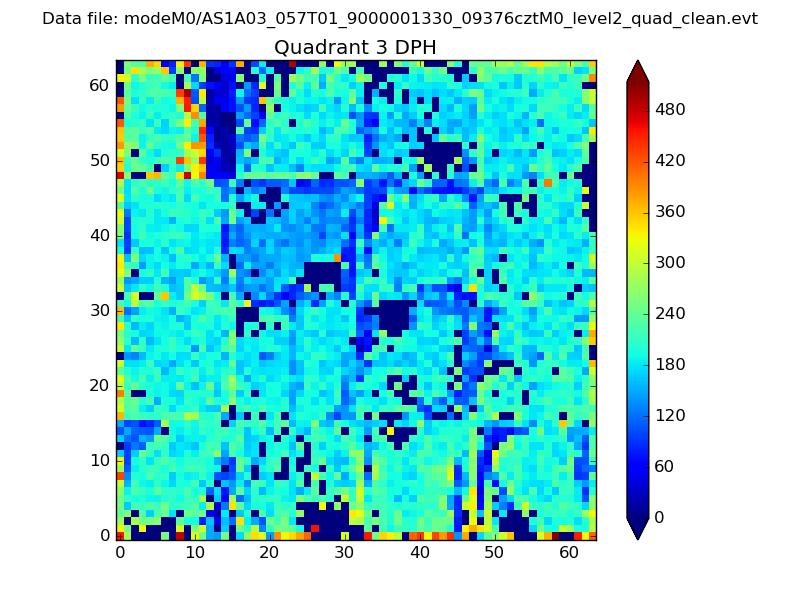 |
 |
Quadrant C |
| Plot type | Count rate plots | Images |
|---|---|---|
| Comparison with Poisson distribution Blue bars denote a histogram of data divided into 1 sec bins. Red curve is a Poisson curve with rate = median count rate of data. |
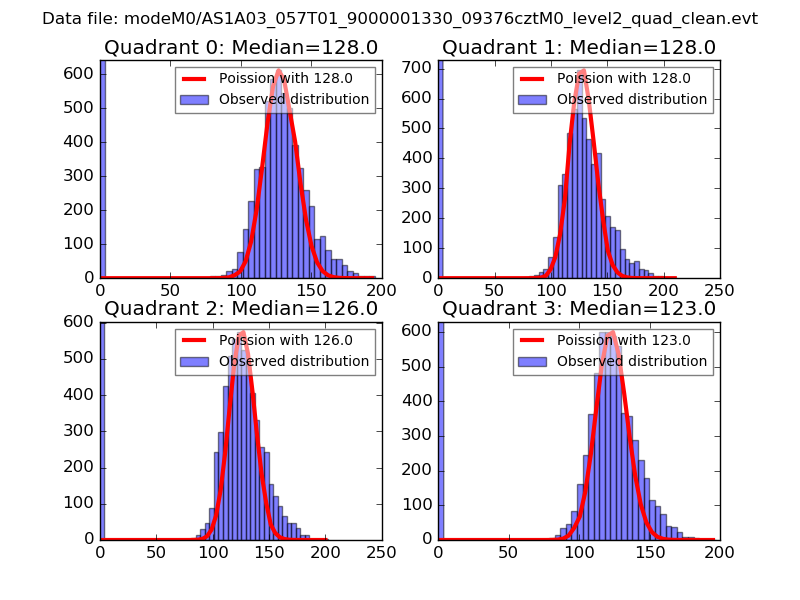 |
 |
| Quadrant-wise count rates Data is divided into 100 sec bins |
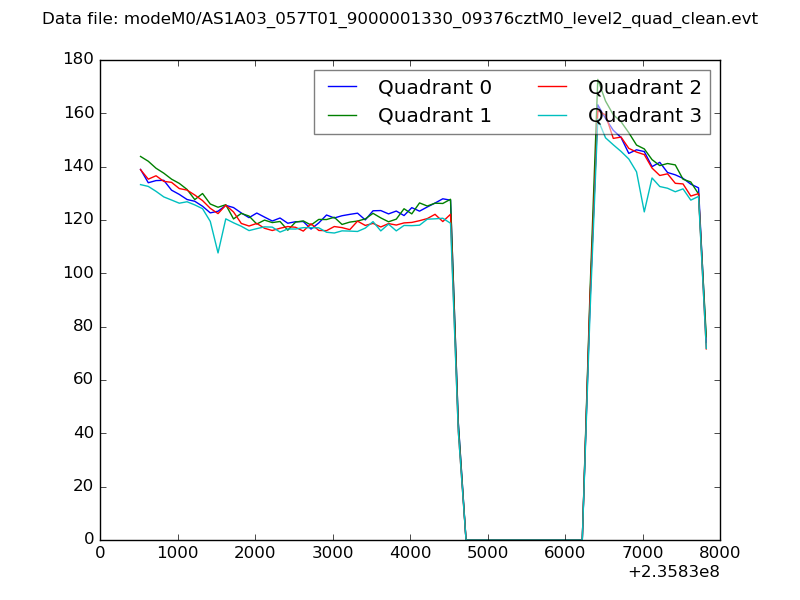 |
|
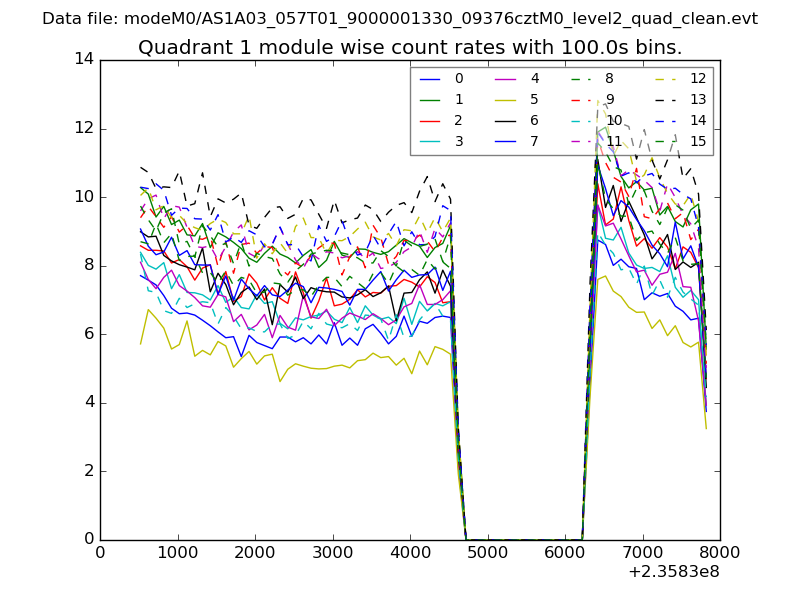
| Module-wise count rates for Quadrant A Data is divided into 100 sec bins |
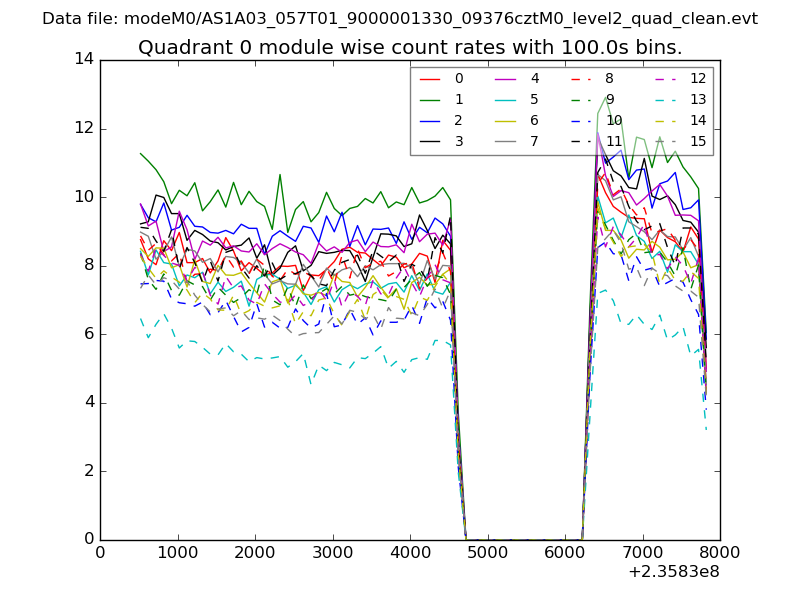 |
 |
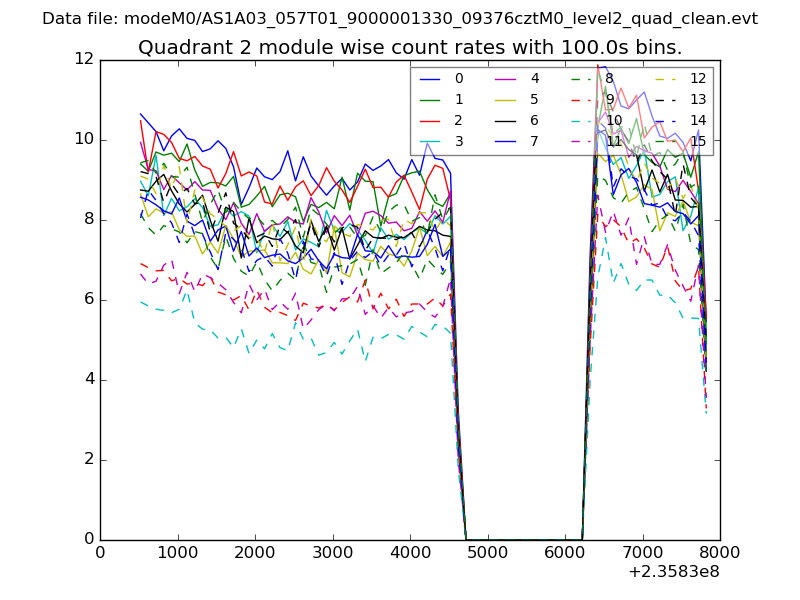
| Module-wise count rates for Quadrant B Data is divided into 100 sec bins |
 |
 |
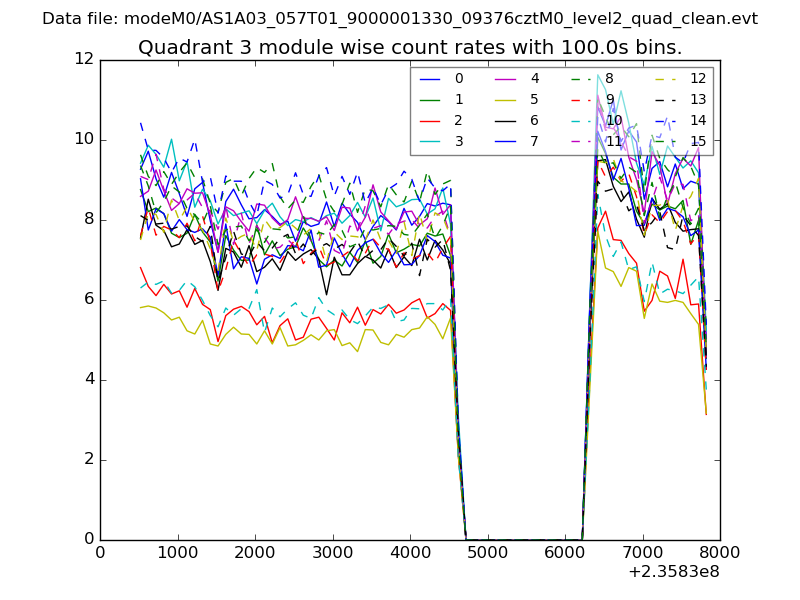
| Module-wise count rates for Quadrant C Data is divided into 100 sec bins |
 |
 |
| Module-wise count rates for Quadrant D Data is divided into 100 sec bins |
 |
 |
| Parameter | Plot |
|---|---|
| CZT HV Monitor | 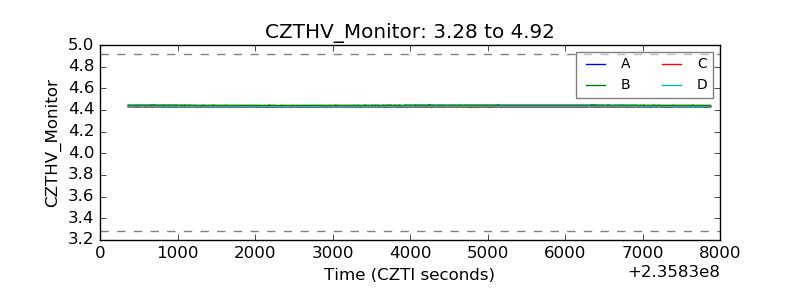 |
| D_VDD | 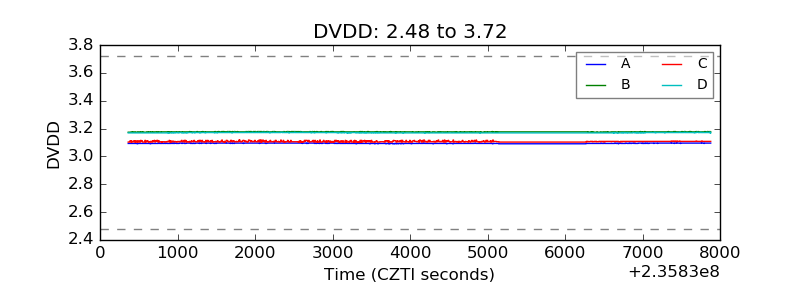 |
| Temperature 1 | 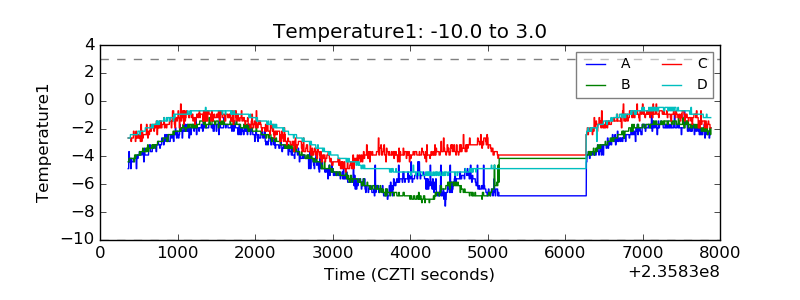 |
| Veto HV Monitor | 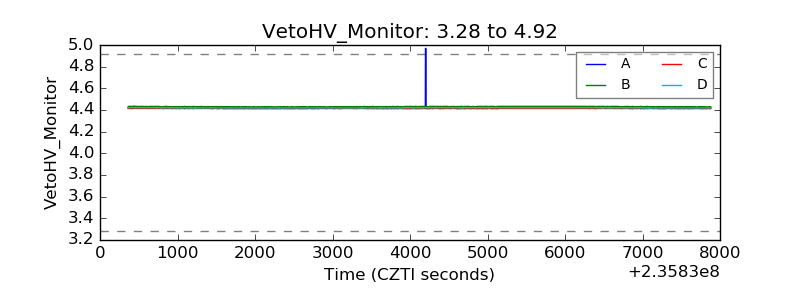 |
| Veto LLD | 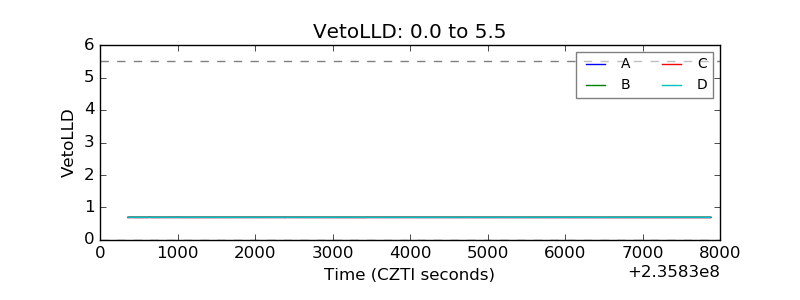 |
| Alpha Counter | 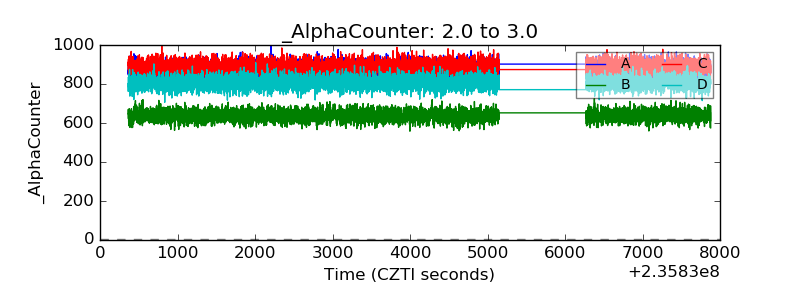 |
| _CPM_Rate | 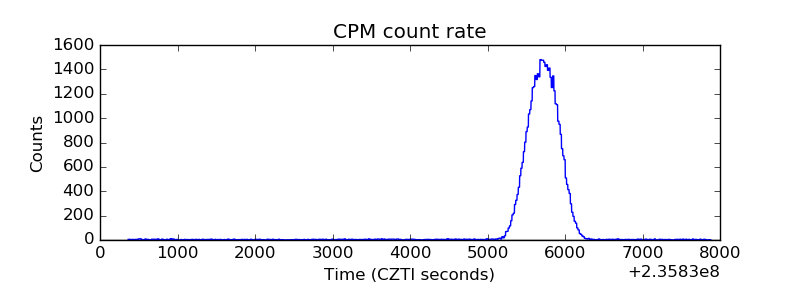 |
| CZT Counter | 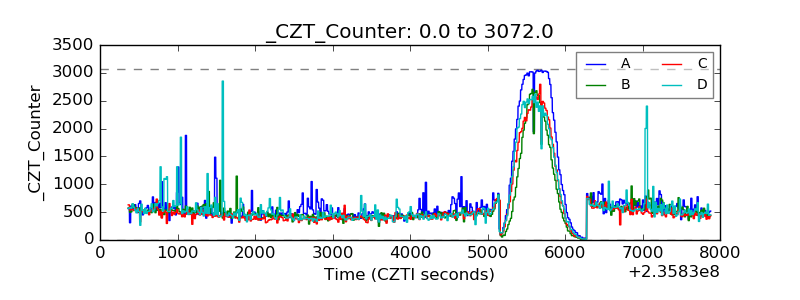 |
| +2.5 Volts monitor |  |
| +5 Volts monitor |  |
| _ROLL_ROT | 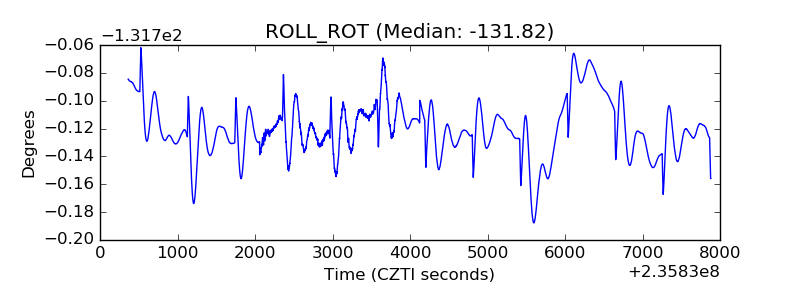 |
| _Roll_DEC | 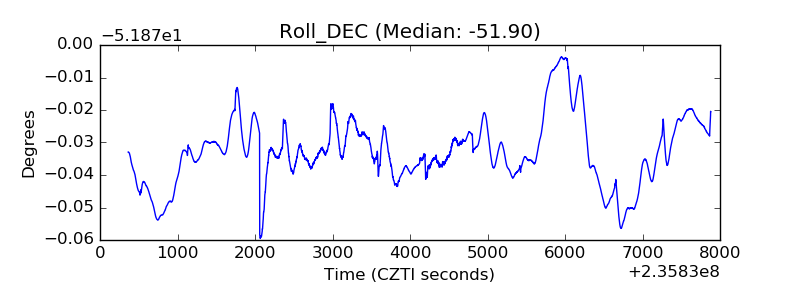 |
| _Roll_RA | 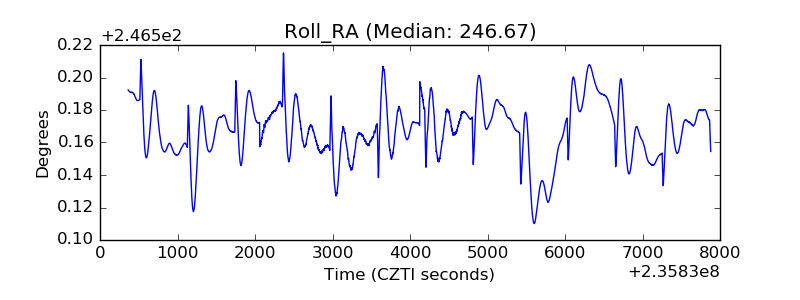 |
| Veto Counter | 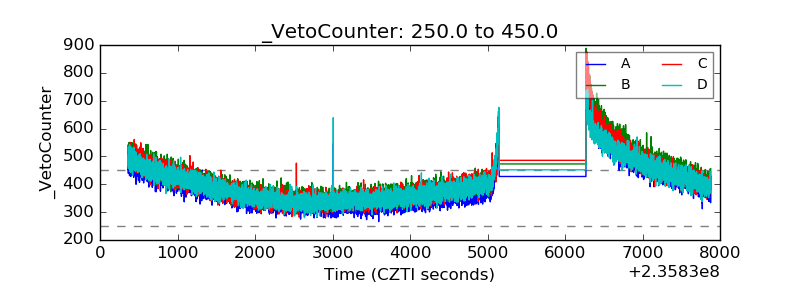 |