| Param | Original file | Final file |
|---|---|---|
| Filename | modeM0/AS1A03_057T01_9000001330_09378cztM0_level2.evt | modeM0/AS1A03_057T01_9000001330_09378cztM0_level2_quad_clean.evt |
| Size (bytes) | 494,861,760 | 109,624,320 |
| Size | 471.9 MB | 104.5 MB |
| Events in quadrant A | 3,798,725 | 738,668 |
| Events in quadrant B | 3,309,673 | 746,950 |
| Events in quadrant C | 2,991,398 | 714,102 |
| Events in quadrant D | 4,451,471 | 672,711 |
| Mode M9 | |||
|---|---|---|---|
| Quadrant | BADHDUFLAG | Total packets | Discarded packets |
| A | 0 | 12 | 0 |
| B | 0 | 12 | 0 |
| C | 0 | 12 | 0 |
| D | 0 | 13 | 0 |
| Mode M0 | |||
|---|---|---|---|
| Quadrant | BADHDUFLAG | Total packets | Discarded packets |
| A | 0 | 15454 | 3 |
| B | 0 | 14104 | 2 |
| C | 0 | 13282 | 2 |
| D | 0 | 17531 | 2 |
| Mode SS | |||
|---|---|---|---|
| Quadrant | BADHDUFLAG | Total packets | Discarded packets |
| A | 0 | 132 | 0 |
| B | 0 | 132 | 0 |
| C | 0 | 132 | 0 |
| D | 0 | 132 | 0 |
| Quadrant | Total seconds | Saturated seconds | Saturation percentage |
|---|---|---|---|
| A | 6410 | 123 | 1.918877% |
| B | 6410 | 73 | 1.138846% |
| C | 6410 | 38 | 0.592824% |
| D | 6410 | 437 | 6.817473% |
Noise dominated data is calculated using 1-second bins in cleaned event files. If a bin has >2000 counts, and if more than 50% of those come from <1% of pixels, then it is considered to be noise-dominated and hence unusable.
| Quadrant | # 1 sec bins | Bins with >0 counts | Bins with >2000 counts | High rate bins dominated by noise | Noise dominated (total time) | Noise dominated (detector-on time) | Marked lightcurve |
|---|---|---|---|---|---|---|---|
| A | 7675 | 6411 | 21 | 21 | 0.27% | 0.33% | 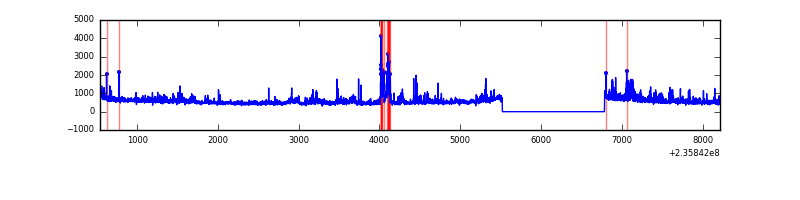 |
| B | 7675 | 6411 | 0 | 0 | 0.00% | 0.00% | 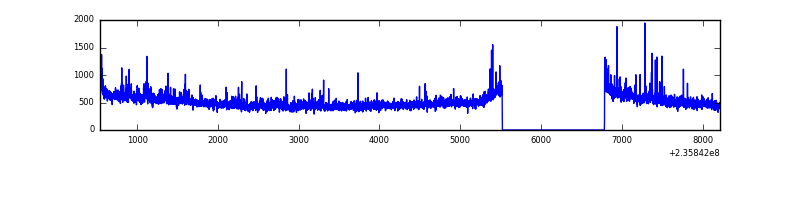 |
| C | 7675 | 6411 | 0 | 0 | 0.00% | 0.00% |  |
| D | 7675 | 6411 | 321 | 321 | 4.18% | 5.01% | 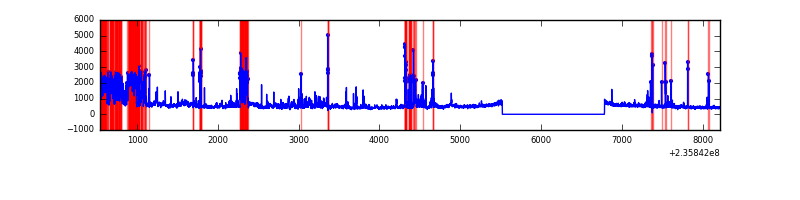 |
Top three noisy pixels from each quadrant. If the there are fewer than three noisy pixels in the level2.evt file, extra rows are filled as -1
| Pixel properties | Quadrant properties | ||||||
|---|---|---|---|---|---|---|---|
| Quadrant | DetID | PixID | Counts | Sigma | Mean | Median | Sigma |
| A | 8 | 5 | 536299 | 3312.58 | 806 | 790 | 161.7 |
| A | 5 | 16 | 115061 | 706.86 | 806 | 790 | 161.7 |
| A | 1 | 162 | 21026 | 125.18 | 806 | 790 | 161.7 |
| B | 0 | 214 | 66998 | 437.48 | 805 | 789 | 151.3 |
| B | 4 | 173 | 42449 | 275.27 | 805 | 789 | 151.3 |
| B | 0 | 219 | 40572 | 262.87 | 805 | 789 | 151.3 |
| C | 10 | 22 | 16566 | 90.43 | 761 | 763 | 174.8 |
| C | 13 | 61 | 5798 | 28.81 | 761 | 763 | 174.8 |
| C | 8 | 222 | 3200 | 13.94 | 761 | 763 | 174.8 |
| D | 1 | 52 | 913871 | 4620.23 | 744 | 727 | 197.6 |
| D | 12 | 233 | 258255 | 1303.01 | 744 | 727 | 197.6 |
| D | 8 | 195 | 237742 | 1199.22 | 744 | 727 | 197.6 |
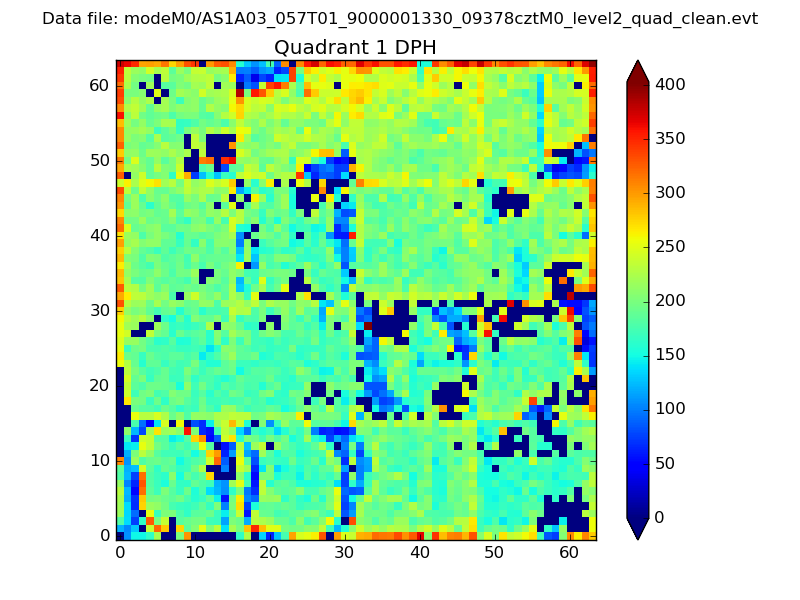
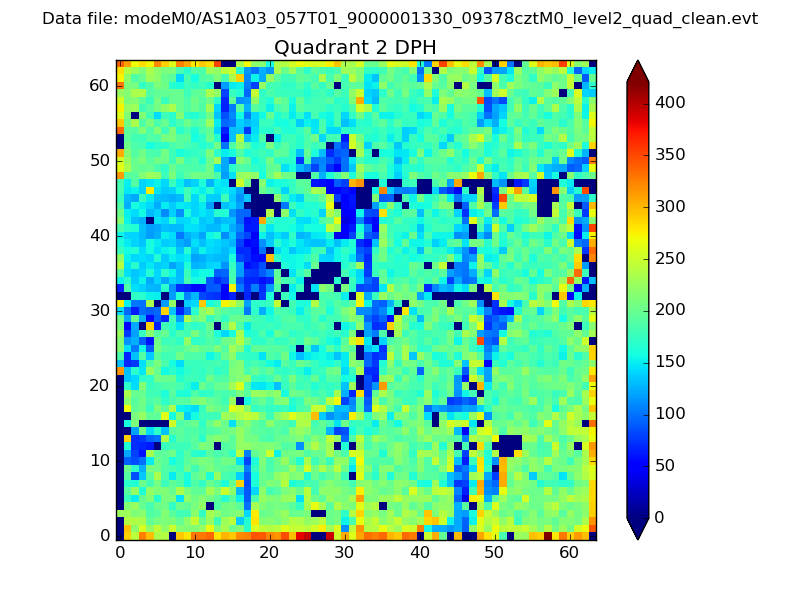
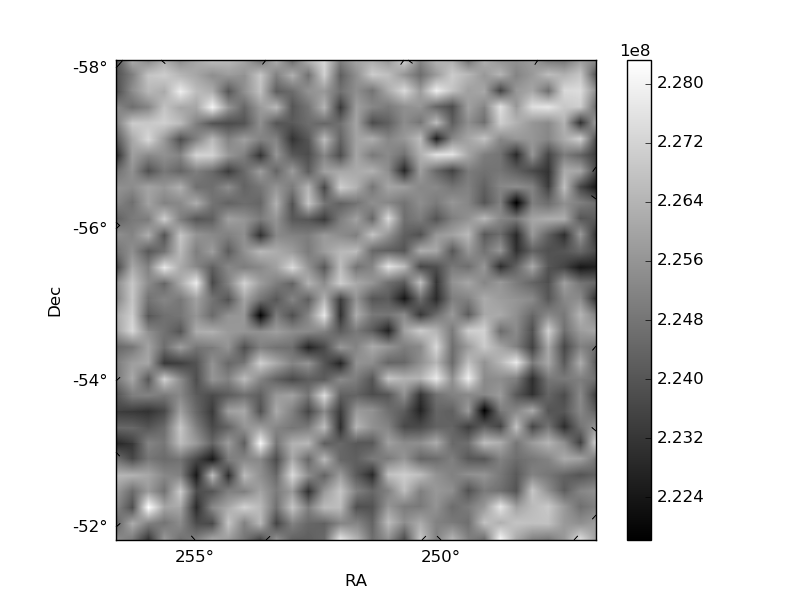
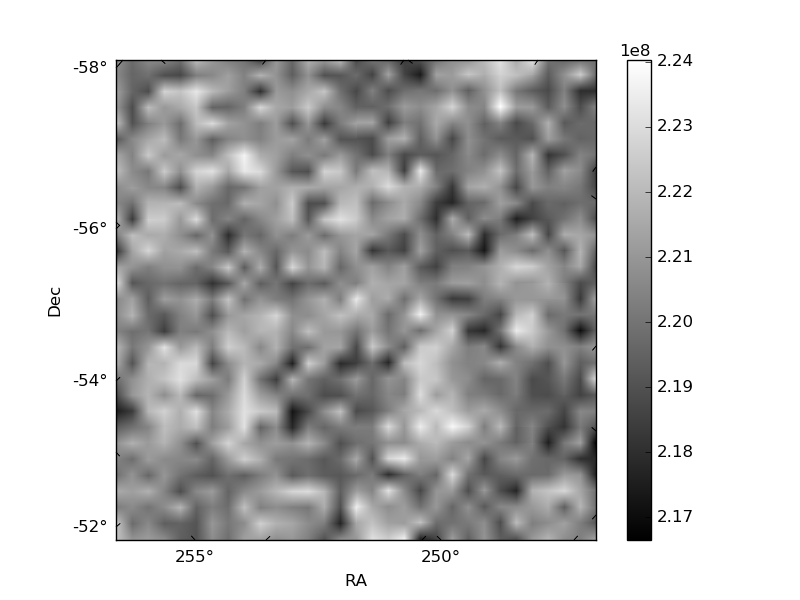
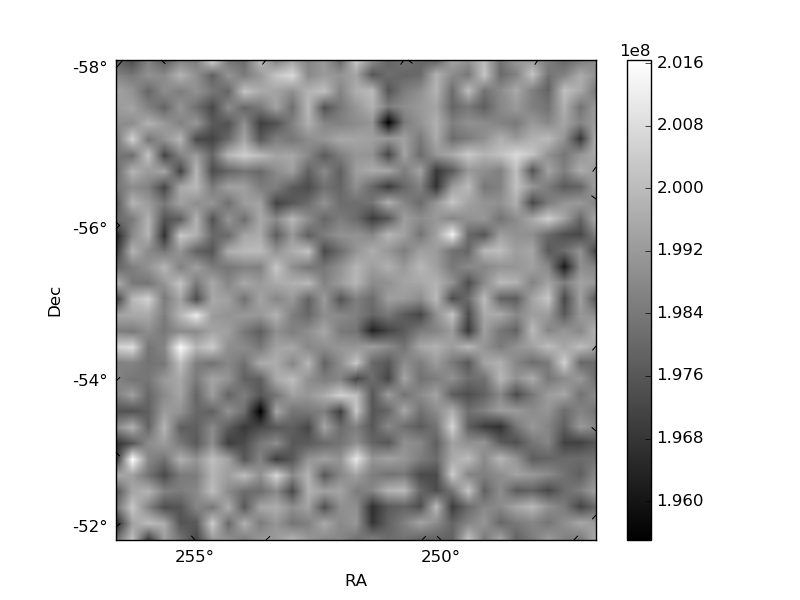
Histogram calculated using DETX and DETY for each event in the final _common_clean file
| Quadrant A | 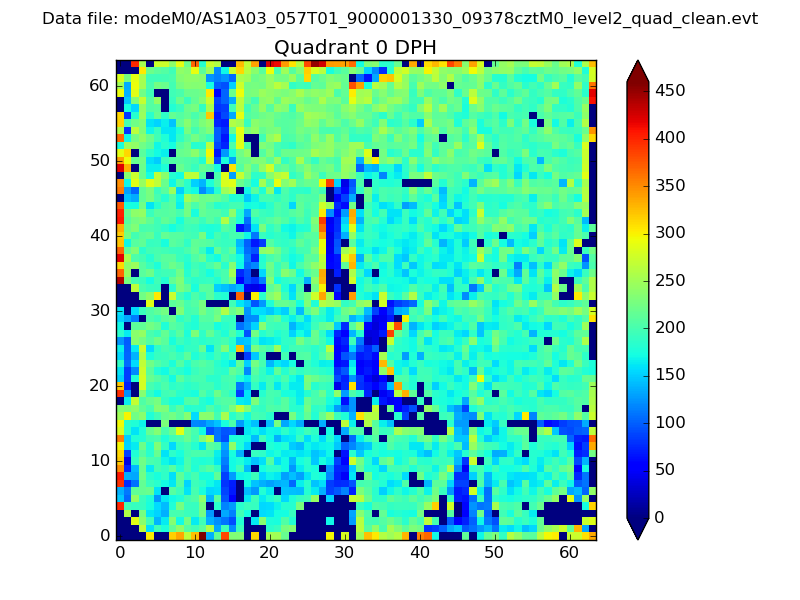 |
 |
Quadrant B |
|---|---|---|---|
| Quadrant D | 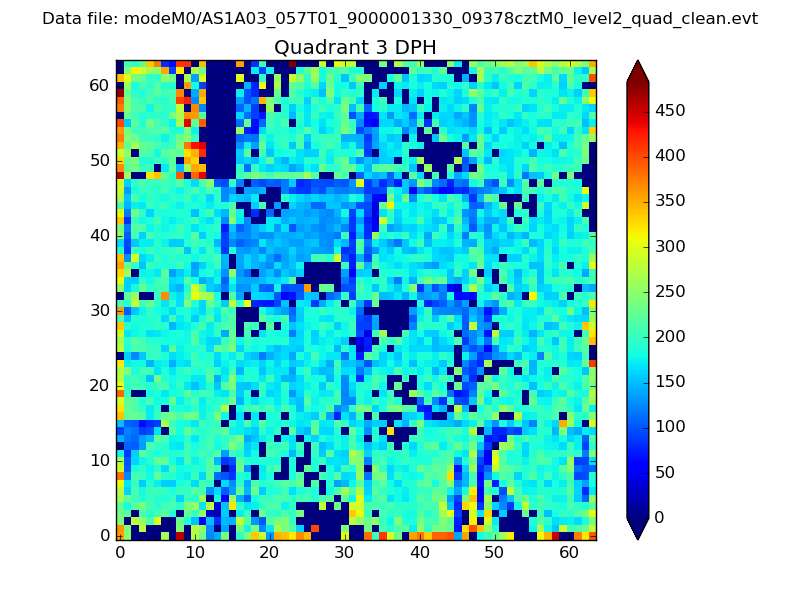 |
 |
Quadrant C |
| Plot type | Count rate plots | Images |
|---|---|---|
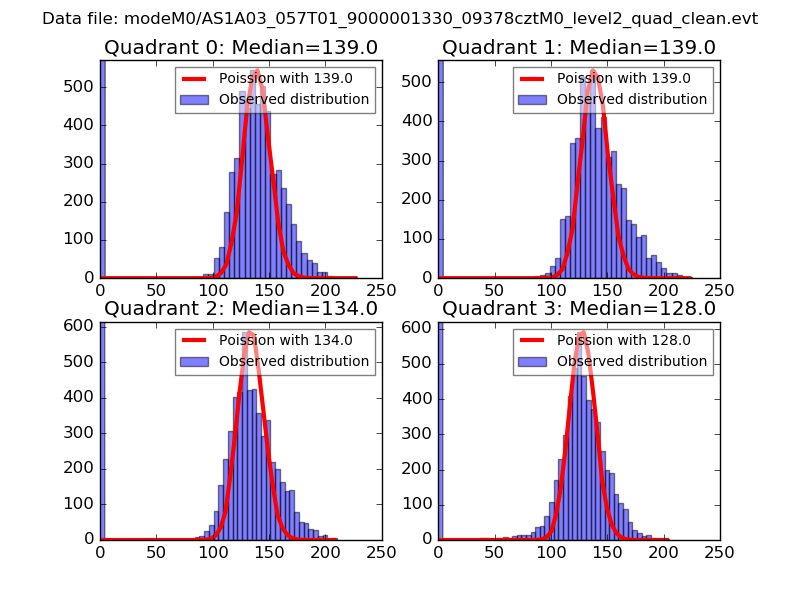
| Comparison with Poisson distribution Blue bars denote a histogram of data divided into 1 sec bins. Red curve is a Poisson curve with rate = median count rate of data. |
 |
 |
| Quadrant-wise count rates Data is divided into 100 sec bins |
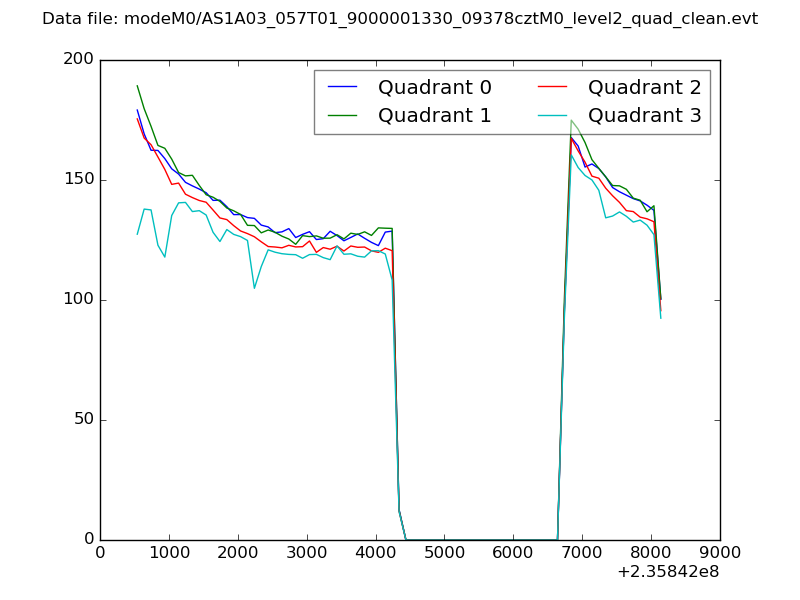 |
|
| Module-wise count rates for Quadrant A Data is divided into 100 sec bins |
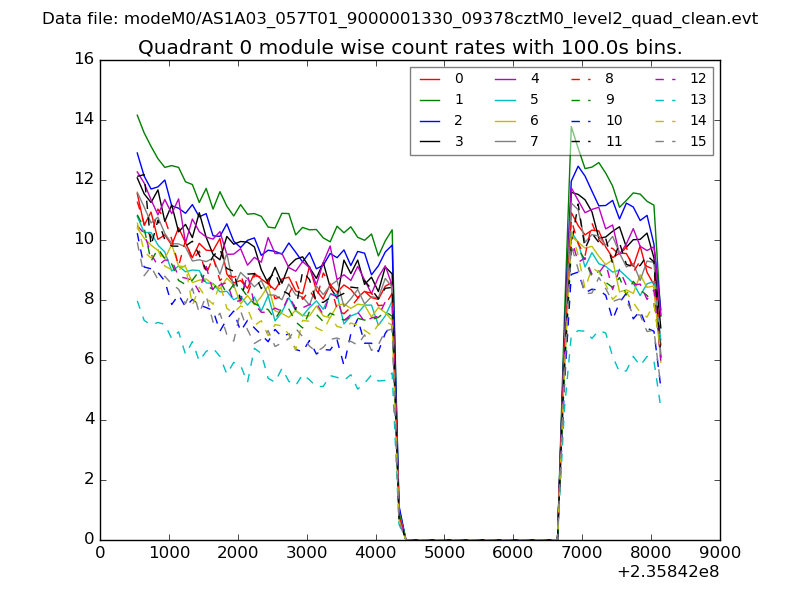 |
 |
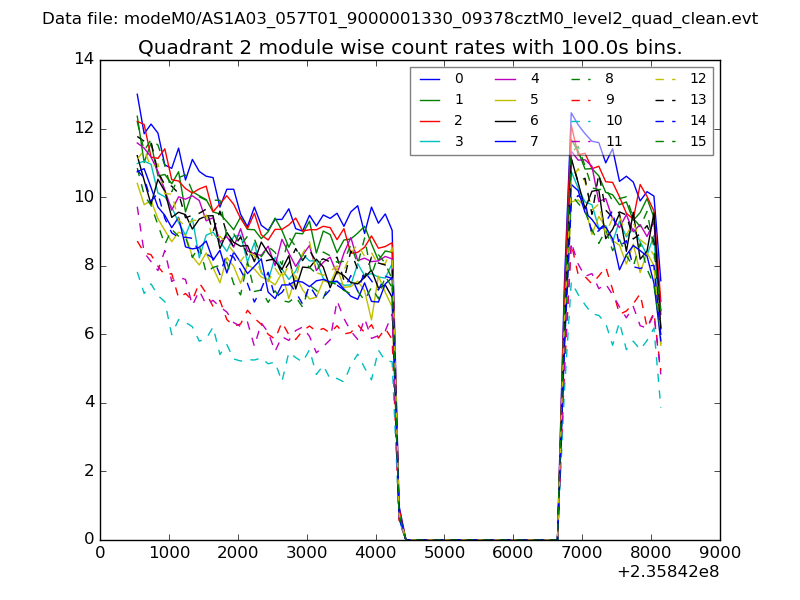
| Module-wise count rates for Quadrant B Data is divided into 100 sec bins |
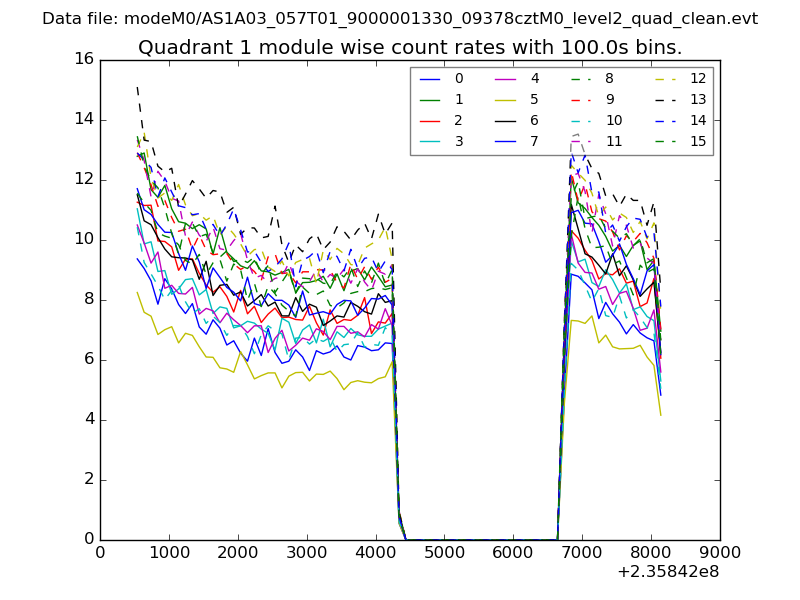 |
 |
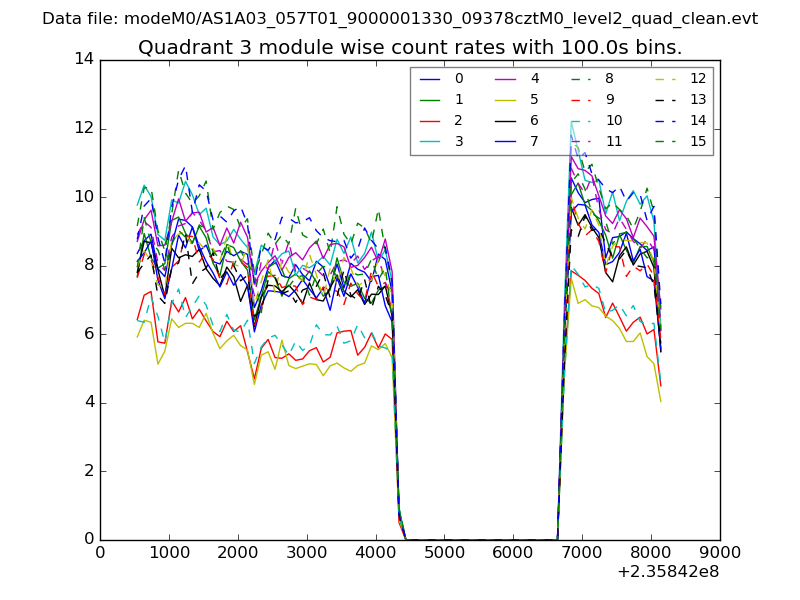
| Module-wise count rates for Quadrant C Data is divided into 100 sec bins |
 |
 |
| Module-wise count rates for Quadrant D Data is divided into 100 sec bins |
 |
 |
| Parameter | Plot |
|---|---|
| CZT HV Monitor | 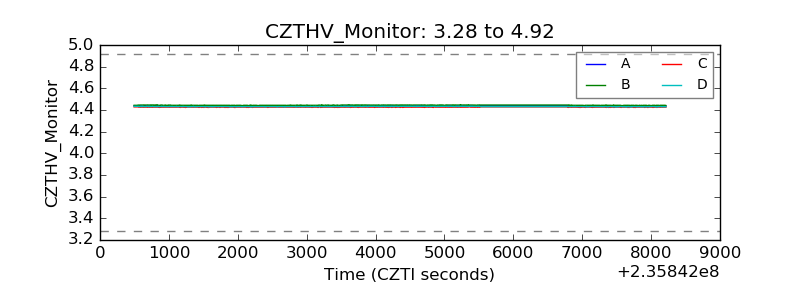 |
| D_VDD | 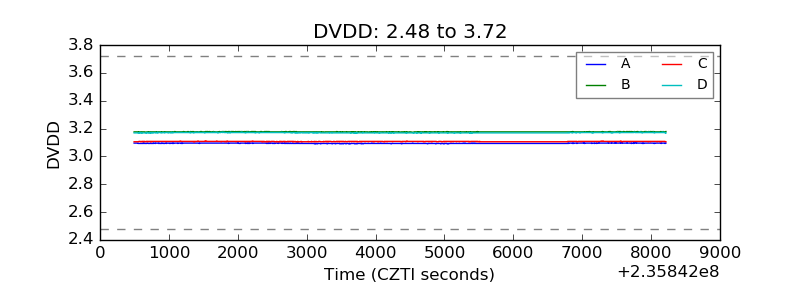 |
| Temperature 1 | 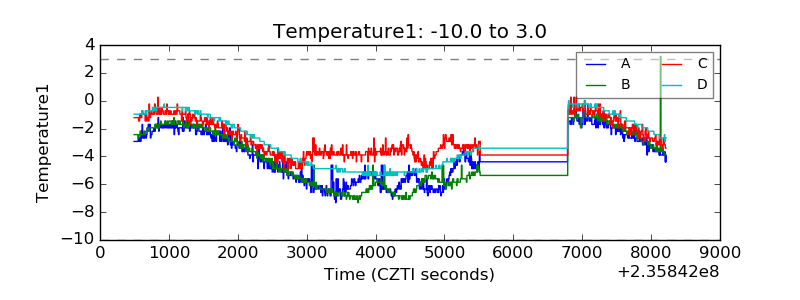 |
| Veto HV Monitor | 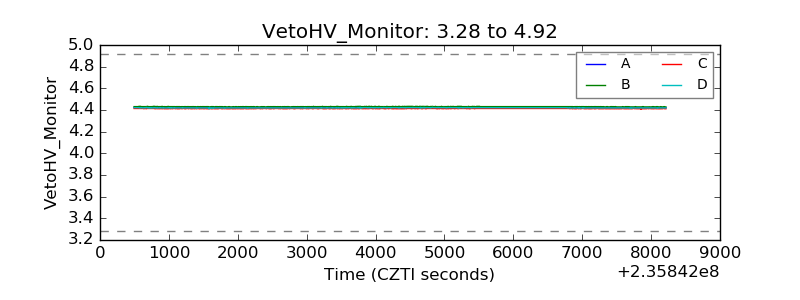 |
| Veto LLD | 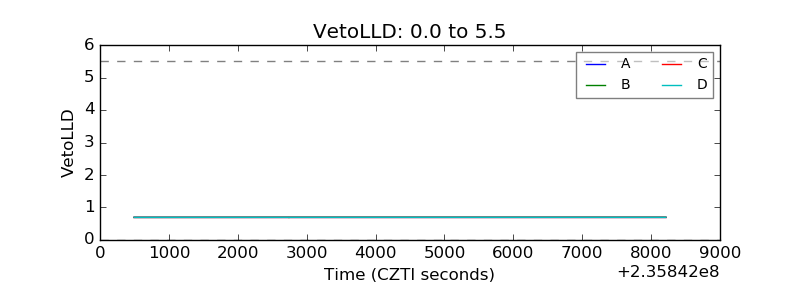 |
| Alpha Counter | 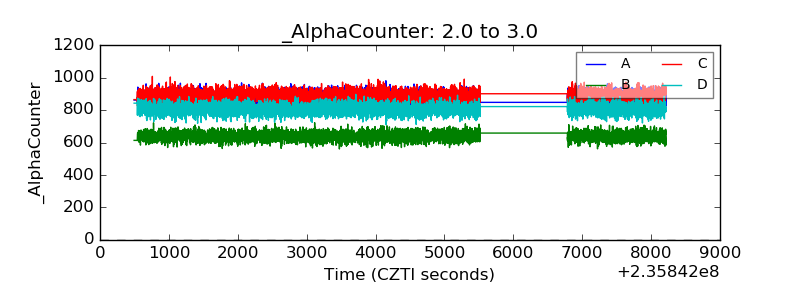 |
| _CPM_Rate | 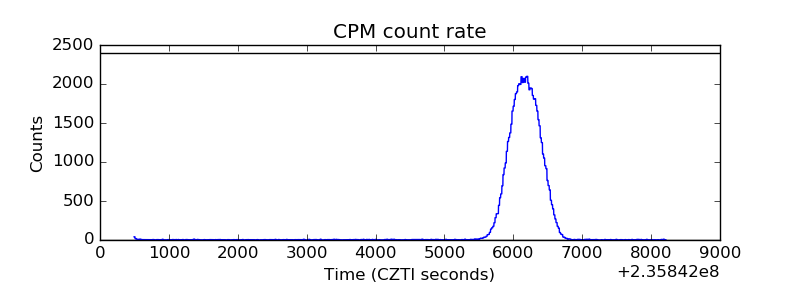 |
| CZT Counter | 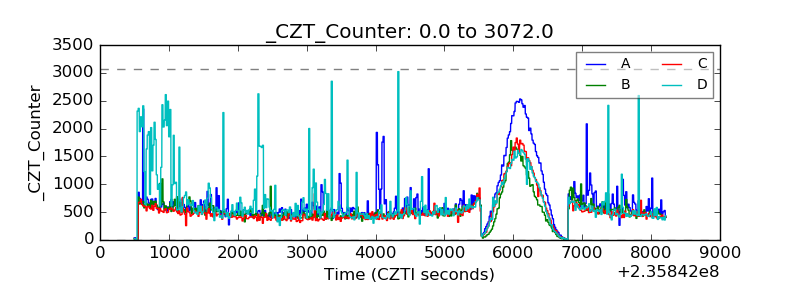 |
| +2.5 Volts monitor |  |
| +5 Volts monitor |  |
| _ROLL_ROT |  |
| _Roll_DEC | 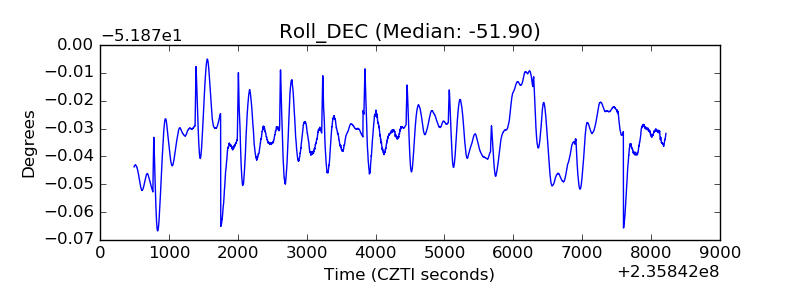 |
| _Roll_RA |  |
| Veto Counter | 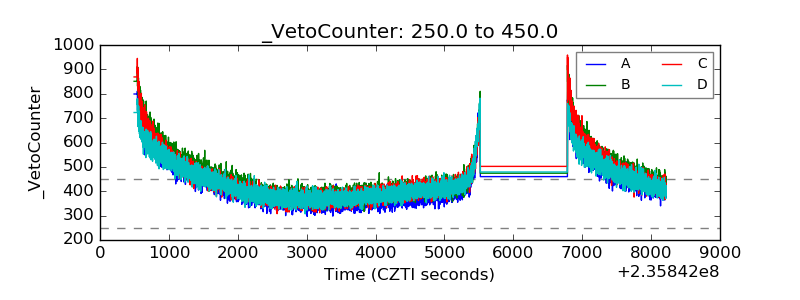 |