| Param | Original file | Final file |
|---|---|---|
| Filename | modeM0/AS1A03_057T01_9000001330_09380cztM0_level2.evt | modeM0/AS1A03_057T01_9000001330_09380cztM0_level2_quad_clean.evt |
| Size (bytes) | 468,092,160 | 94,098,240 |
| Size | 446.4 MB | 89.7 MB |
| Events in quadrant A | 3,983,835 | 609,185 |
| Events in quadrant B | 3,084,631 | 621,653 |
| Events in quadrant C | 2,838,584 | 600,857 |
| Events in quadrant D | 3,841,524 | 578,495 |
| Mode M9 | |||
|---|---|---|---|
| Quadrant | BADHDUFLAG | Total packets | Discarded packets |
| A | 0 | 18 | 0 |
| B | 0 | 18 | 0 |
| C | 0 | 18 | 0 |
| D | 0 | 19 | 0 |
| Mode M0 | |||
|---|---|---|---|
| Quadrant | BADHDUFLAG | Total packets | Discarded packets |
| A | 0 | 16160 | 93 |
| B | 0 | 13387 | 79 |
| C | 0 | 13058 | 76 |
| D | 0 | 15577 | 92 |
| Mode SS | |||
|---|---|---|---|
| Quadrant | BADHDUFLAG | Total packets | Discarded packets |
| A | 0 | 128 | 0 |
| B | 0 | 128 | 2 |
| C | 0 | 128 | 0 |
| D | 0 | 128 | 2 |
| Quadrant | Total seconds | Saturated seconds | Saturation percentage |
|---|---|---|---|
| A | 6303 | 108 | 1.713470% |
| B | 6301 | 74 | 1.174417% |
| C | 6302 | 21 | 0.333228% |
| D | 6299 | 43 | 0.682648% |
Noise dominated data is calculated using 1-second bins in cleaned event files. If a bin has >2000 counts, and if more than 50% of those come from <1% of pixels, then it is considered to be noise-dominated and hence unusable.
| Quadrant | # 1 sec bins | Bins with >0 counts | Bins with >2000 counts | High rate bins dominated by noise | Noise dominated (total time) | Noise dominated (detector-on time) | Marked lightcurve |
|---|---|---|---|---|---|---|---|
| A | 7549 | 6336 | 52 | 52 | 0.69% | 0.82% | 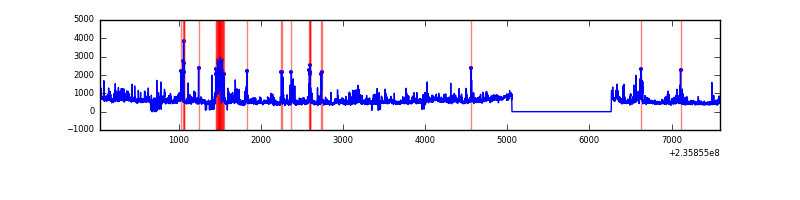 |
| B | 7549 | 6336 | 3 | 3 | 0.04% | 0.05% | 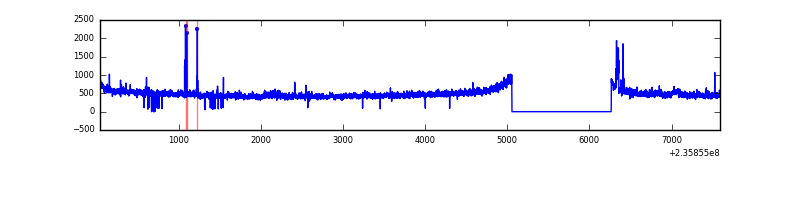 |
| C | 7549 | 6340 | 1 | 1 | 0.01% | 0.02% | 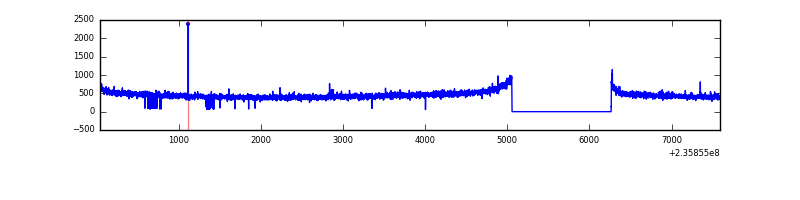 |
| D | 7549 | 6338 | 7 | 7 | 0.09% | 0.11% | 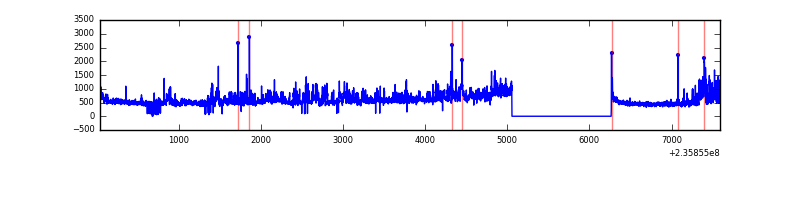 |
Top three noisy pixels from each quadrant. If the there are fewer than three noisy pixels in the level2.evt file, extra rows are filled as -1
| Pixel properties | Quadrant properties | ||||||
|---|---|---|---|---|---|---|---|
| Quadrant | DetID | PixID | Counts | Sigma | Mean | Median | Sigma |
| A | 8 | 5 | 976725 | 6378.99 | 752 | 735 | 153.0 |
| A | 13 | 251 | 44350 | 285.06 | 752 | 735 | 153.0 |
| A | 5 | 16 | 26405 | 167.78 | 752 | 735 | 153.0 |
| B | 0 | 219 | 53011 | 362.68 | 763 | 747 | 144.1 |
| B | 8 | 234 | 30624 | 207.33 | 763 | 747 | 144.1 |
| B | 12 | 111 | 14738 | 97.09 | 763 | 747 | 144.1 |
| C | 13 | 61 | 5628 | 29.42 | 725 | 728 | 166.6 |
| C | 10 | 22 | 5294 | 27.41 | 725 | 728 | 166.6 |
| C | 8 | 222 | 2243 | 9.09 | 725 | 728 | 166.6 |
| D | 1 | 52 | 897819 | 4847.31 | 716 | 695 | 185.1 |
| D | 2 | 136 | 65167 | 348.35 | 716 | 695 | 185.1 |
| D | 8 | 195 | 57901 | 309.09 | 716 | 695 | 185.1 |
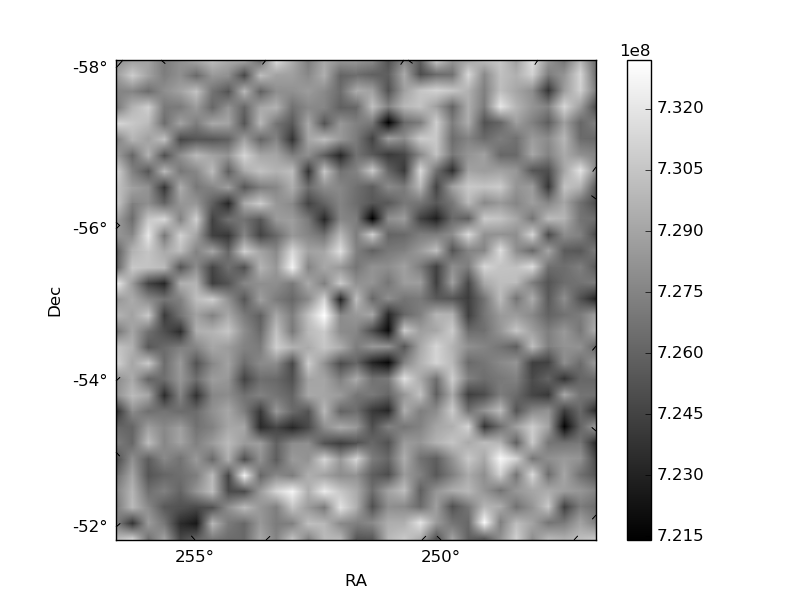
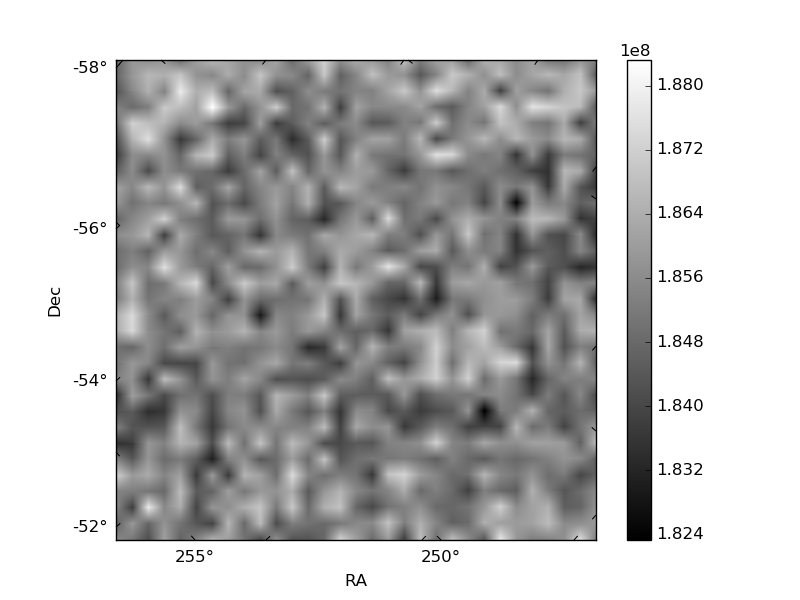
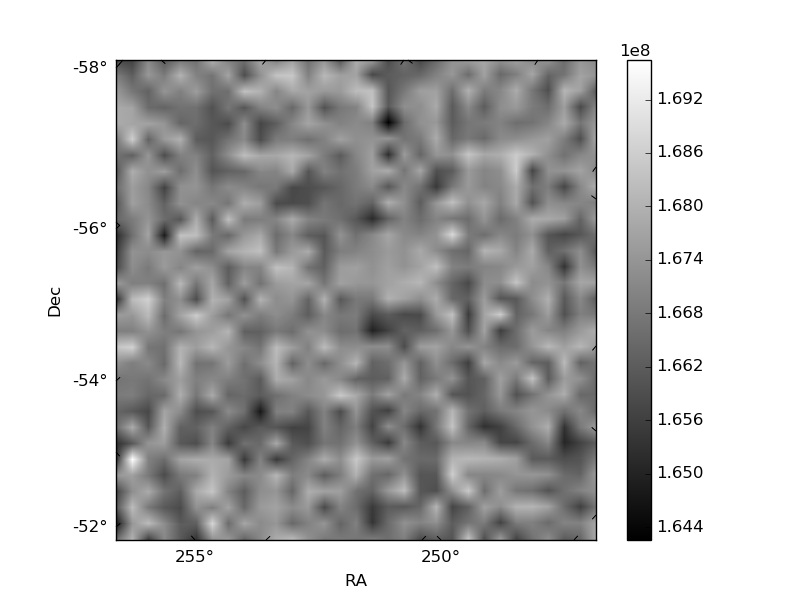
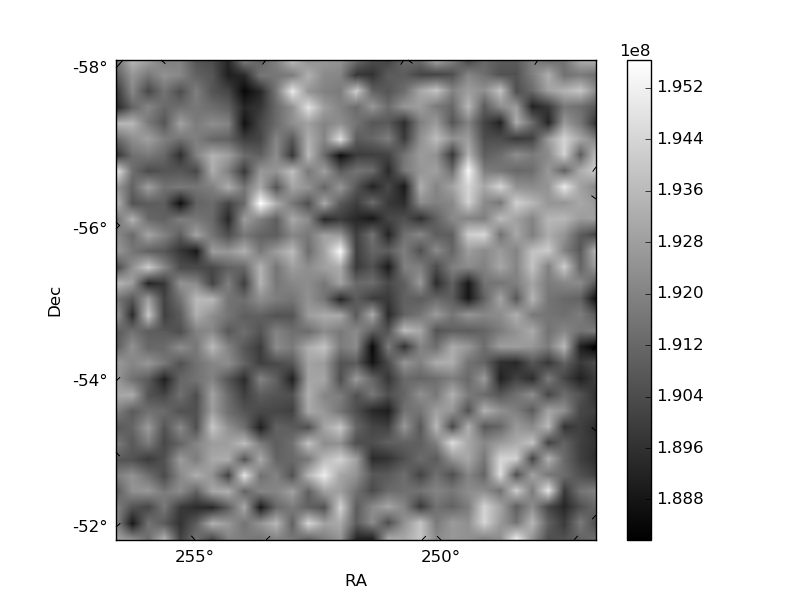
Histogram calculated using DETX and DETY for each event in the final _common_clean file
| Quadrant A | 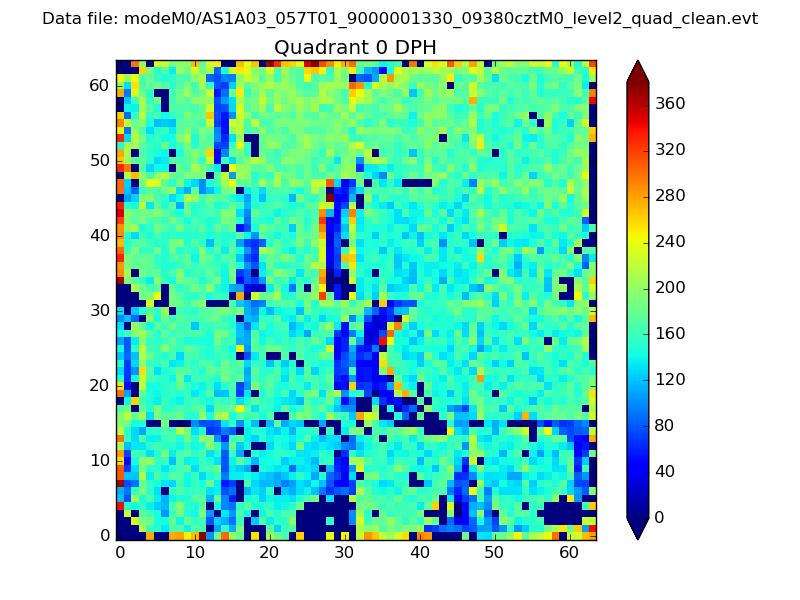 |
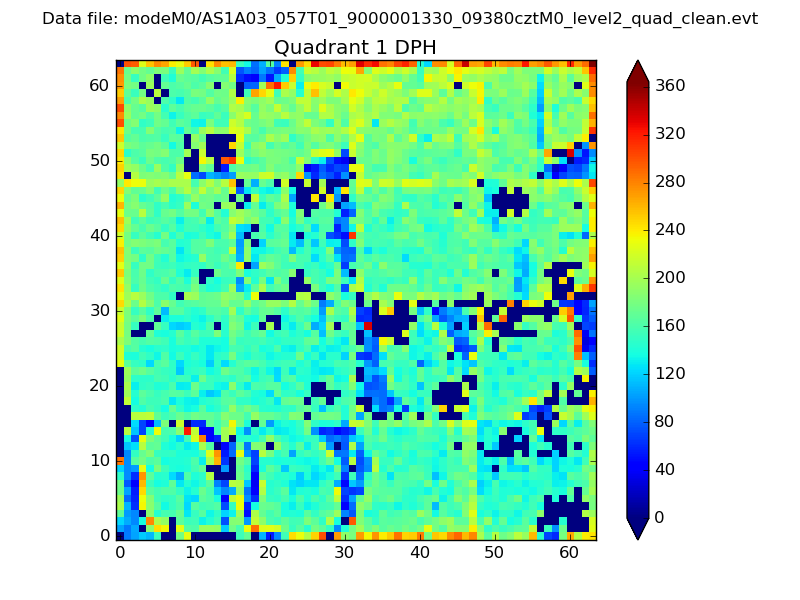 |
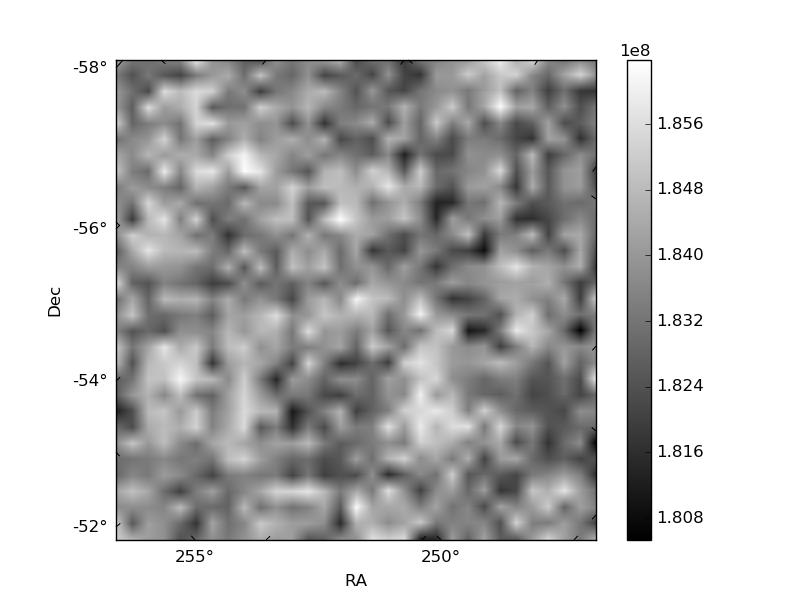
Quadrant B |
|---|---|---|---|
| Quadrant D | 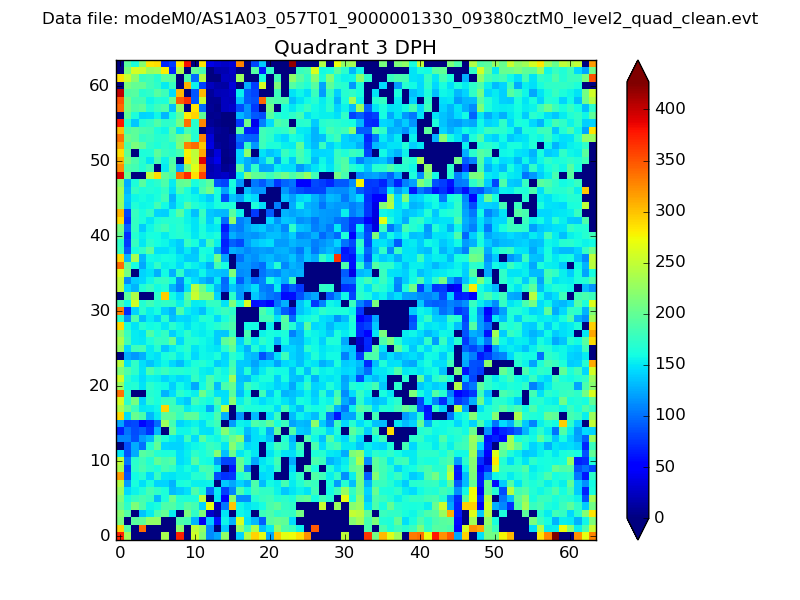 |
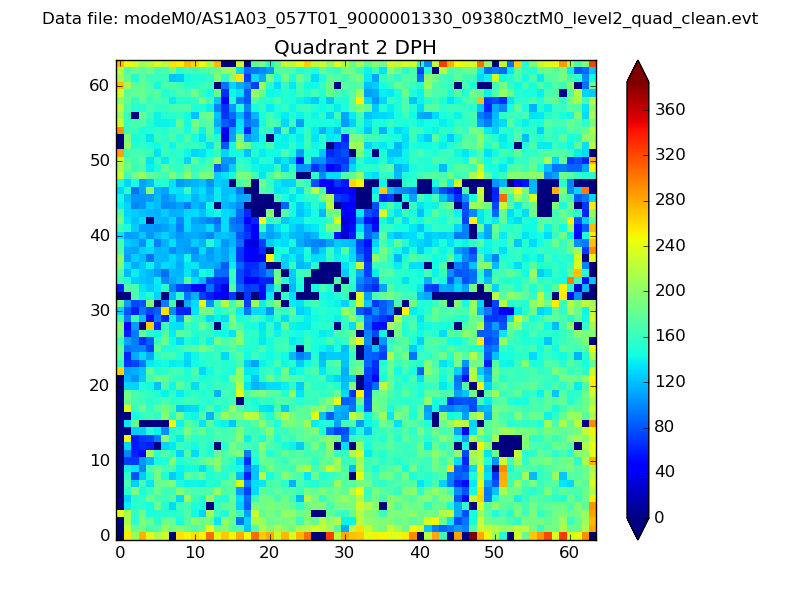 |
Quadrant C |
| Plot type | Count rate plots | Images |
|---|---|---|
| Comparison with Poisson distribution Blue bars denote a histogram of data divided into 1 sec bins. Red curve is a Poisson curve with rate = median count rate of data. |
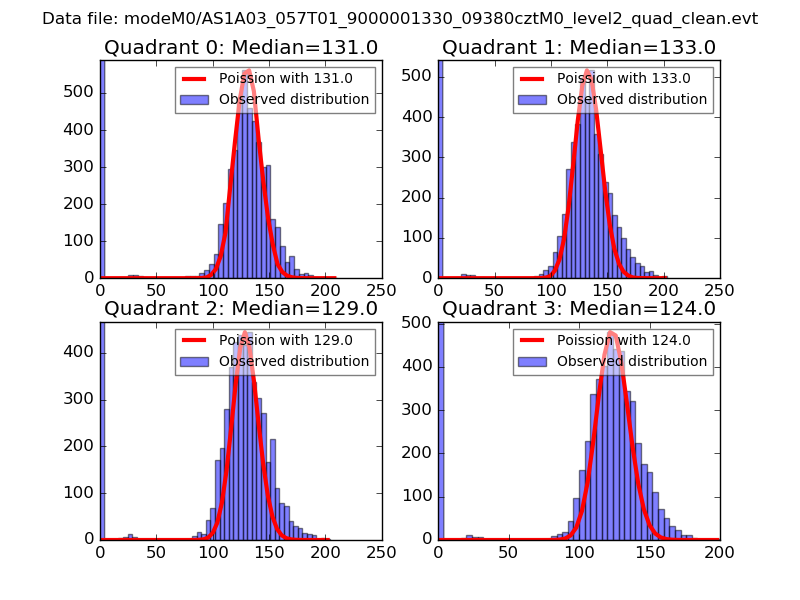 |
 |
| Quadrant-wise count rates Data is divided into 100 sec bins |
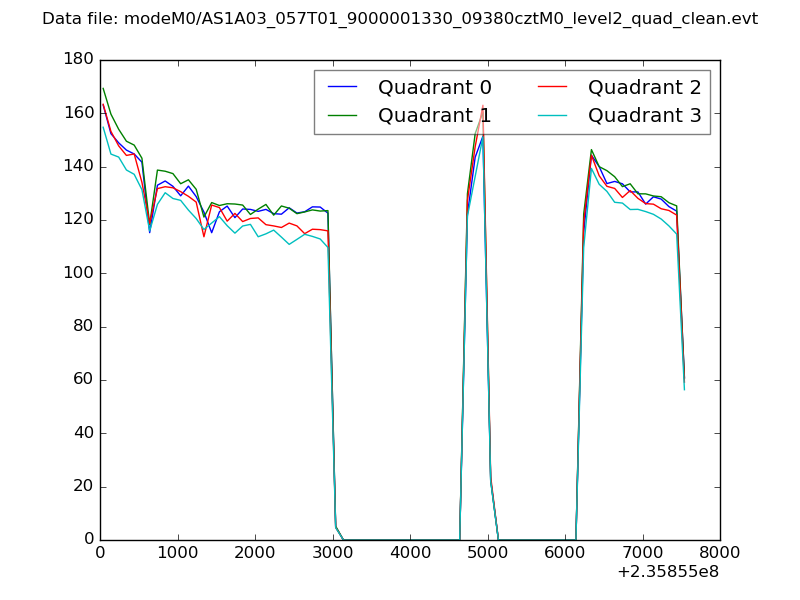 |
|
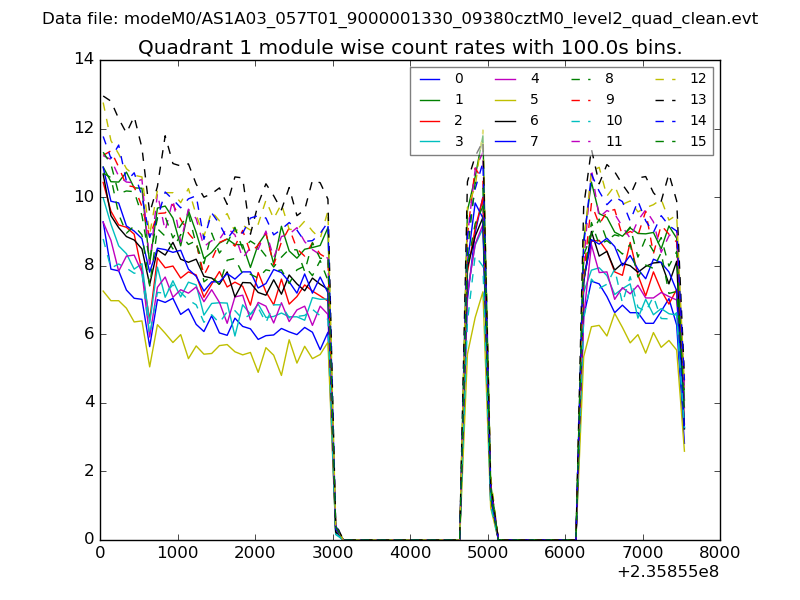
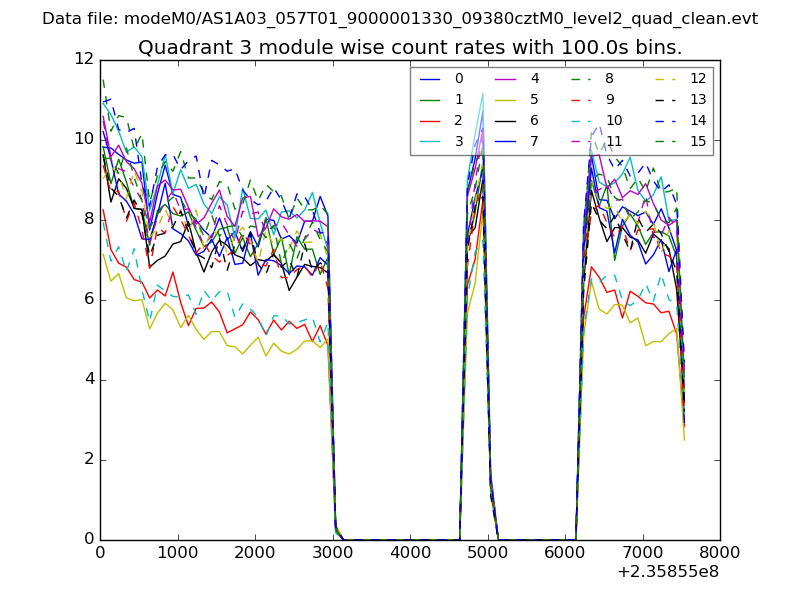
| Module-wise count rates for Quadrant A Data is divided into 100 sec bins |
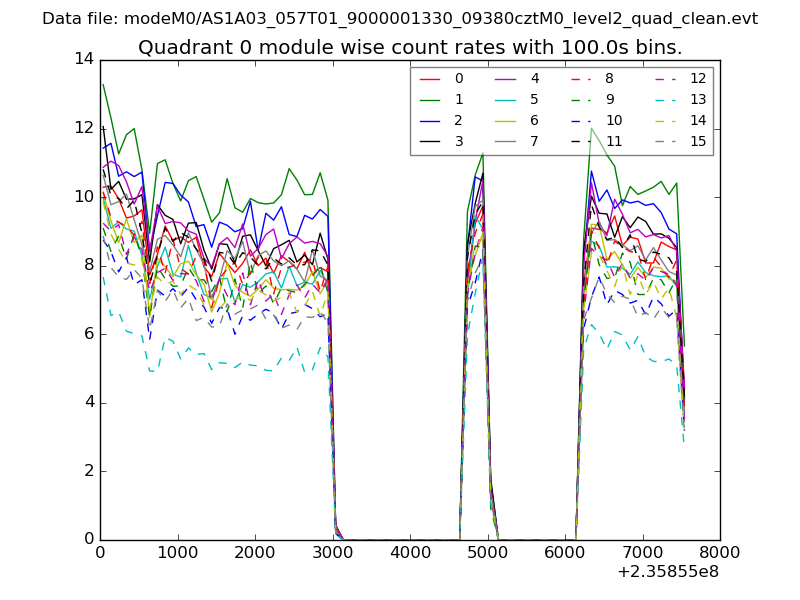 |
 |
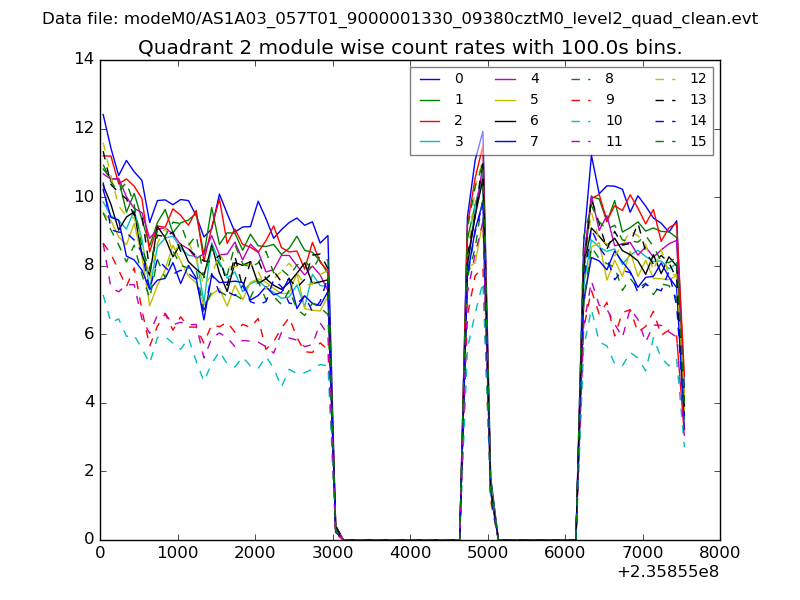
| Module-wise count rates for Quadrant B Data is divided into 100 sec bins |
 |
 |
| Module-wise count rates for Quadrant C Data is divided into 100 sec bins |
 |
 |
| Module-wise count rates for Quadrant D Data is divided into 100 sec bins |
 |
 |
| Parameter | Plot |
|---|---|
| CZT HV Monitor | 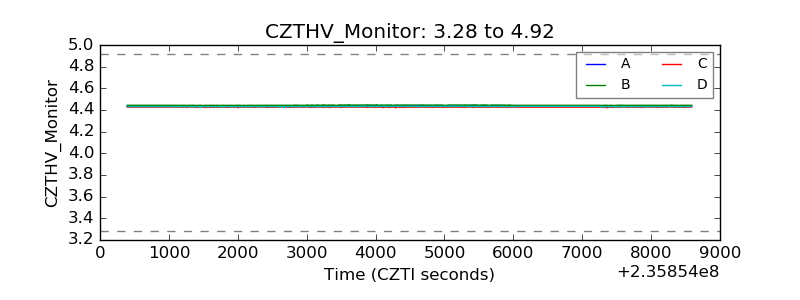 |
| D_VDD | 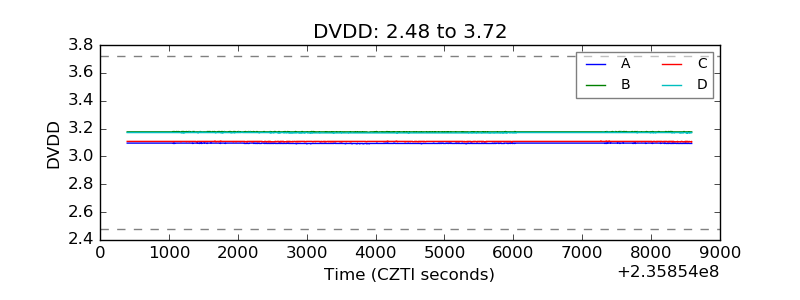 |
| Temperature 1 | 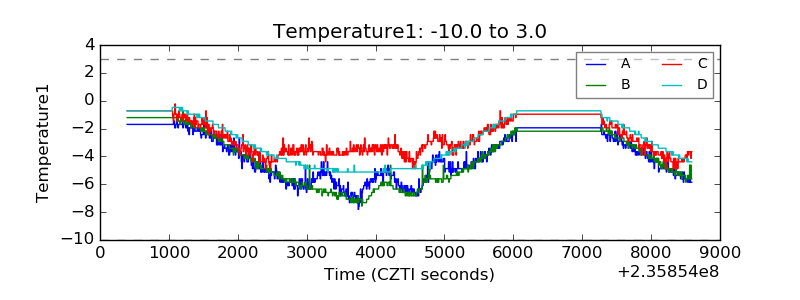 |
| Veto HV Monitor | 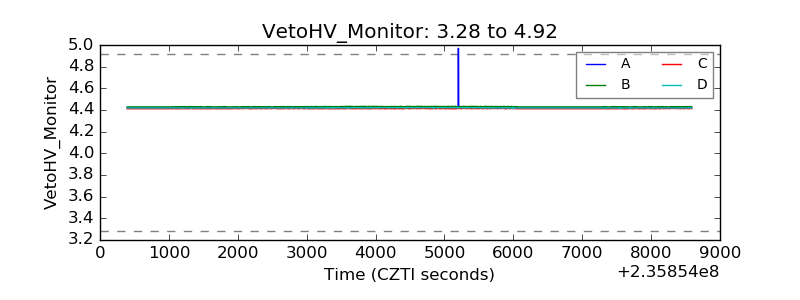 |
| Veto LLD | 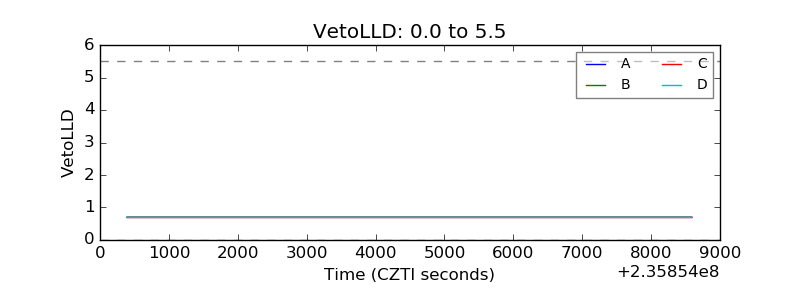 |
| Alpha Counter | 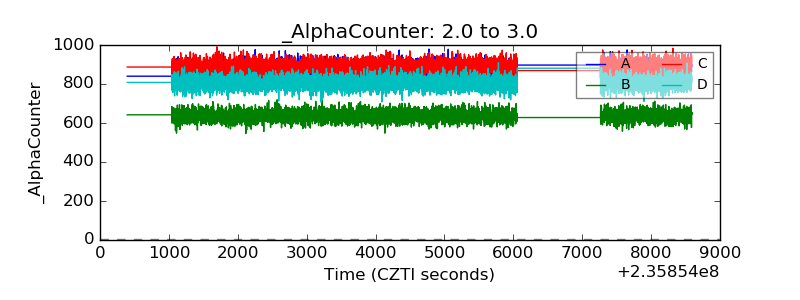 |
| _CPM_Rate | 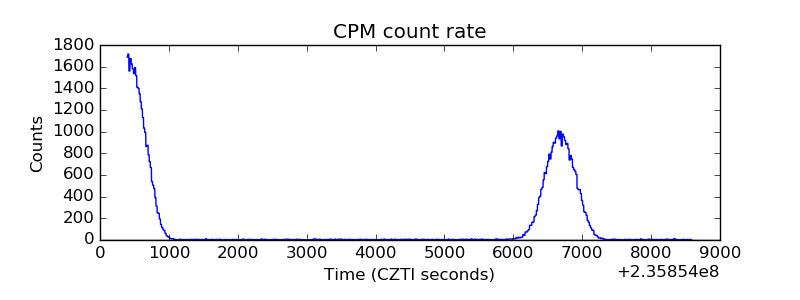 |
| CZT Counter | 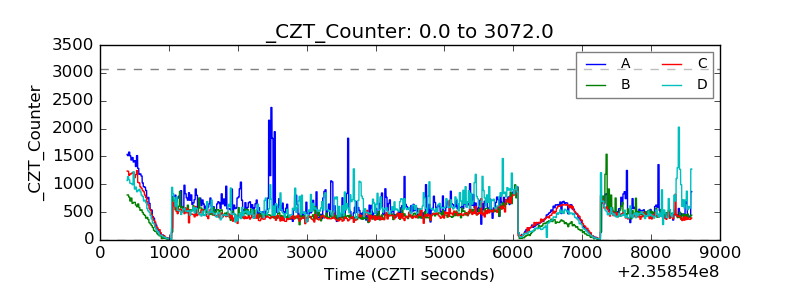 |
| +2.5 Volts monitor | 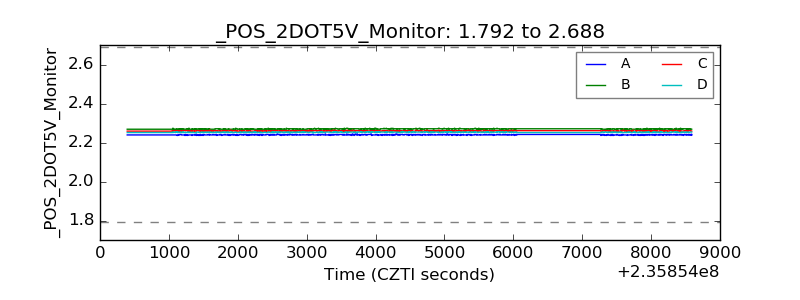 |
| +5 Volts monitor | 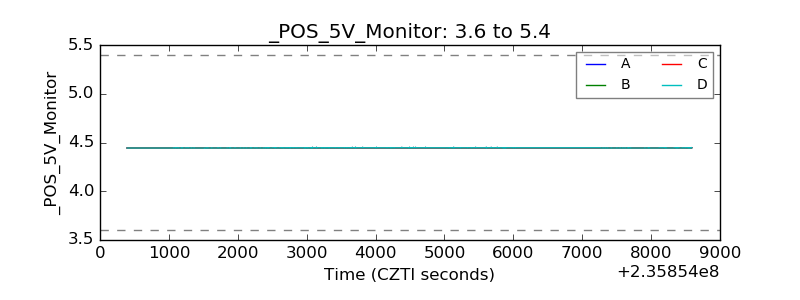 |
| _ROLL_ROT | 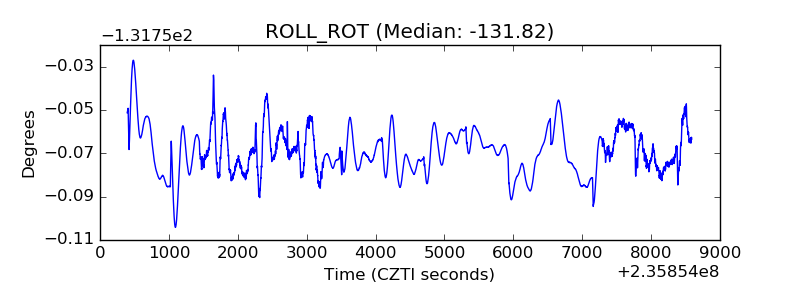 |
| _Roll_DEC | 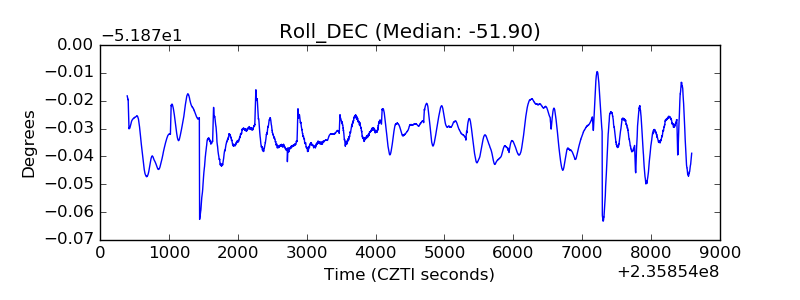 |
| _Roll_RA | 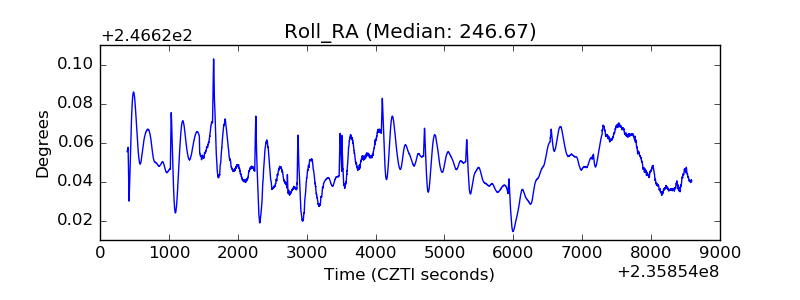 |
| Veto Counter | 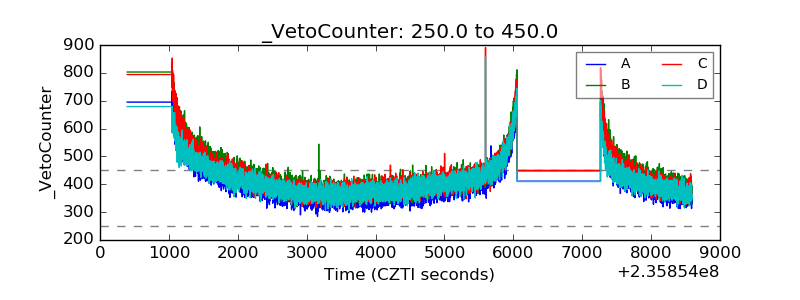 |