| Param | Original file | Final file |
|---|---|---|
| Filename | modeM0/AS1A03_057T01_9000001330_09381cztM0_level2.evt | modeM0/AS1A03_057T01_9000001330_09381cztM0_level2_quad_clean.evt |
| Size (bytes) | 468,653,760 | 93,735,360 |
| Size | 446.9 MB | 89.4 MB |
| Events in quadrant A | 3,931,668 | 603,702 |
| Events in quadrant B | 3,151,593 | 613,975 |
| Events in quadrant C | 2,837,037 | 596,096 |
| Events in quadrant D | 3,832,242 | 572,257 |
| Mode M9 | |||
|---|---|---|---|
| Quadrant | BADHDUFLAG | Total packets | Discarded packets |
| A | 0 | 14 | 0 |
| B | 0 | 14 | 0 |
| C | 0 | 14 | 0 |
| D | 0 | 15 | 0 |
| Mode M0 | |||
|---|---|---|---|
| Quadrant | BADHDUFLAG | Total packets | Discarded packets |
| A | 0 | 16027 | 3 |
| B | 0 | 13793 | 2 |
| C | 0 | 13177 | 2 |
| D | 0 | 16022 | 2 |
| Mode SS | |||
|---|---|---|---|
| Quadrant | BADHDUFLAG | Total packets | Discarded packets |
| A | 0 | 132 | 0 |
| B | 0 | 132 | 0 |
| C | 0 | 132 | 0 |
| D | 0 | 132 | 0 |
| Quadrant | Total seconds | Saturated seconds | Saturation percentage |
|---|---|---|---|
| A | 6487 | 53 | 0.817019% |
| B | 6487 | 32 | 0.493294% |
| C | 6487 | 9 | 0.138739% |
| D | 6487 | 77 | 1.186989% |
Noise dominated data is calculated using 1-second bins in cleaned event files. If a bin has >2000 counts, and if more than 50% of those come from <1% of pixels, then it is considered to be noise-dominated and hence unusable.
| Quadrant | # 1 sec bins | Bins with >0 counts | Bins with >2000 counts | High rate bins dominated by noise | Noise dominated (total time) | Noise dominated (detector-on time) | Marked lightcurve |
|---|---|---|---|---|---|---|---|
| A | 7557 | 6488 | 8 | 8 | 0.11% | 0.12% | 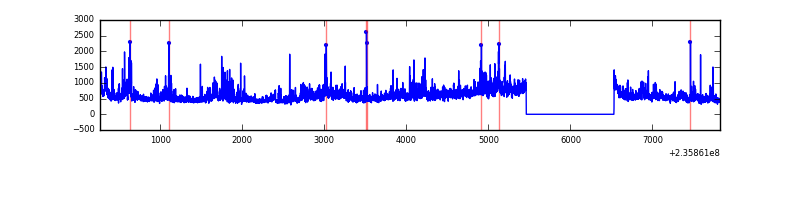 |
| B | 7557 | 6488 | 5 | 5 | 0.07% | 0.08% | 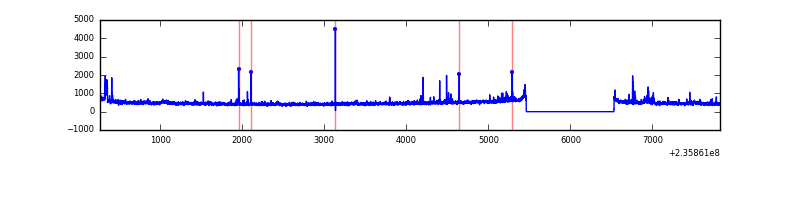 |
| C | 7557 | 6488 | 0 | 0 | 0.00% | 0.00% | 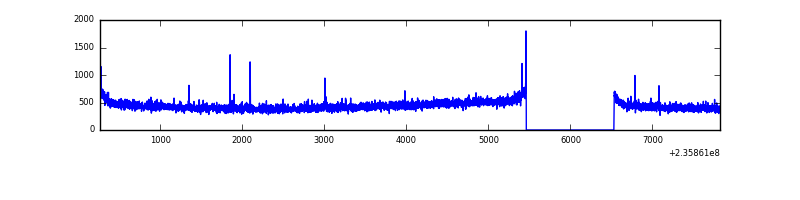 |
| D | 7557 | 6488 | 46 | 46 | 0.61% | 0.71% |  |
Top three noisy pixels from each quadrant. If the there are fewer than three noisy pixels in the level2.evt file, extra rows are filled as -1
| Pixel properties | Quadrant properties | ||||||
|---|---|---|---|---|---|---|---|
| Quadrant | DetID | PixID | Counts | Sigma | Mean | Median | Sigma |
| A | 8 | 5 | 801668 | 5275.31 | 746 | 729 | 151.8 |
| A | 1 | 162 | 93357 | 610.09 | 746 | 729 | 151.8 |
| A | 1 | 178 | 35327 | 227.88 | 746 | 729 | 151.8 |
| B | 0 | 214 | 79343 | 549.21 | 758 | 740 | 143.1 |
| B | 8 | 234 | 43404 | 298.1 | 758 | 740 | 143.1 |
| B | 0 | 219 | 38658 | 264.94 | 758 | 740 | 143.1 |
| C | 5 | 128 | 7587 | 41.06 | 723 | 723 | 167.2 |
| C | 14 | 234 | 6225 | 32.91 | 723 | 723 | 167.2 |
| C | 13 | 61 | 5519 | 28.69 | 723 | 723 | 167.2 |
| D | 1 | 52 | 863225 | 4581.49 | 708 | 689 | 188.3 |
| D | 8 | 195 | 125020 | 660.4 | 708 | 689 | 188.3 |
| D | 13 | 137 | 38787 | 202.36 | 708 | 689 | 188.3 |
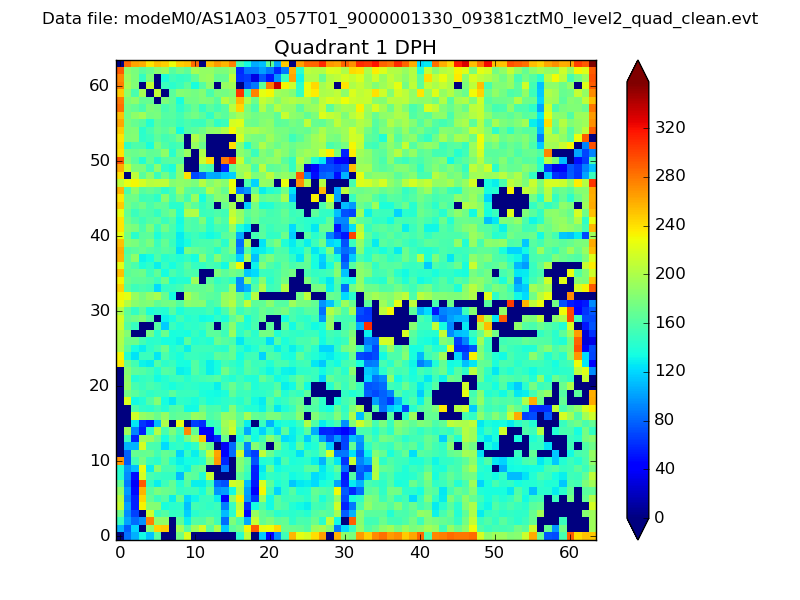
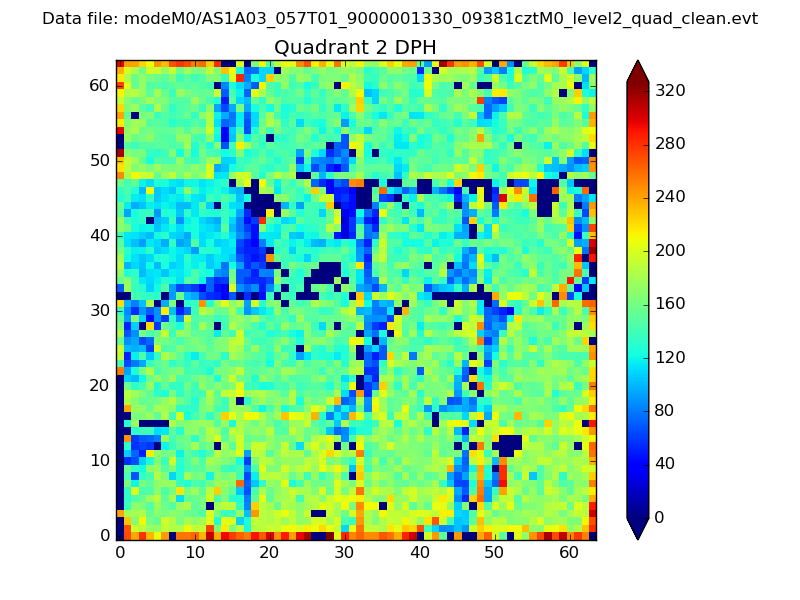
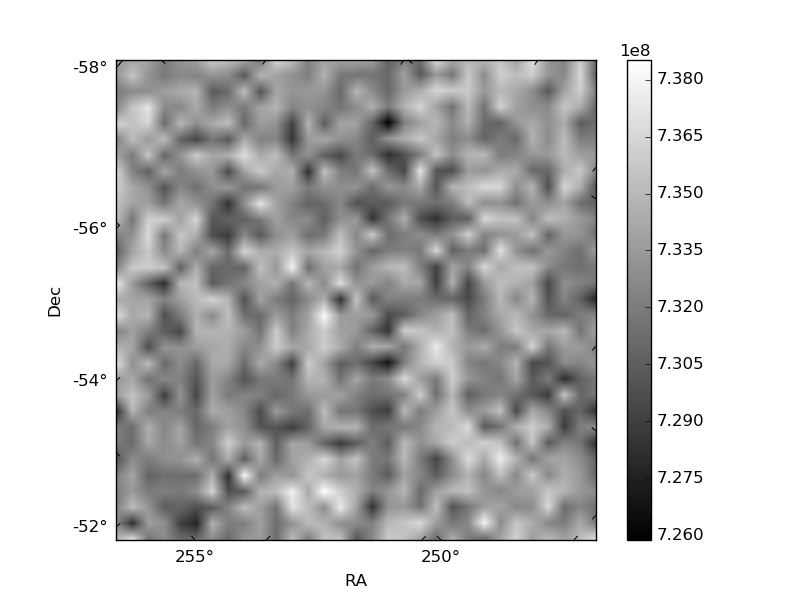
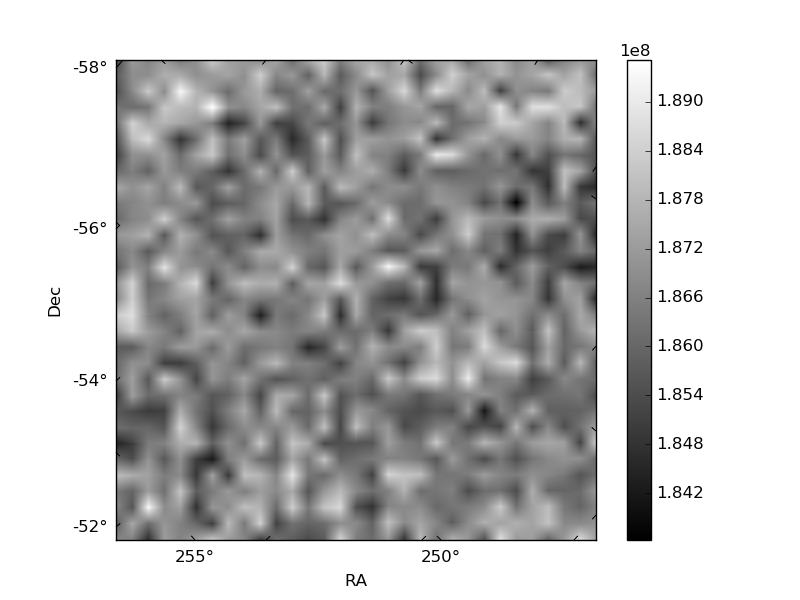
Histogram calculated using DETX and DETY for each event in the final _common_clean file
| Quadrant A | 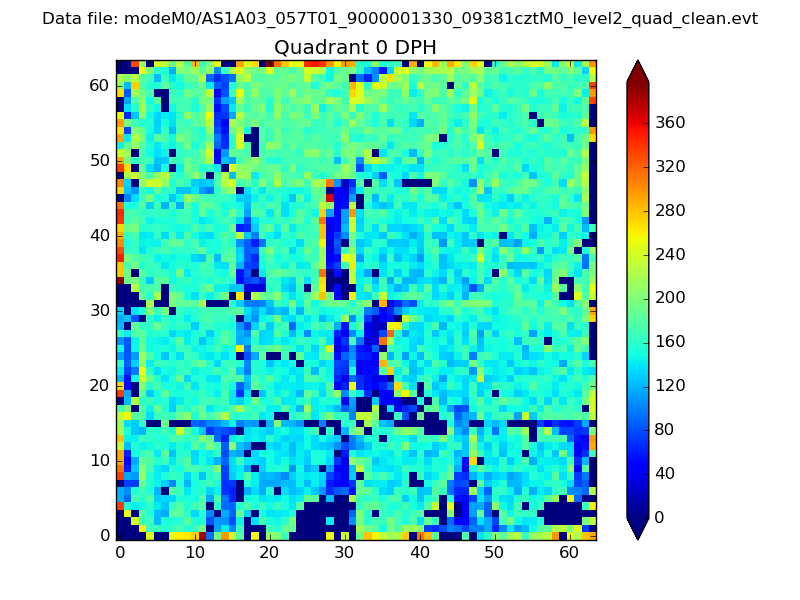 |
 |
Quadrant B |
|---|---|---|---|
| Quadrant D | 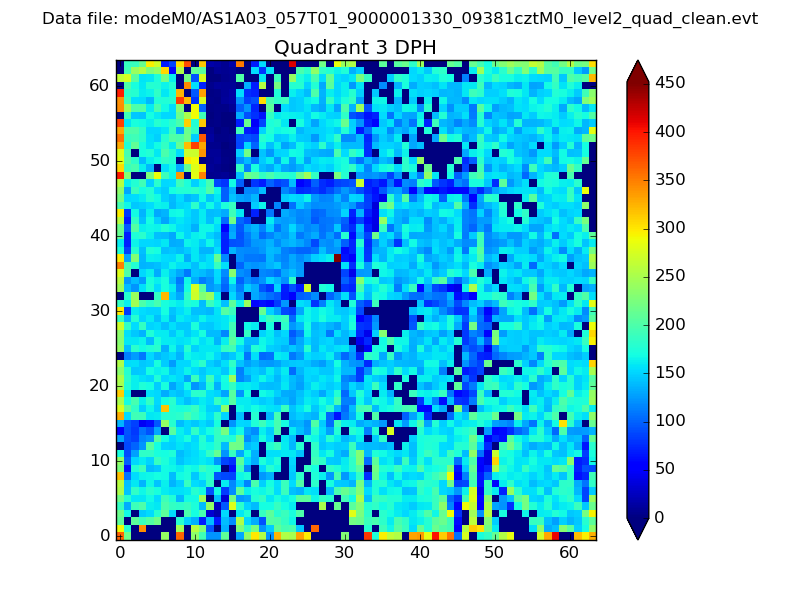 |
 |
Quadrant C |
| Plot type | Count rate plots | Images |
|---|---|---|
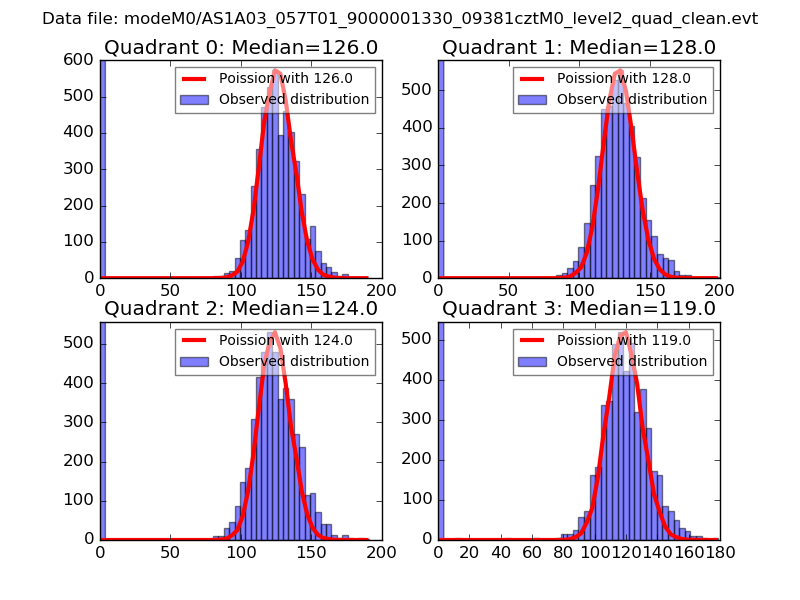
| Comparison with Poisson distribution Blue bars denote a histogram of data divided into 1 sec bins. Red curve is a Poisson curve with rate = median count rate of data. |
 |
 |
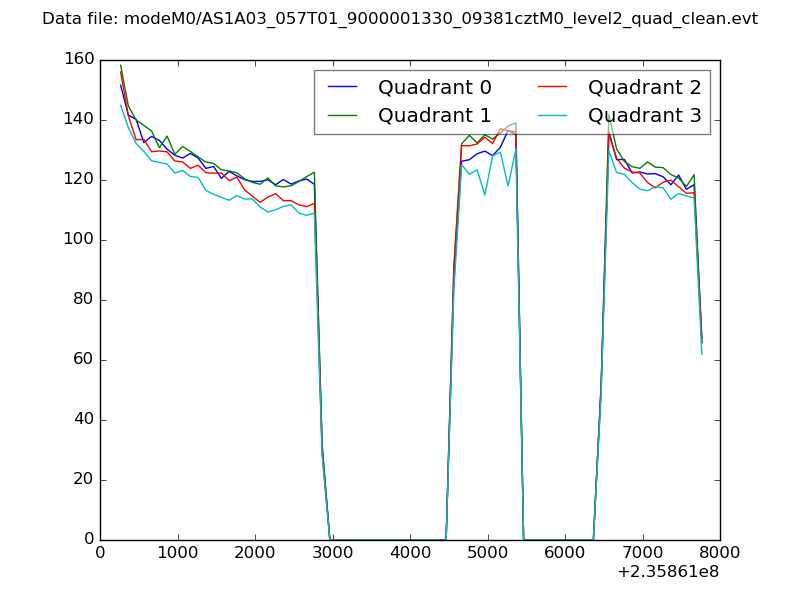
| Quadrant-wise count rates Data is divided into 100 sec bins |
 |
|
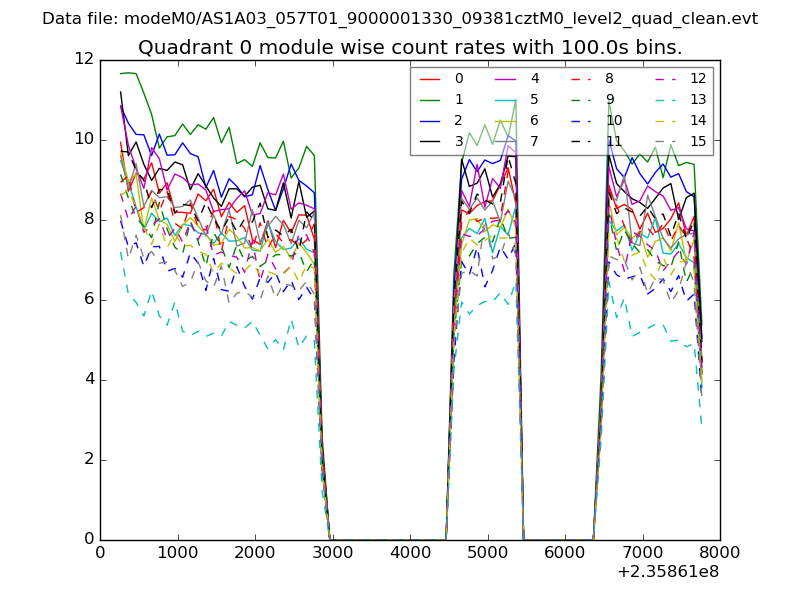
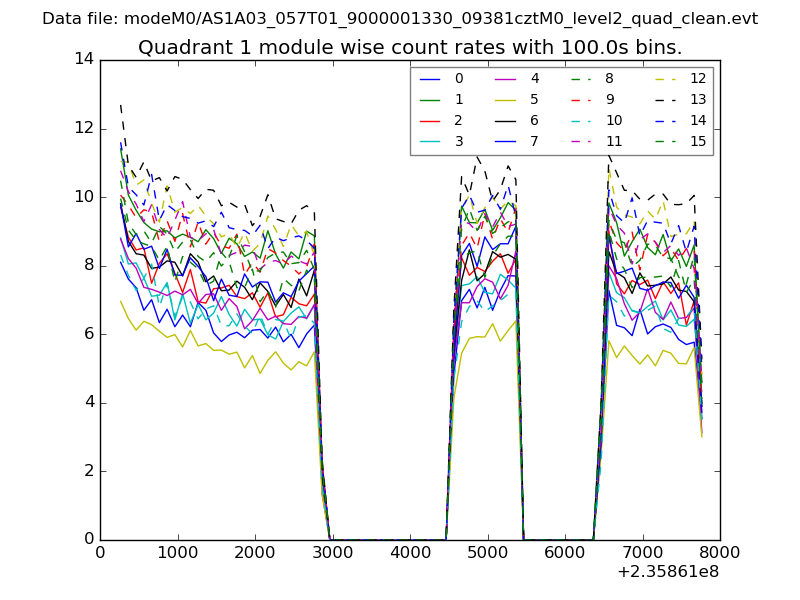
| Module-wise count rates for Quadrant A Data is divided into 100 sec bins |
 |
 |
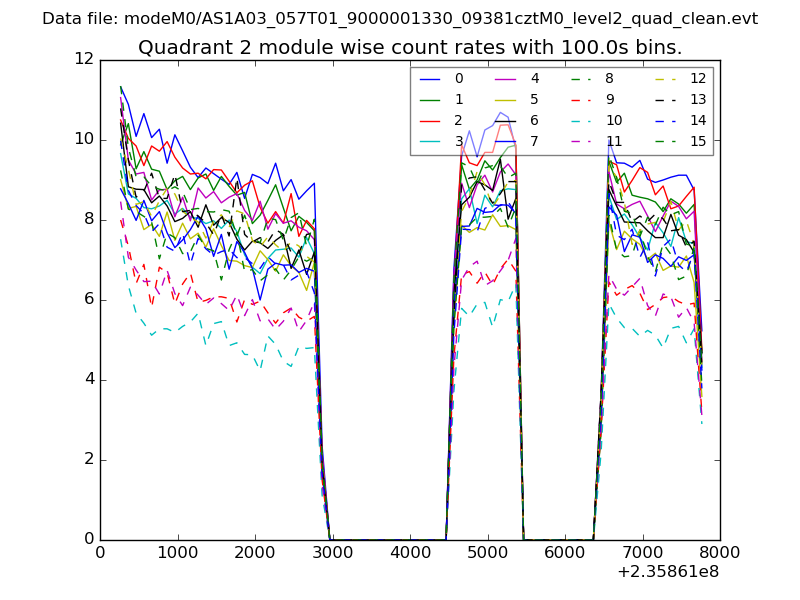
| Module-wise count rates for Quadrant B Data is divided into 100 sec bins |
 |
 |
| Module-wise count rates for Quadrant C Data is divided into 100 sec bins |
 |
 |
| Module-wise count rates for Quadrant D Data is divided into 100 sec bins |
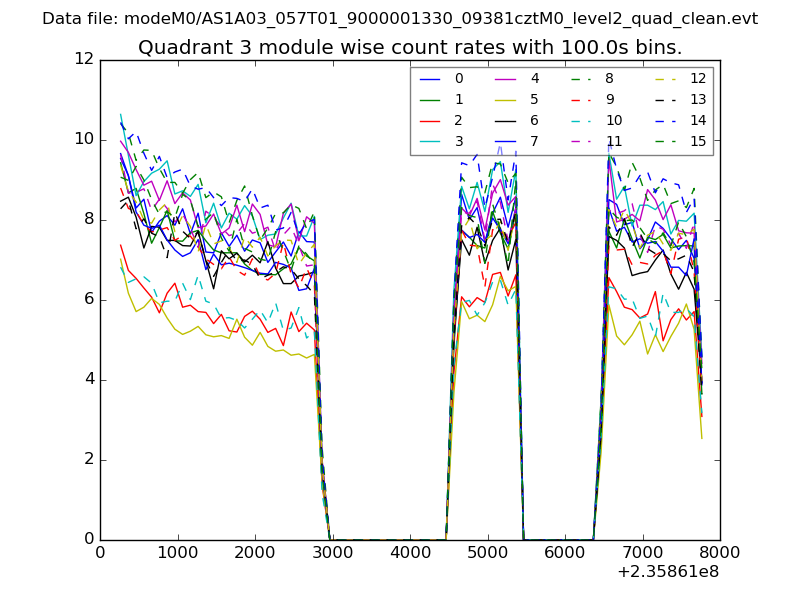 |
 |
| Parameter | Plot |
|---|---|
| CZT HV Monitor | 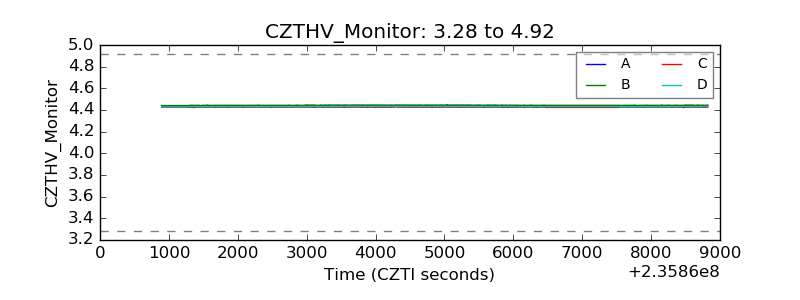 |
| D_VDD | 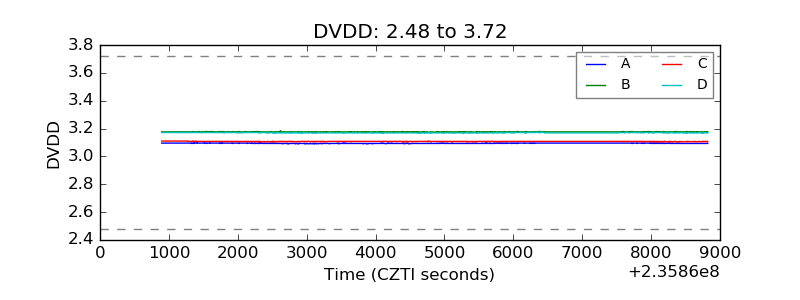 |
| Temperature 1 | 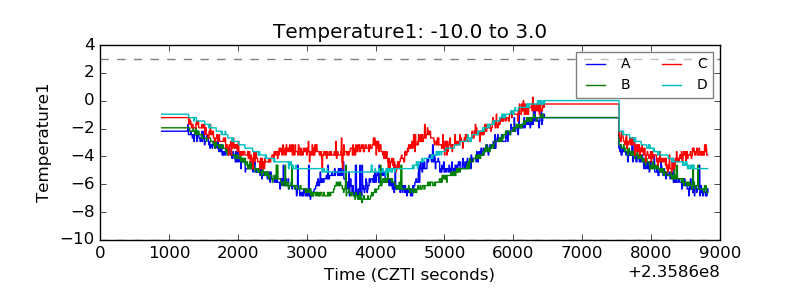 |
| Veto HV Monitor | 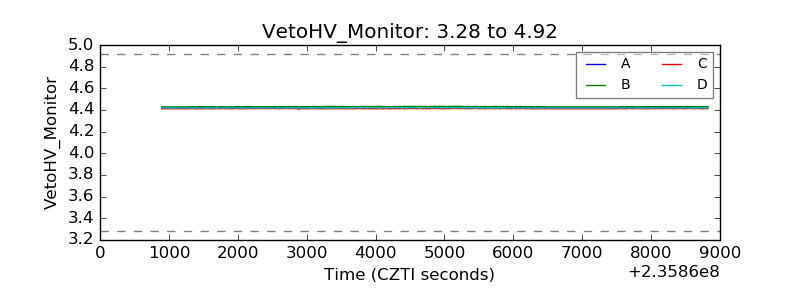 |
| Veto LLD | 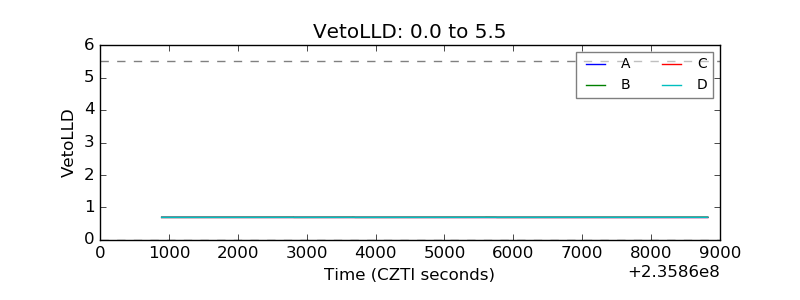 |
| Alpha Counter | 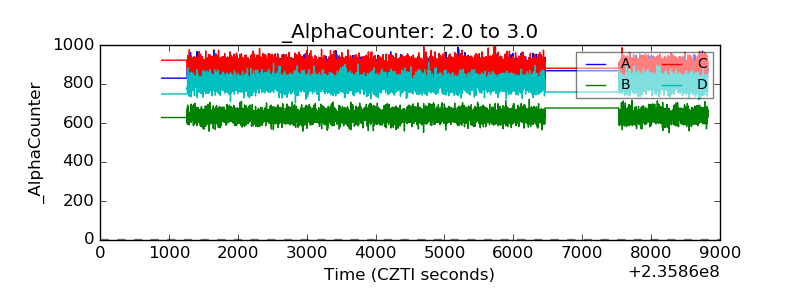 |
| _CPM_Rate | 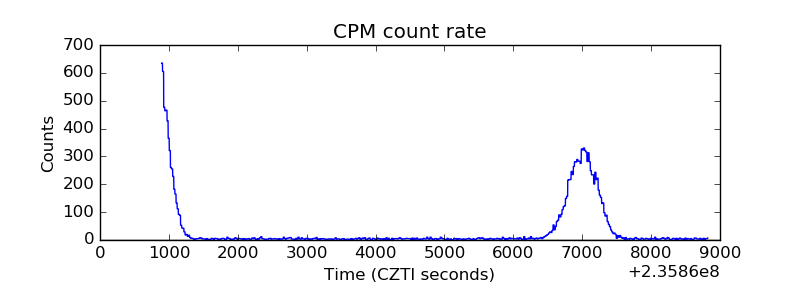 |
| CZT Counter | 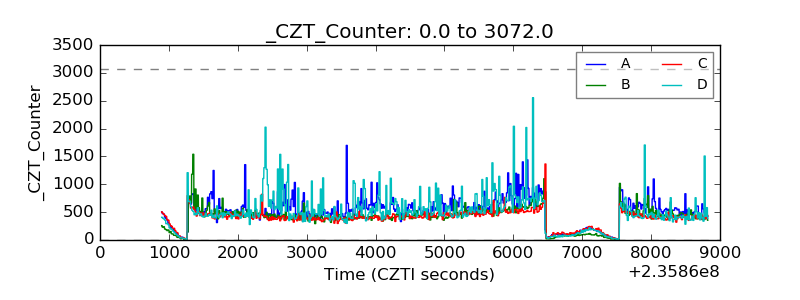 |
| +2.5 Volts monitor |  |
| +5 Volts monitor |  |
| _ROLL_ROT | 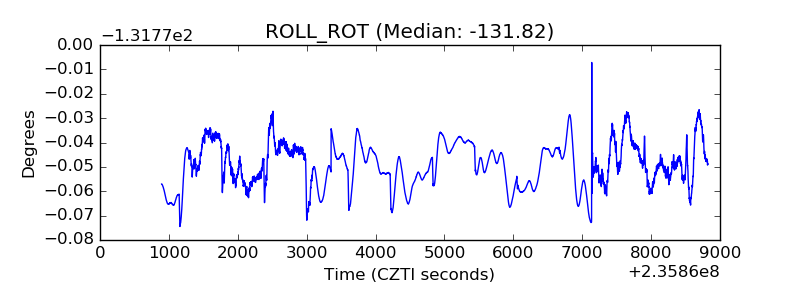 |
| _Roll_DEC | 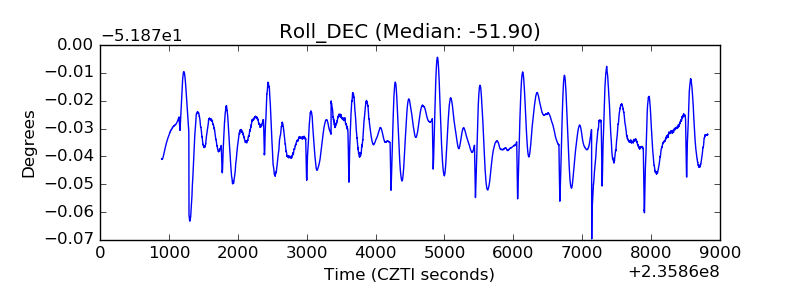 |
| _Roll_RA | 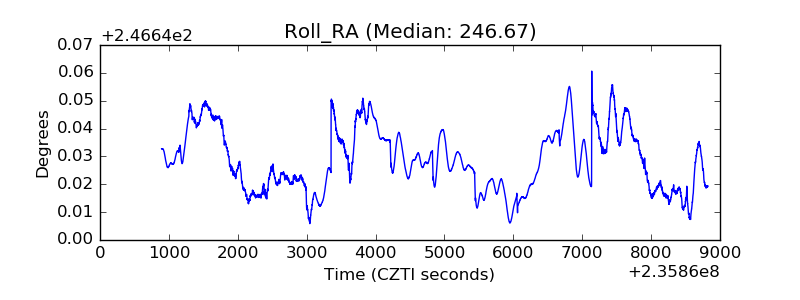 |
| Veto Counter | 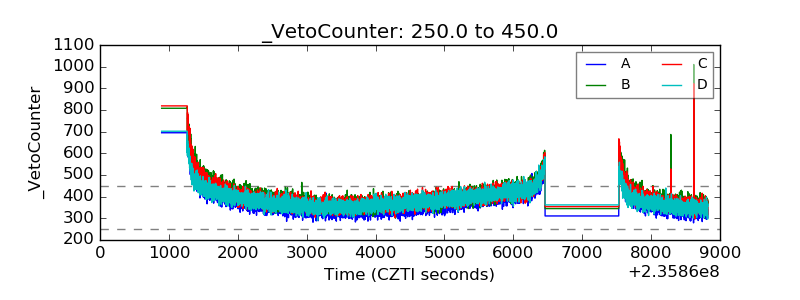 |