| Param | Original file | Final file |
|---|---|---|
| Filename | modeM0/AS1A03_057T01_9000001330_09383cztM0_level2.evt | modeM0/AS1A03_057T01_9000001330_09383cztM0_level2_quad_clean.evt |
| Size (bytes) | 880,323,840 | 175,322,880 |
| Size | 839.5 MB | 167.2 MB |
| Events in quadrant A | 7,339,104 | 1,119,625 |
| Events in quadrant B | 6,005,366 | 1,131,971 |
| Events in quadrant C | 5,517,171 | 1,104,037 |
| Events in quadrant D | 6,931,267 | 1,068,234 |
| Mode M9 | |||
|---|---|---|---|
| Quadrant | BADHDUFLAG | Total packets | Discarded packets |
| A | 0 | 10 | 0 |
| B | 0 | 10 | 0 |
| C | 0 | 10 | 0 |
| D | 0 | 10 | 0 |
| Mode M0 | |||
|---|---|---|---|
| Quadrant | BADHDUFLAG | Total packets | Discarded packets |
| A | 0 | 30411 | 3 |
| B | 0 | 26774 | 2 |
| C | 0 | 25918 | 2 |
| D | 0 | 29911 | 2 |
| Mode SS | |||
|---|---|---|---|
| Quadrant | BADHDUFLAG | Total packets | Discarded packets |
| A | 0 | 262 | 0 |
| B | 0 | 262 | 0 |
| C | 0 | 262 | 0 |
| D | 0 | 262 | 0 |
| Quadrant | Total seconds | Saturated seconds | Saturation percentage |
|---|---|---|---|
| A | 12815 | 113 | 0.881779% |
| B | 12815 | 90 | 0.702302% |
| C | 12815 | 39 | 0.304331% |
| D | 12815 | 134 | 1.045650% |
Noise dominated data is calculated using 1-second bins in cleaned event files. If a bin has >2000 counts, and if more than 50% of those come from <1% of pixels, then it is considered to be noise-dominated and hence unusable.
| Quadrant | # 1 sec bins | Bins with >0 counts | Bins with >2000 counts | High rate bins dominated by noise | Noise dominated (total time) | Noise dominated (detector-on time) | Marked lightcurve |
|---|---|---|---|---|---|---|---|
| A | 13831 | 12817 | 9 | 9 | 0.07% | 0.07% |  |
| B | 13831 | 12817 | 9 | 9 | 0.07% | 0.07% |  |
| C | 13831 | 12817 | 0 | 0 | 0.00% | 0.00% | 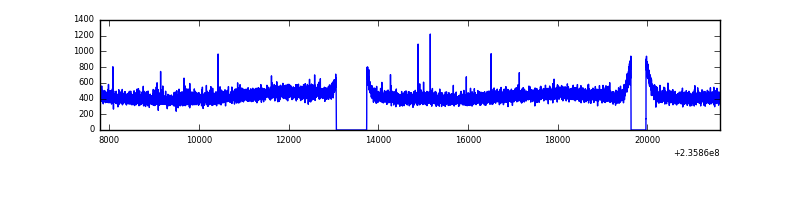 |
| D | 13831 | 12817 | 74 | 74 | 0.54% | 0.58% |  |
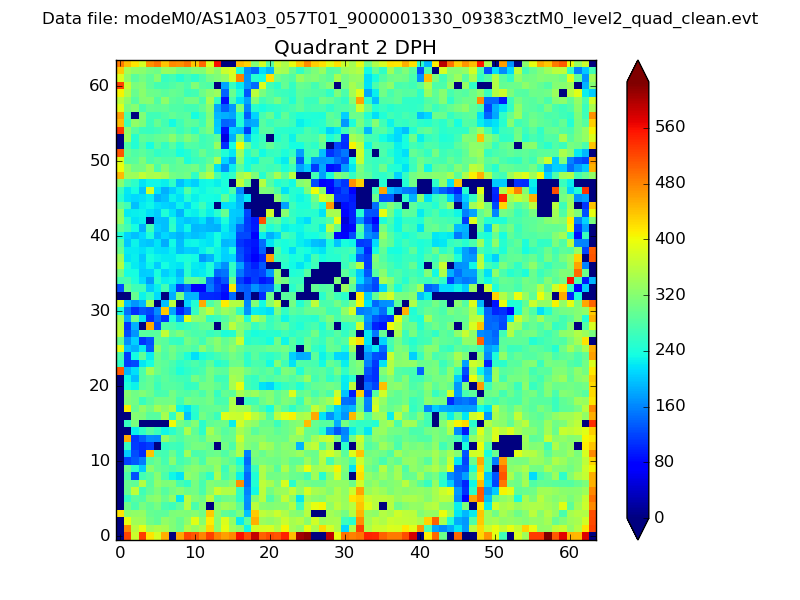
Top three noisy pixels from each quadrant. If the there are fewer than three noisy pixels in the level2.evt file, extra rows are filled as -1
| Pixel properties | Quadrant properties | ||||||
|---|---|---|---|---|---|---|---|
| Quadrant | DetID | PixID | Counts | Sigma | Mean | Median | Sigma |
| A | 8 | 5 | 936659 | 3165.36 | 1449 | 1418 | 295.5 |
| A | 1 | 162 | 340718 | 1148.38 | 1449 | 1418 | 295.5 |
| A | 1 | 178 | 141572 | 474.36 | 1449 | 1418 | 295.5 |
| B | 0 | 214 | 146006 | 523.07 | 1465 | 1426 | 276.4 |
| B | 0 | 219 | 54409 | 191.68 | 1465 | 1426 | 276.4 |
| B | 0 | 197 | 48358 | 169.79 | 1465 | 1426 | 276.4 |
| C | 13 | 61 | 10610 | 28.11 | 1409 | 1412 | 327.2 |
| C | 5 | 128 | 9354 | 24.27 | 1409 | 1412 | 327.2 |
| C | 14 | 67 | 5440 | 12.31 | 1409 | 1412 | 327.2 |
| D | 1 | 52 | 531596 | 1469.45 | 1391 | 1356 | 360.8 |
| D | 12 | 233 | 487570 | 1347.44 | 1391 | 1356 | 360.8 |
| D | 8 | 195 | 178866 | 491.93 | 1391 | 1356 | 360.8 |
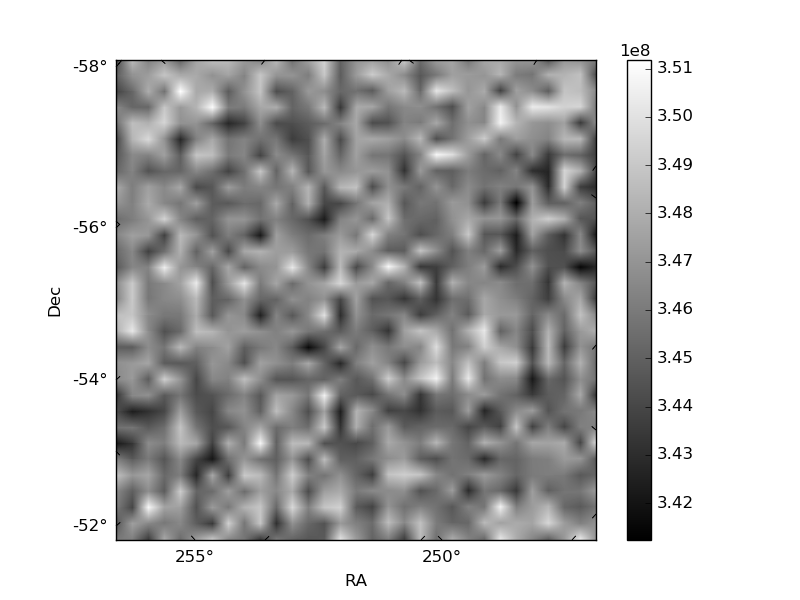
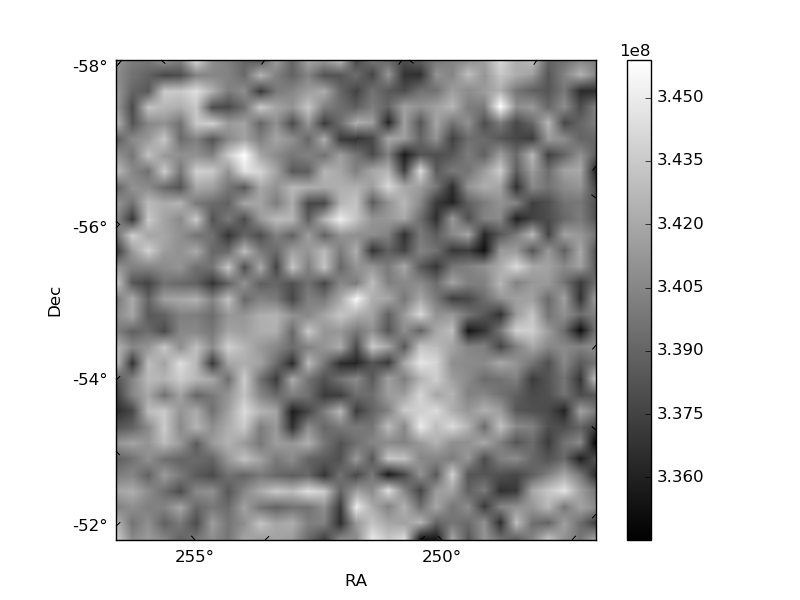
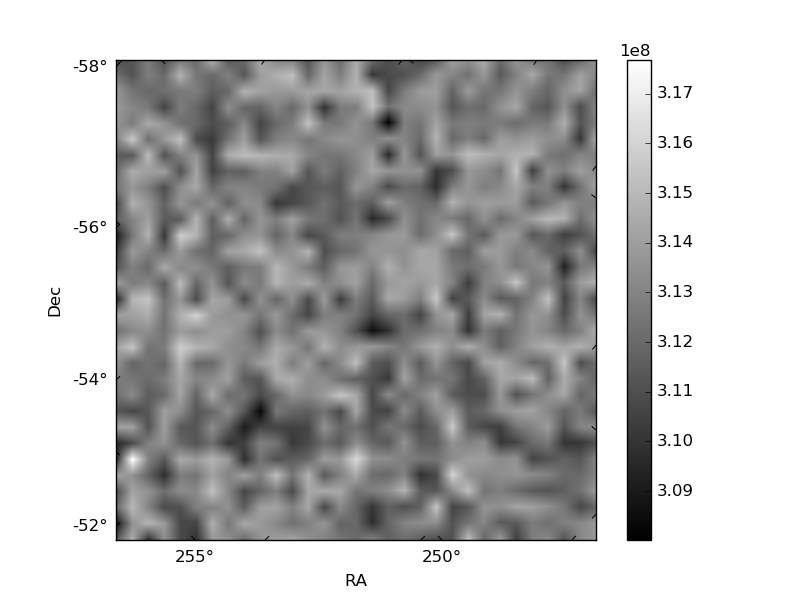
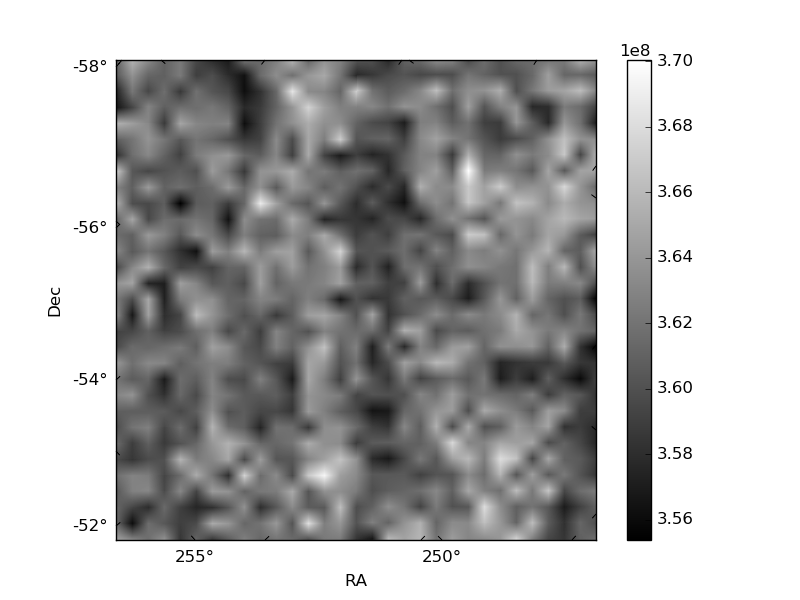
Histogram calculated using DETX and DETY for each event in the final _common_clean file
| Quadrant A | 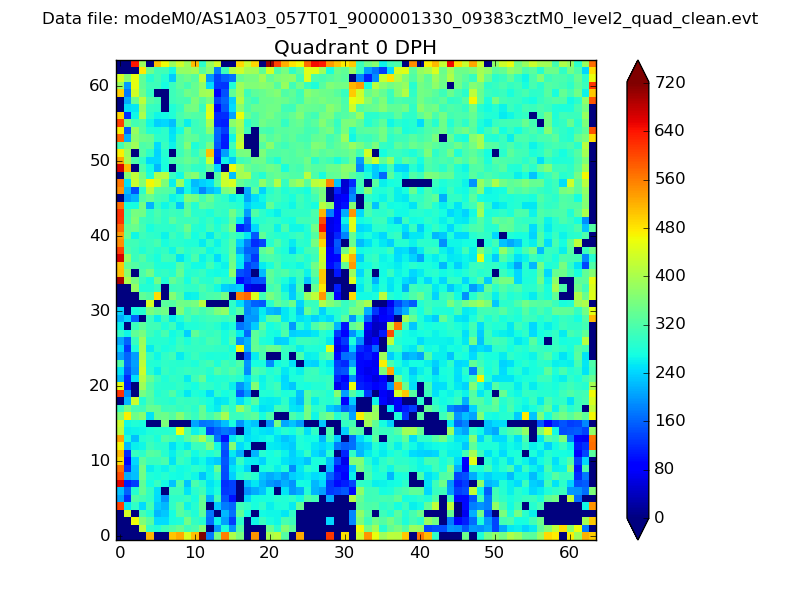 |
 |
Quadrant B |
|---|---|---|---|
| Quadrant D | 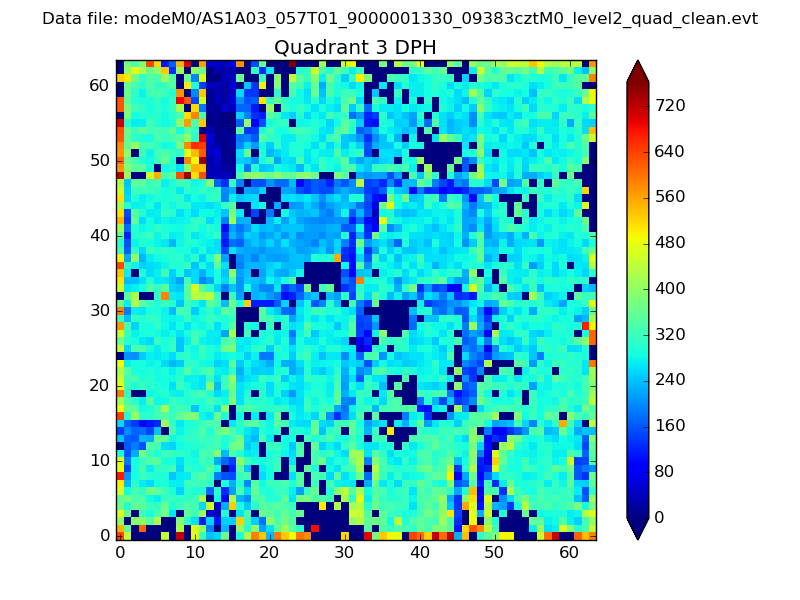 |
 |
Quadrant C |
| Plot type | Count rate plots | Images |
|---|---|---|
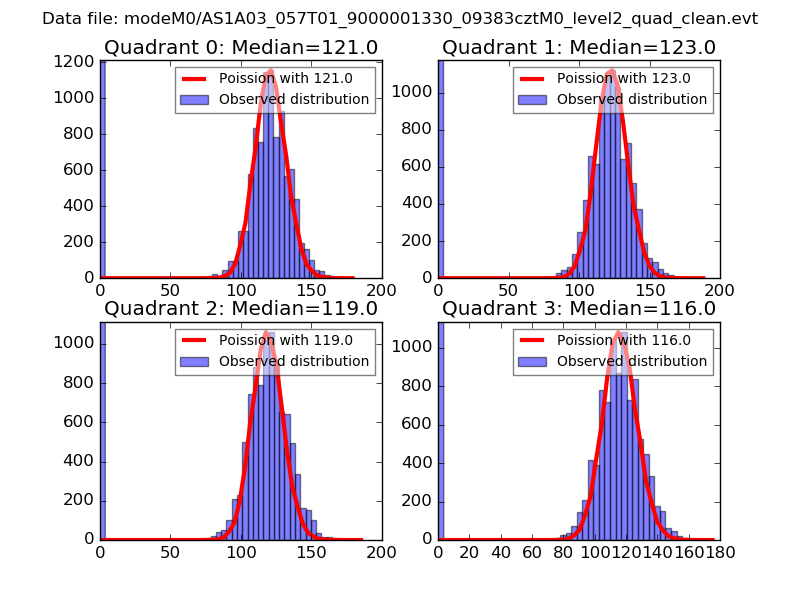
| Comparison with Poisson distribution Blue bars denote a histogram of data divided into 1 sec bins. Red curve is a Poisson curve with rate = median count rate of data. |
 |
 |
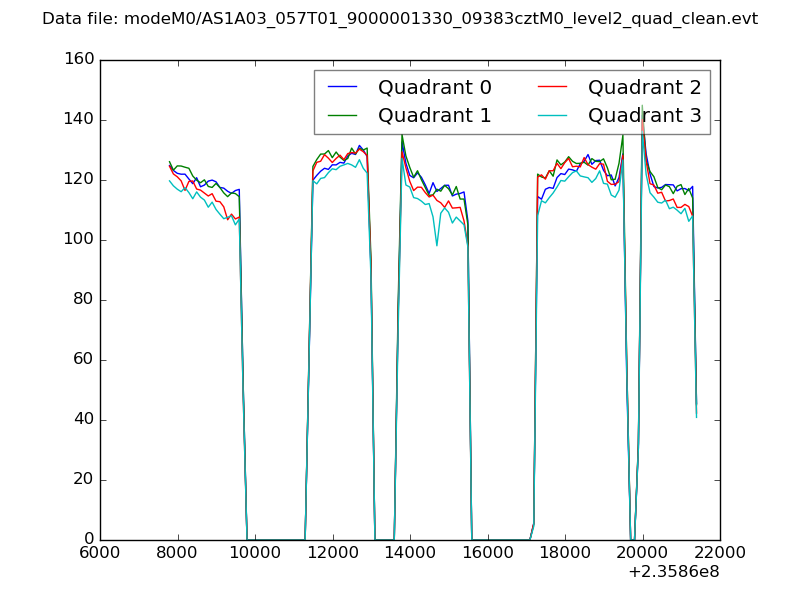
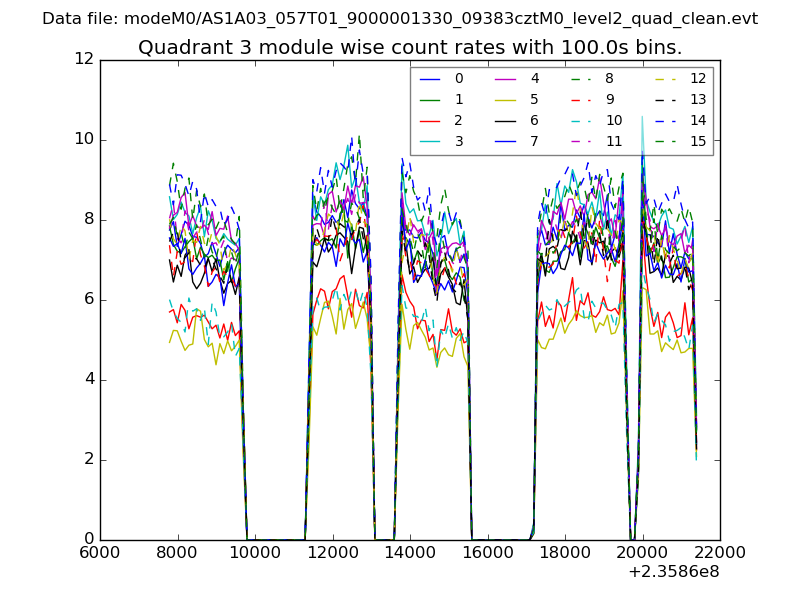
| Quadrant-wise count rates Data is divided into 100 sec bins |
 |
|
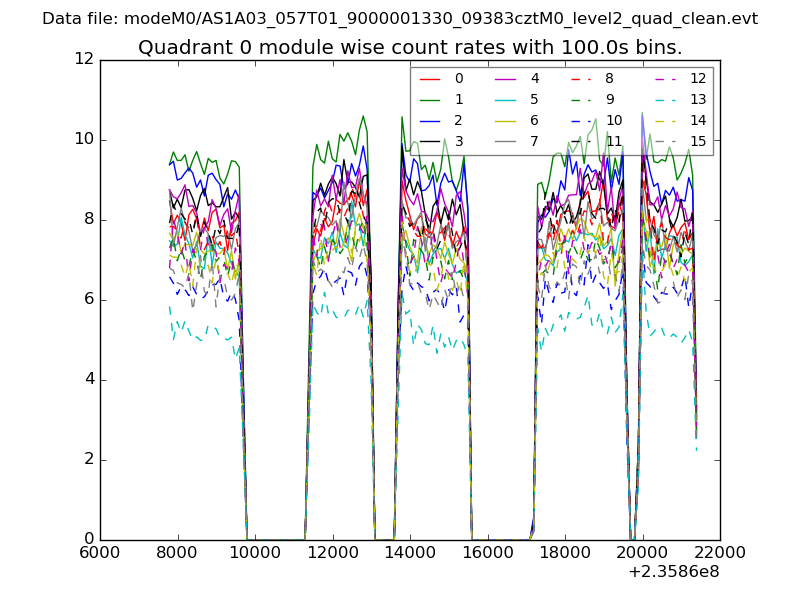
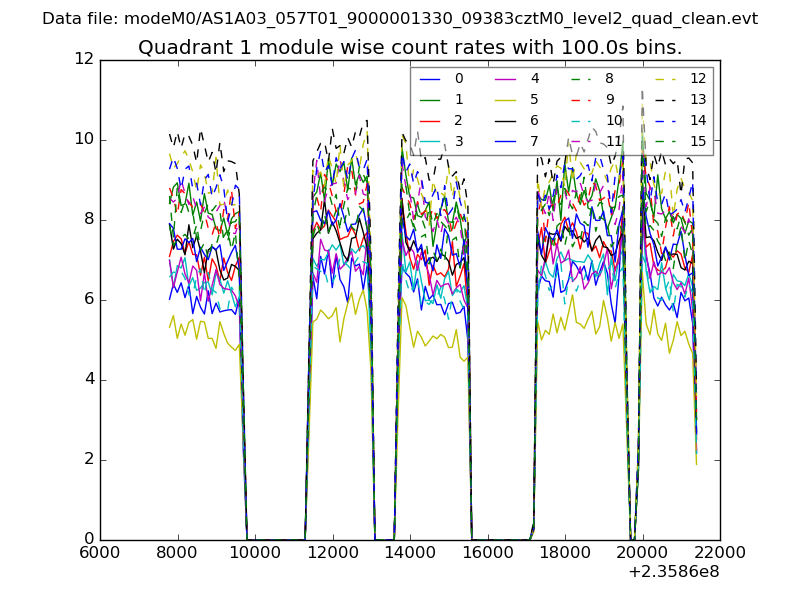
| Module-wise count rates for Quadrant A Data is divided into 100 sec bins |
 |
 |
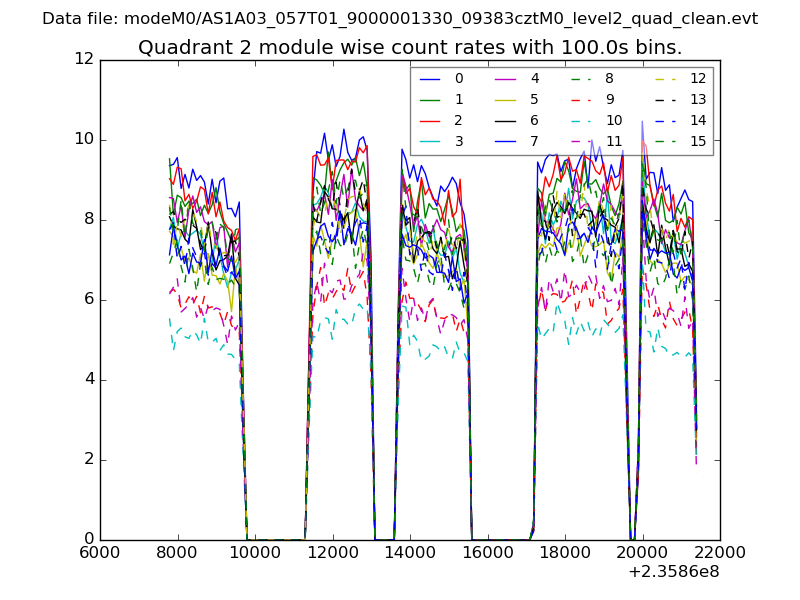
| Module-wise count rates for Quadrant B Data is divided into 100 sec bins |
 |
 |
| Module-wise count rates for Quadrant C Data is divided into 100 sec bins |
 |
 |
| Module-wise count rates for Quadrant D Data is divided into 100 sec bins |
 |
 |
| Parameter | Plot |
|---|---|
| CZT HV Monitor | 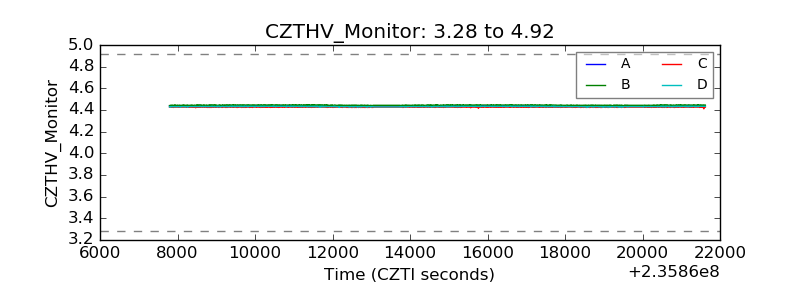 |
| D_VDD | 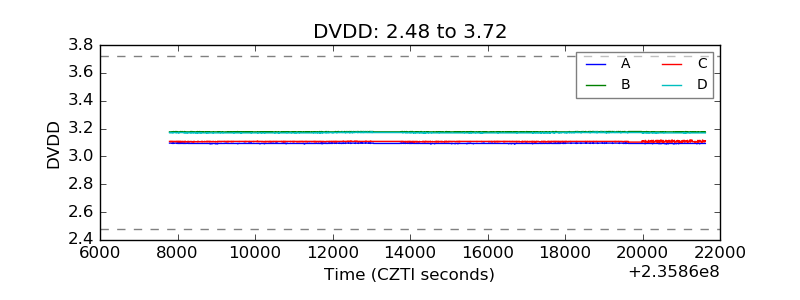 |
| Temperature 1 | 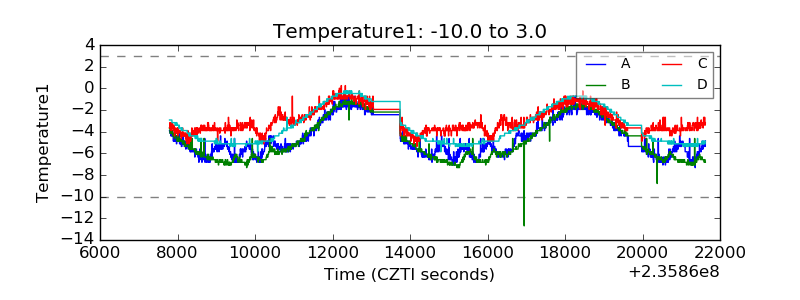 |
| Veto HV Monitor | 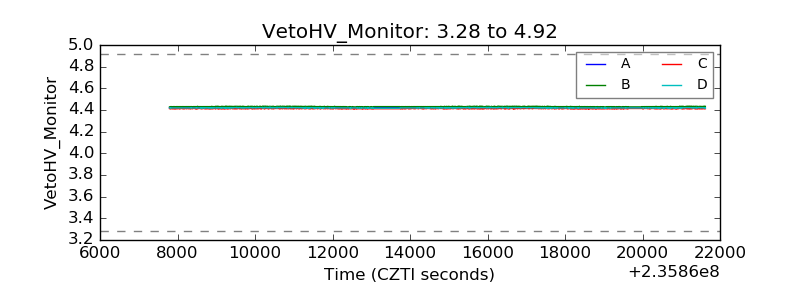 |
| Veto LLD |  |
| Alpha Counter | 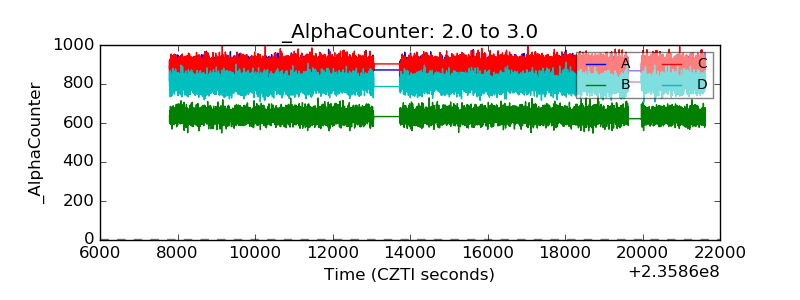 |
| _CPM_Rate | 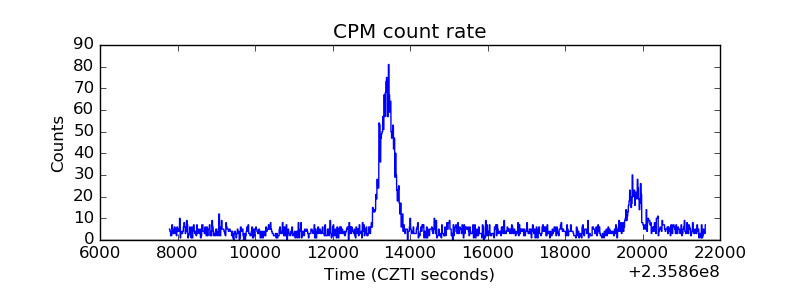 |
| CZT Counter | 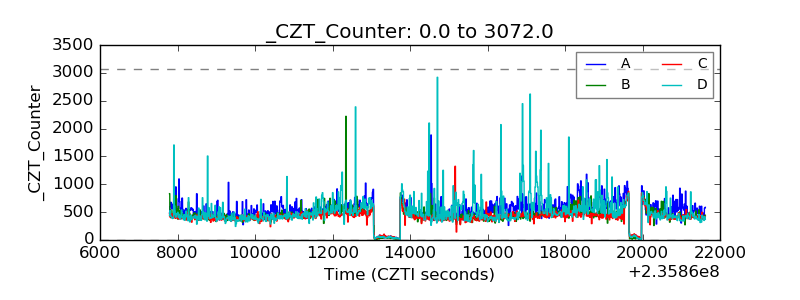 |
| +2.5 Volts monitor |  |
| +5 Volts monitor |  |
| _ROLL_ROT | 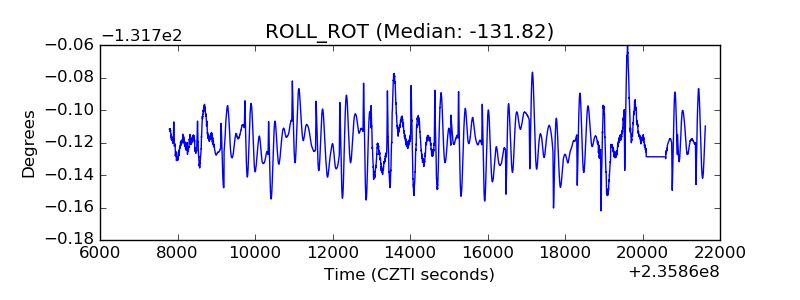 |
| _Roll_DEC | 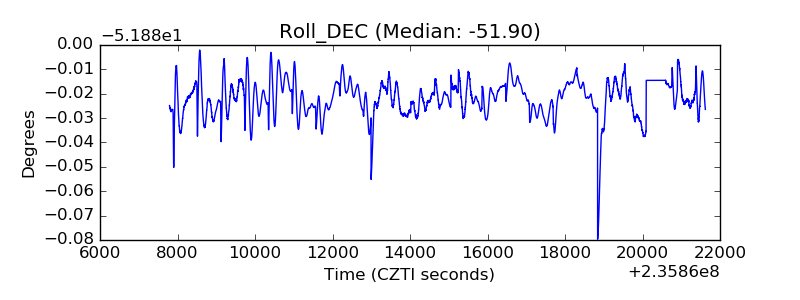 |
| _Roll_RA | 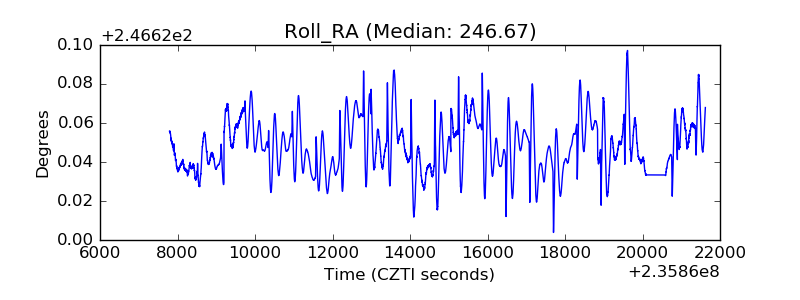 |
| Veto Counter | 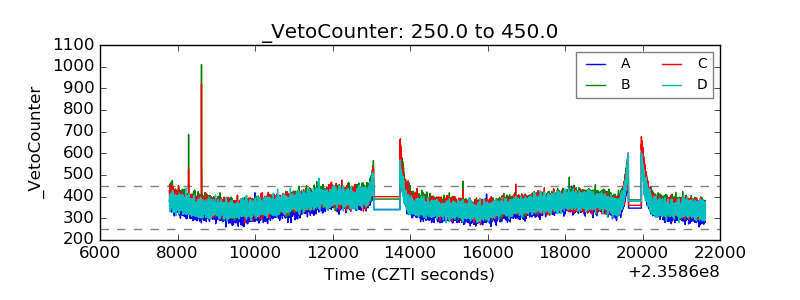 |