| Param | Original file | Final file |
|---|---|---|
| Filename | modeM0/AS1A03_057T01_9000001330_09384cztM0_level2.evt | modeM0/AS1A03_057T01_9000001330_09384cztM0_level2_quad_clean.evt |
| Size (bytes) | 131,558,400 | 29,854,080 |
| Size | 125.5 MB | 28.5 MB |
| Events in quadrant A | 1,084,504 | 179,207 |
| Events in quadrant B | 944,081 | 201,291 |
| Events in quadrant C | 886,786 | 199,648 |
| Events in quadrant D | 935,297 | 183,559 |
| Mode M9 | |||
|---|---|---|---|
| Quadrant | BADHDUFLAG | Total packets | Discarded packets |
| A | 0 | 3 | 1 |
| B | 0 | 3 | 1 |
| C | 0 | 3 | 2 |
| D | 0 | 3 | 1 |
| Mode M0 | |||
|---|---|---|---|
| Quadrant | BADHDUFLAG | Total packets | Discarded packets |
| A | 0 | 11631 | 7220 |
| B | 0 | 9801 | 5713 |
| C | 0 | 9578 | 5493 |
| D | 0 | 10250 | 6119 |
| Mode SS | |||
|---|---|---|---|
| Quadrant | BADHDUFLAG | Total packets | Discarded packets |
| A | 0 | 96 | 60 |
| B | 0 | 96 | 56 |
| C | 0 | 96 | 66 |
| D | 0 | 95 | 56 |
| Quadrant | Total seconds | Saturated seconds | Saturation percentage |
|---|---|---|---|
| A | 1798 | 24 | 1.334816% |
| B | 1949 | 17 | 0.872242% |
| C | 2007 | 14 | 0.697559% |
| D | 1912 | 15 | 0.784519% |
Noise dominated data is calculated using 1-second bins in cleaned event files. If a bin has >2000 counts, and if more than 50% of those come from <1% of pixels, then it is considered to be noise-dominated and hence unusable.
| Quadrant | # 1 sec bins | Bins with >0 counts | Bins with >2000 counts | High rate bins dominated by noise | Noise dominated (total time) | Noise dominated (detector-on time) | Marked lightcurve |
|---|---|---|---|---|---|---|---|
| A | 5054 | 2538 | 1 | 1 | 0.02% | 0.04% |  |
| B | 5056 | 2719 | 0 | 0 | 0.00% | 0.00% |  |
| C | 5057 | 2760 | 0 | 0 | 0.00% | 0.00% | 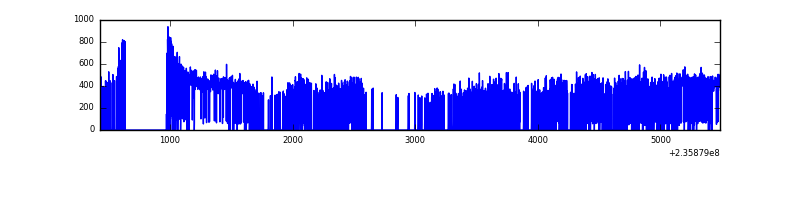 |
| D | 5056 | 2672 | 1 | 1 | 0.02% | 0.04% |  |
Top three noisy pixels from each quadrant. If the there are fewer than three noisy pixels in the level2.evt file, extra rows are filled as -1
| Pixel properties | Quadrant properties | ||||||
|---|---|---|---|---|---|---|---|
| Quadrant | DetID | PixID | Counts | Sigma | Mean | Median | Sigma |
| A | 8 | 5 | 127143 | 2843.69 | 207 | 203 | 44.6 |
| A | 1 | 162 | 69176 | 1545.12 | 207 | 203 | 44.6 |
| A | 1 | 178 | 28336 | 630.23 | 207 | 203 | 44.6 |
| B | 0 | 214 | 18370 | 399.0 | 226 | 221 | 45.5 |
| B | 0 | 187 | 17762 | 385.63 | 226 | 221 | 45.5 |
| B | 0 | 219 | 12254 | 264.54 | 226 | 221 | 45.5 |
| C | 8 | 128 | 4247 | 74.37 | 225 | 225 | 54.1 |
| C | 8 | 112 | 2193 | 36.38 | 225 | 225 | 54.1 |
| C | 13 | 61 | 1672 | 26.75 | 225 | 225 | 54.1 |
| D | 8 | 195 | 27741 | 468.14 | 212 | 206 | 58.8 |
| D | 12 | 233 | 27705 | 467.53 | 212 | 206 | 58.8 |
| D | 1 | 52 | 23962 | 403.89 | 212 | 206 | 58.8 |
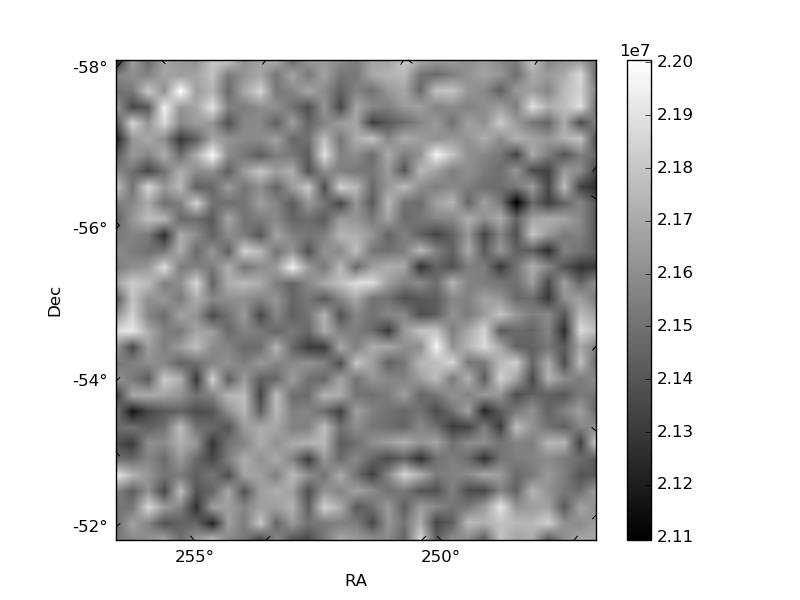
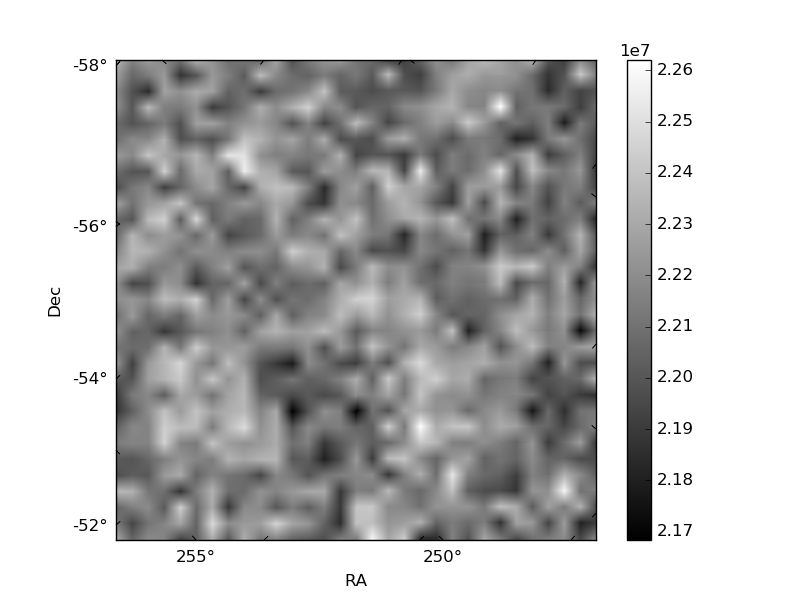
Histogram calculated using DETX and DETY for each event in the final _common_clean file
| Quadrant A | 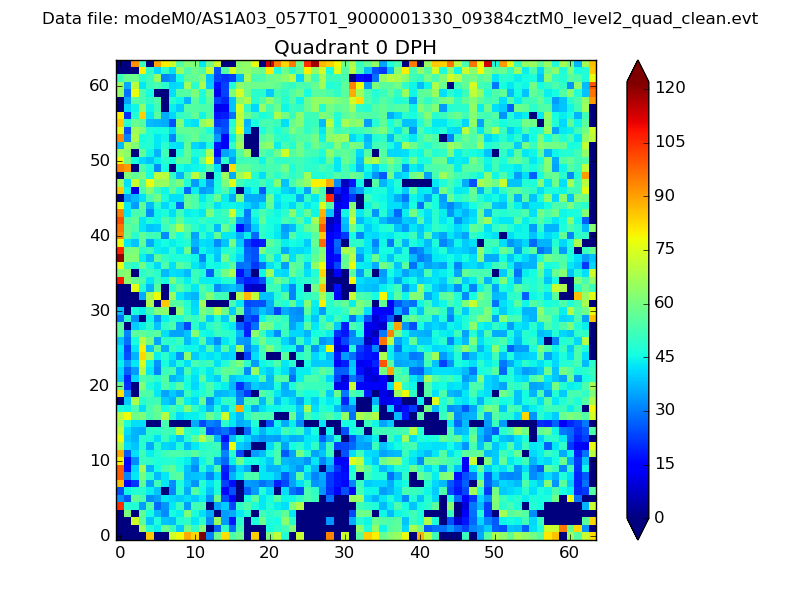 |
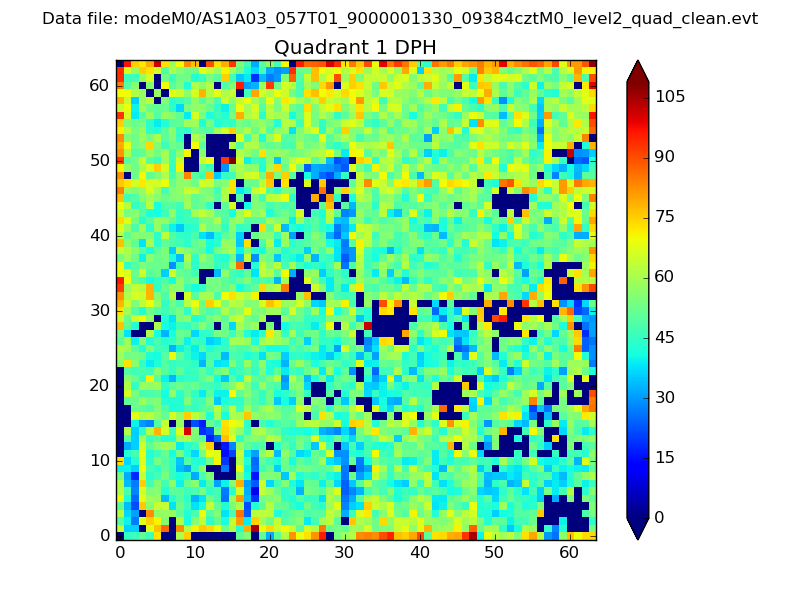 |
Quadrant B |
|---|---|---|---|
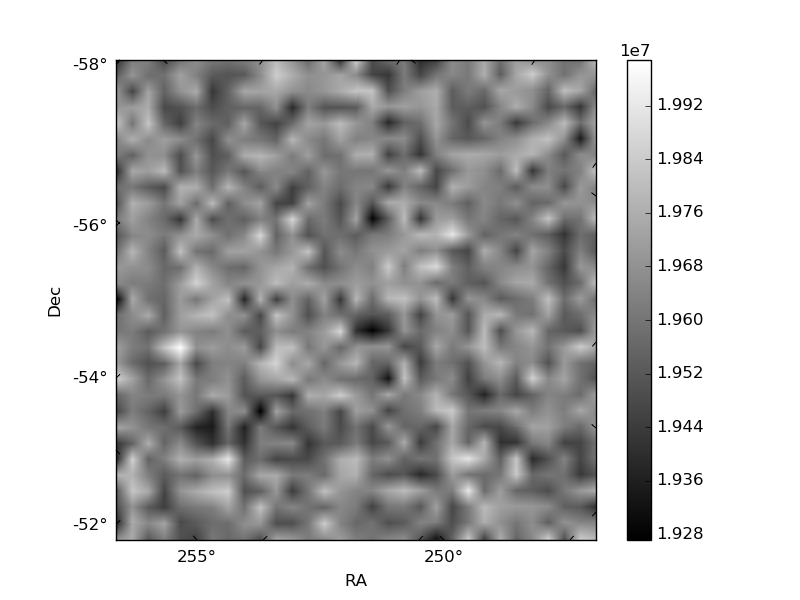
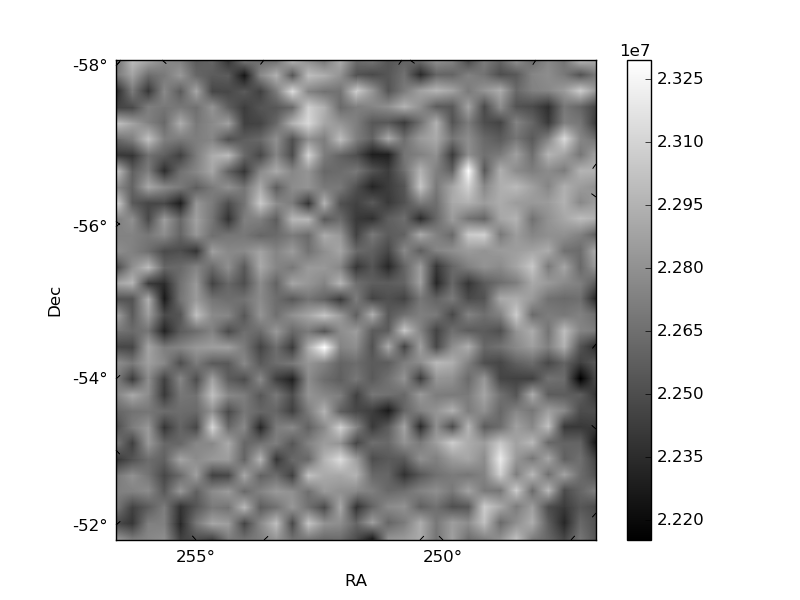
| Quadrant D | 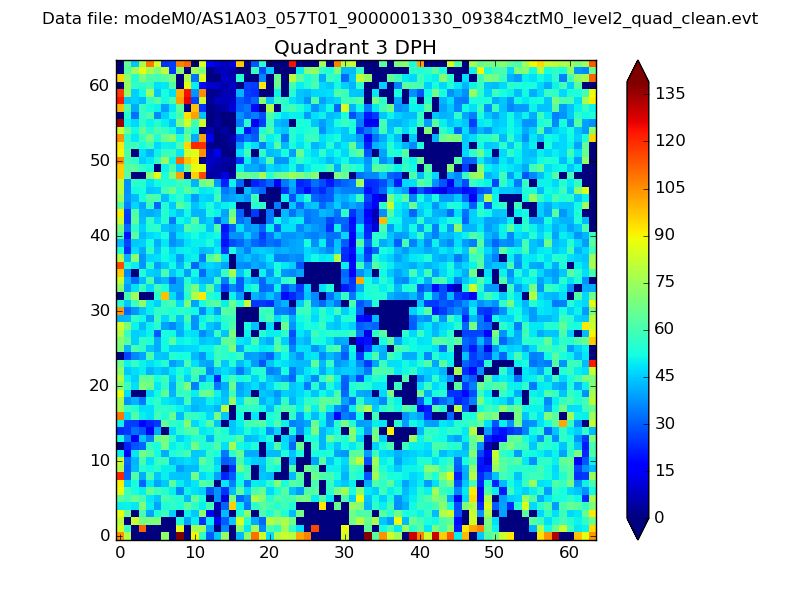 |
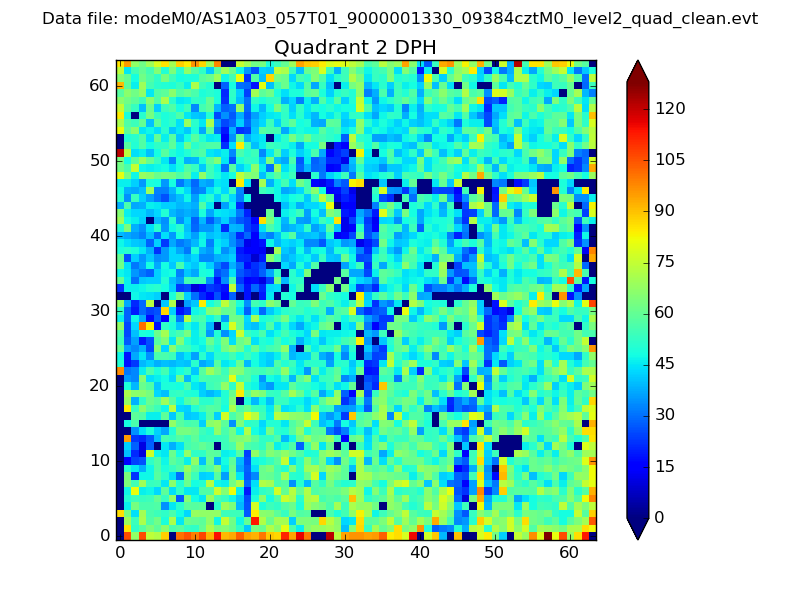 |
Quadrant C |
| Plot type | Count rate plots | Images |
|---|---|---|
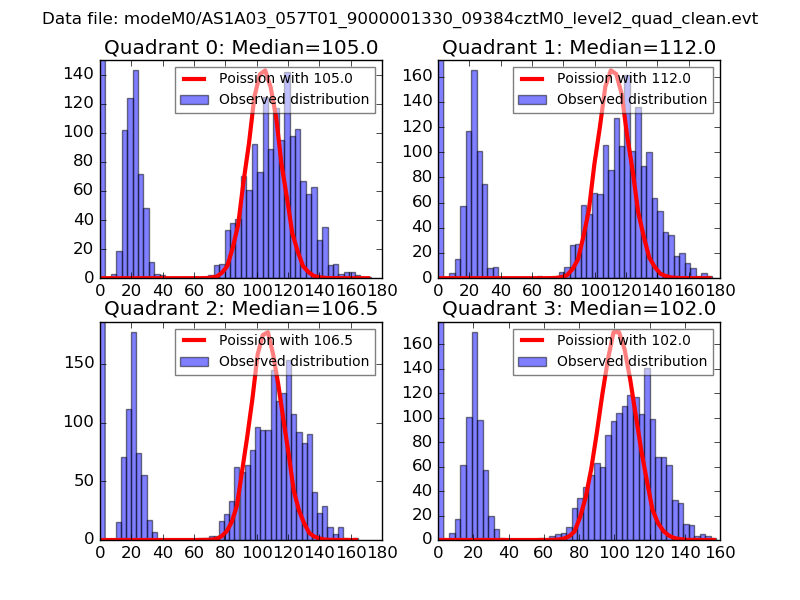
| Comparison with Poisson distribution Blue bars denote a histogram of data divided into 1 sec bins. Red curve is a Poisson curve with rate = median count rate of data. |
 |
 |
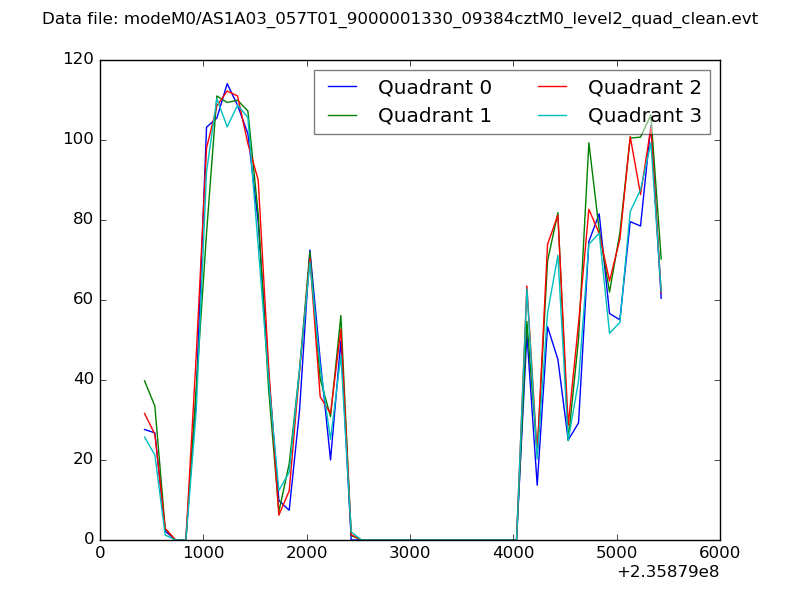
| Quadrant-wise count rates Data is divided into 100 sec bins |
 |
|
| Module-wise count rates for Quadrant A Data is divided into 100 sec bins |
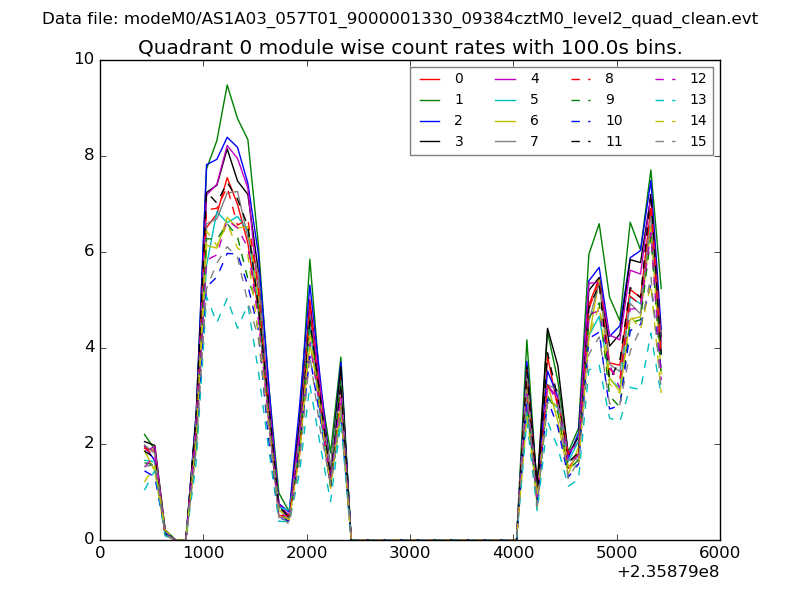 |
 |
| Module-wise count rates for Quadrant B Data is divided into 100 sec bins |
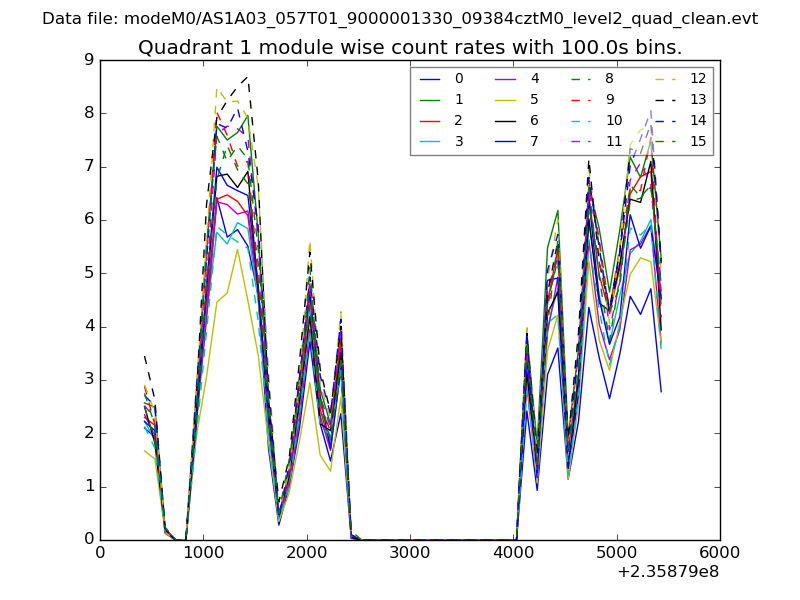 |
 |
| Module-wise count rates for Quadrant C Data is divided into 100 sec bins |
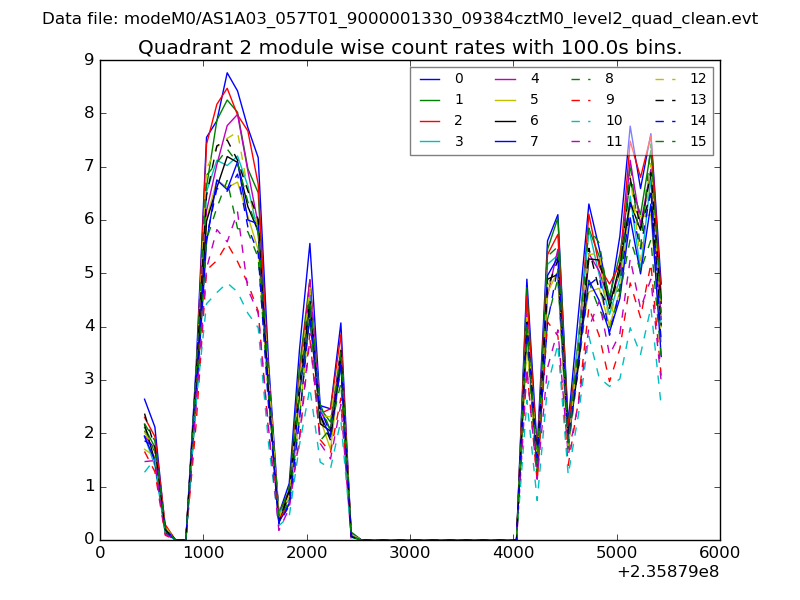 |
 |
| Module-wise count rates for Quadrant D Data is divided into 100 sec bins |
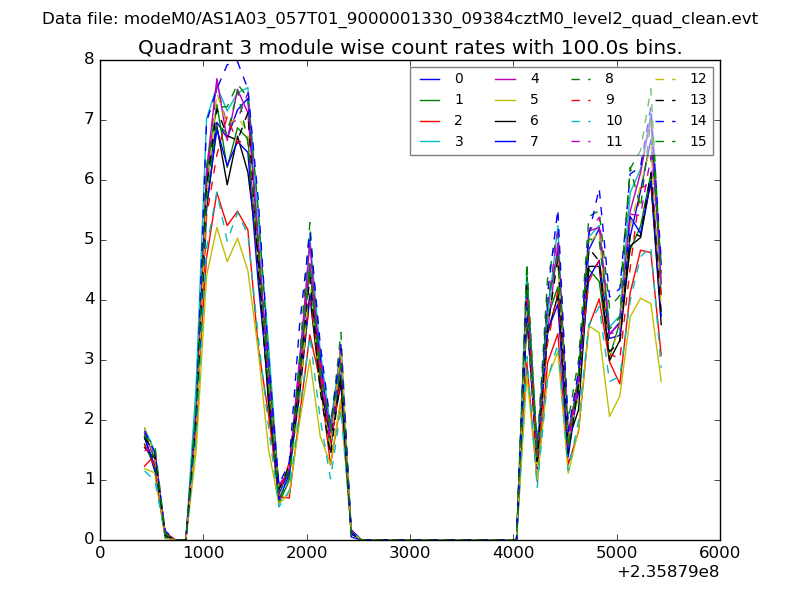 |
 |
| Parameter | Plot |
|---|---|
| CZT HV Monitor | 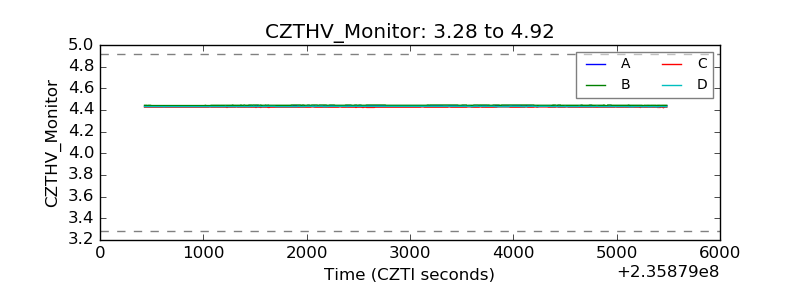 |
| D_VDD | 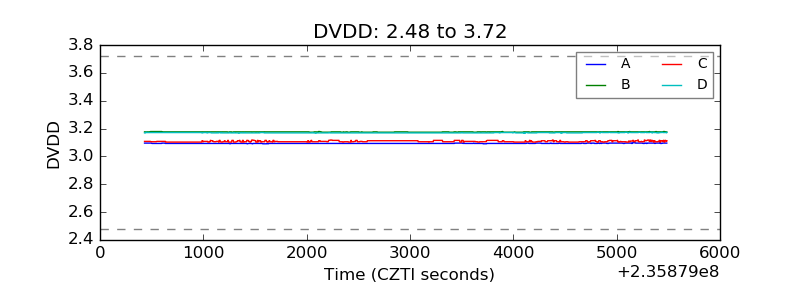 |
| Temperature 1 | 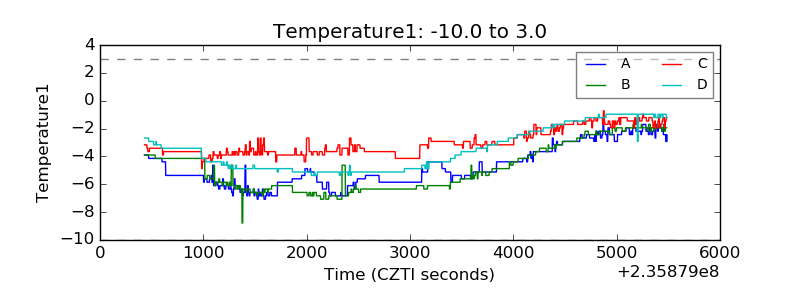 |
| Veto HV Monitor | 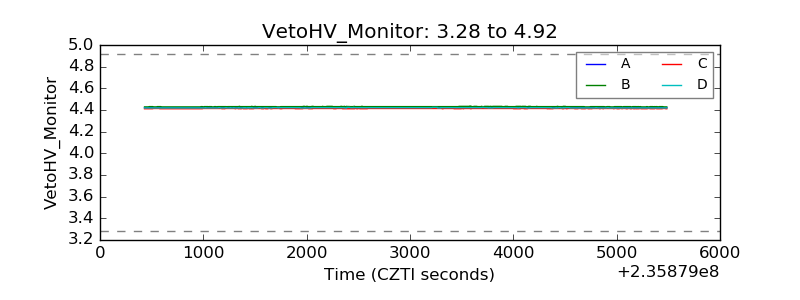 |
| Veto LLD |  |
| Alpha Counter | 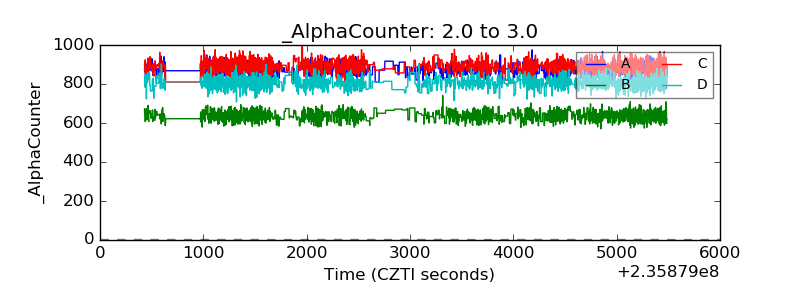 |
| _CPM_Rate | 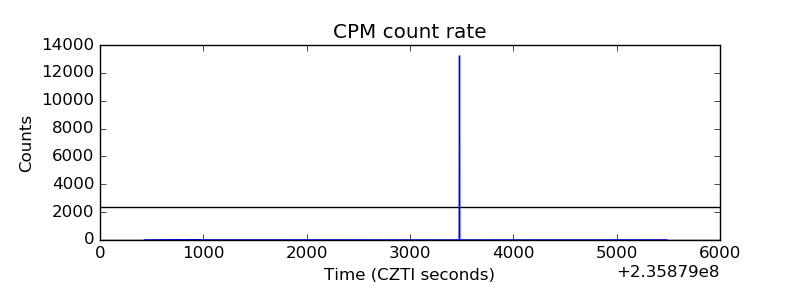 |
| CZT Counter | 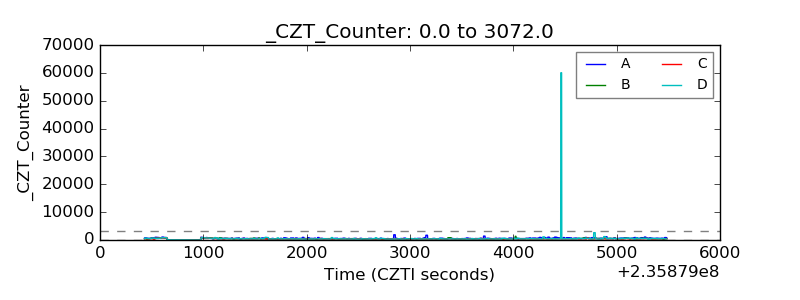 |
| +2.5 Volts monitor | 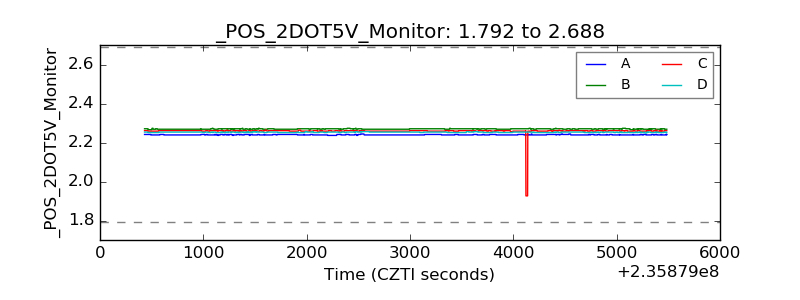 |
| +5 Volts monitor |  |
| _ROLL_ROT | 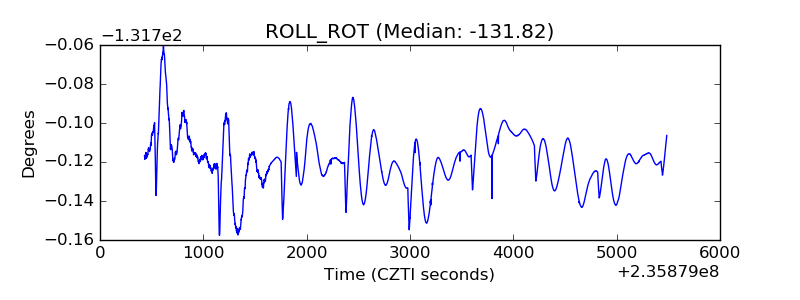 |
| _Roll_DEC | 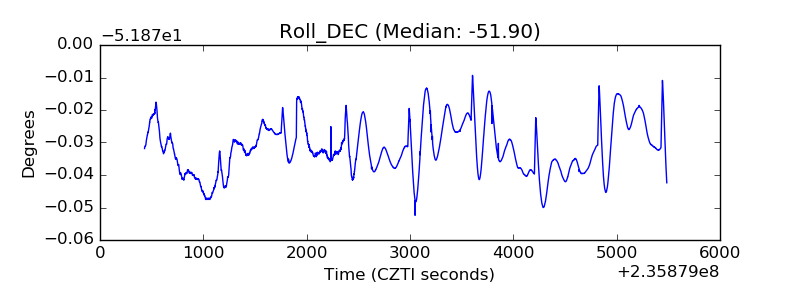 |
| _Roll_RA | 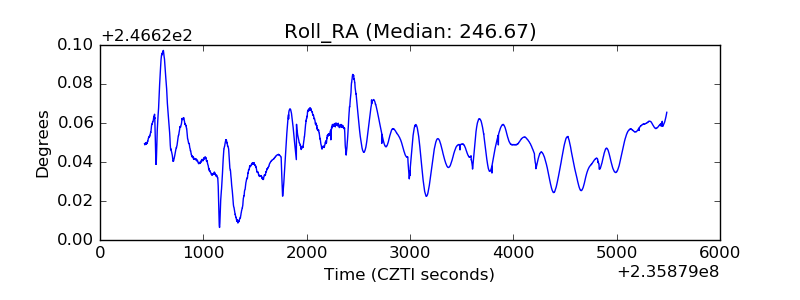 |
| Veto Counter | 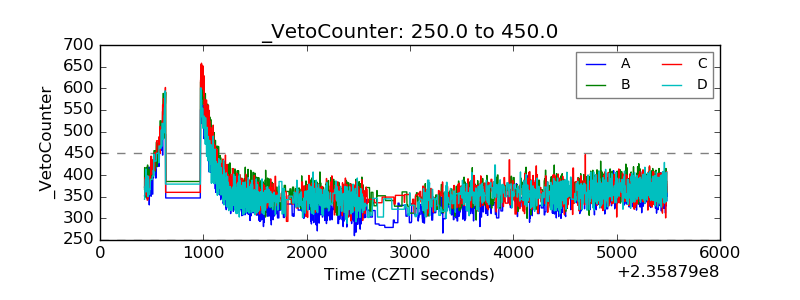 |