| Param | Original file | Final file |
|---|---|---|
| Filename | modeM0/AS1A03_057T01_9000001330_09388cztM0_level2.evt | modeM0/AS1A03_057T01_9000001330_09388cztM0_level2_quad_clean.evt |
| Size (bytes) | 218,655,360 | 32,276,160 |
| Size | 208.5 MB | 30.8 MB |
| Events in quadrant A | 1,979,960 | 185,523 |
| Events in quadrant B | 1,480,720 | 188,961 |
| Events in quadrant C | 1,392,934 | 187,866 |
| Events in quadrant D | 1,543,412 | 181,393 |
| Mode M0 | |||
|---|---|---|---|
| Quadrant | BADHDUFLAG | Total packets | Discarded packets |
| A | 0 | 8116 | 0 |
| B | 0 | 6719 | 0 |
| C | 0 | 6574 | 0 |
| D | 0 | 7006 | 0 |
| Mode SS | |||
|---|---|---|---|
| Quadrant | BADHDUFLAG | Total packets | Discarded packets |
| A | 0 | 64 | 0 |
| B | 0 | 64 | 0 |
| C | 0 | 64 | 0 |
| D | 0 | 64 | 0 |
| Quadrant | Total seconds | Saturated seconds | Saturation percentage |
|---|---|---|---|
| A | 3286 | 18 | 0.547778% |
| B | 3286 | 1 | 0.030432% |
| C | 3286 | 1 | 0.030432% |
| D | 3286 | 13 | 0.395618% |
Noise dominated data is calculated using 1-second bins in cleaned event files. If a bin has >2000 counts, and if more than 50% of those come from <1% of pixels, then it is considered to be noise-dominated and hence unusable.
| Quadrant | # 1 sec bins | Bins with >0 counts | Bins with >2000 counts | High rate bins dominated by noise | Noise dominated (total time) | Noise dominated (detector-on time) | Marked lightcurve |
|---|---|---|---|---|---|---|---|
| A | 3286 | 3286 | 10 | 10 | 0.30% | 0.30% | 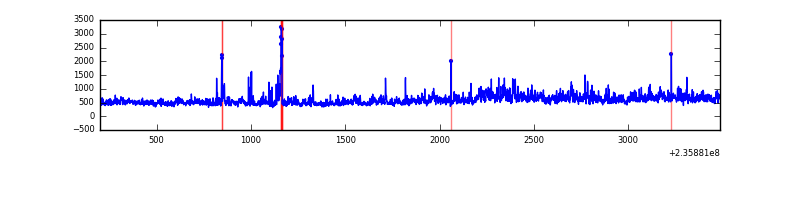 |
| B | 3286 | 3286 | 0 | 0 | 0.00% | 0.00% |  |
| C | 3286 | 3286 | 0 | 0 | 0.00% | 0.00% | 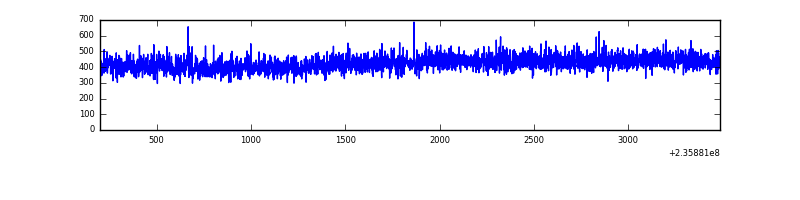 |
| D | 3286 | 3286 | 9 | 9 | 0.27% | 0.27% |  |
Top three noisy pixels from each quadrant. If the there are fewer than three noisy pixels in the level2.evt file, extra rows are filled as -1
| Pixel properties | Quadrant properties | ||||||
|---|---|---|---|---|---|---|---|
| Quadrant | DetID | PixID | Counts | Sigma | Mean | Median | Sigma |
| A | 8 | 5 | 316757 | 4207.87 | 359 | 352 | 75.2 |
| A | 1 | 162 | 109813 | 1455.72 | 359 | 352 | 75.2 |
| A | 1 | 178 | 45363 | 598.6 | 359 | 352 | 75.2 |
| B | 0 | 187 | 36935 | 516.41 | 361 | 352 | 70.8 |
| B | 0 | 214 | 18373 | 254.39 | 361 | 352 | 70.8 |
| B | 0 | 219 | 15409 | 212.55 | 361 | 352 | 70.8 |
| C | 8 | 128 | 6374 | 72.08 | 353 | 354 | 83.5 |
| C | 8 | 112 | 3458 | 37.16 | 353 | 354 | 83.5 |
| C | 13 | 61 | 2682 | 27.87 | 353 | 354 | 83.5 |
| D | 1 | 52 | 69944 | 778.19 | 351 | 340 | 89.4 |
| D | 8 | 195 | 42779 | 474.48 | 351 | 340 | 89.4 |
| D | 13 | 104 | 26270 | 289.9 | 351 | 340 | 89.4 |
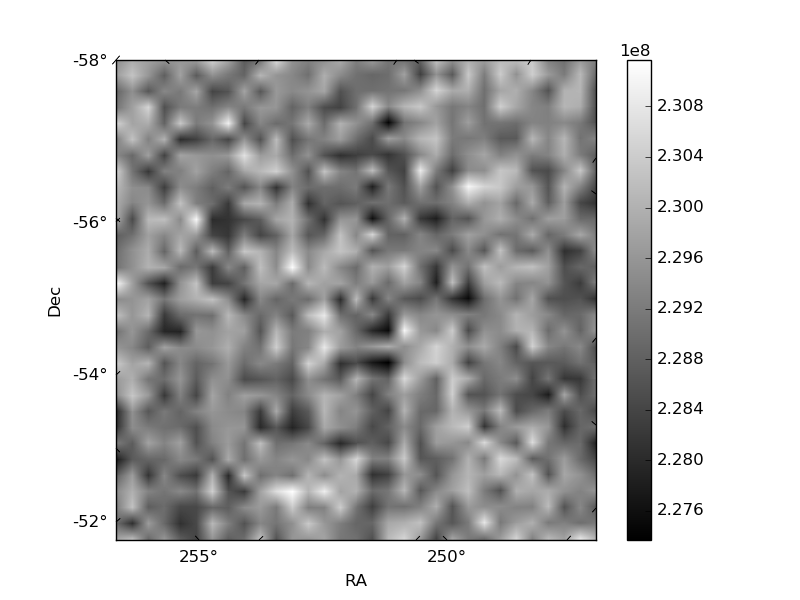
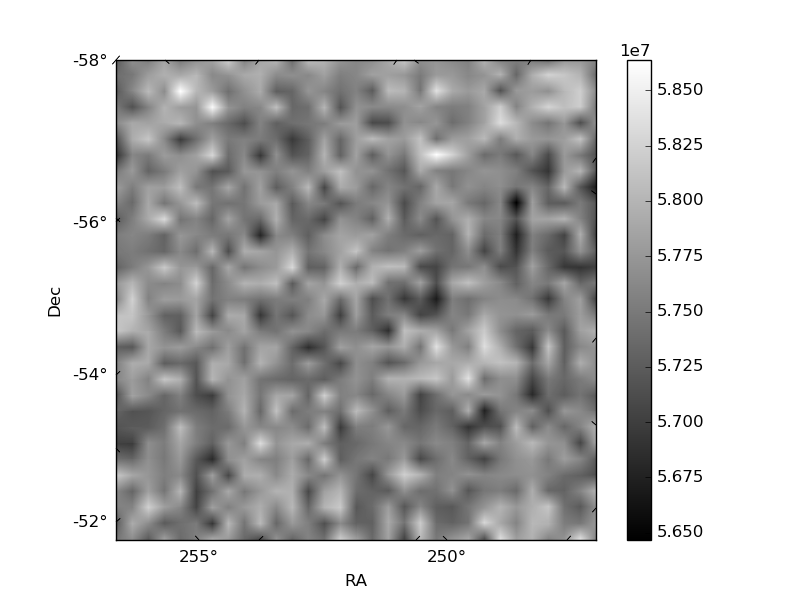
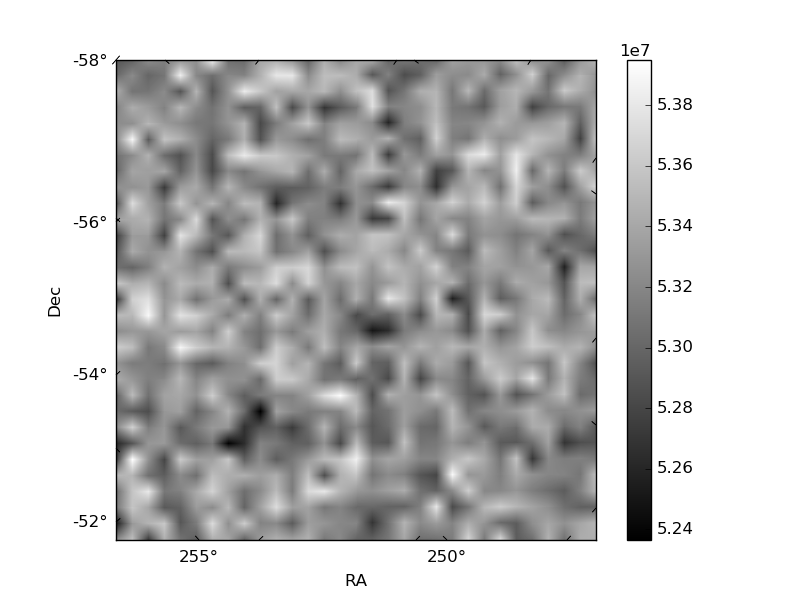
Histogram calculated using DETX and DETY for each event in the final _common_clean file
| Quadrant A | 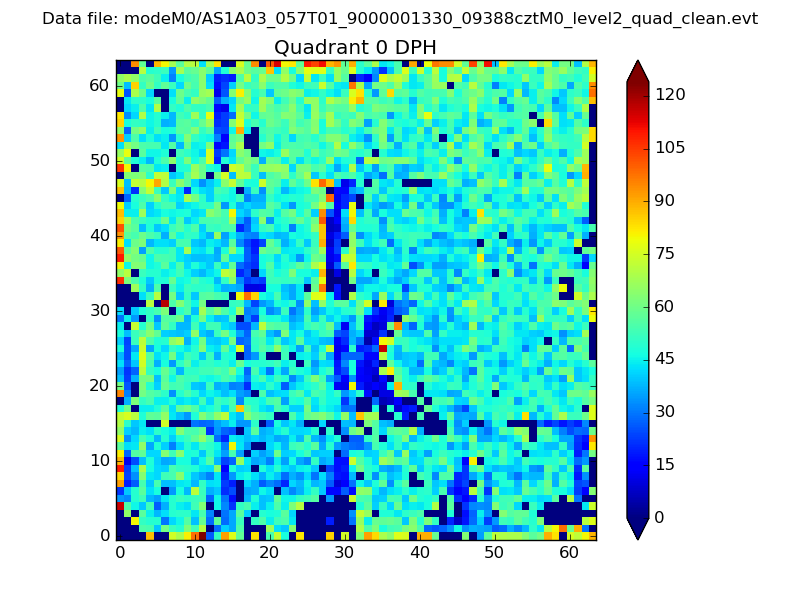 |
 |
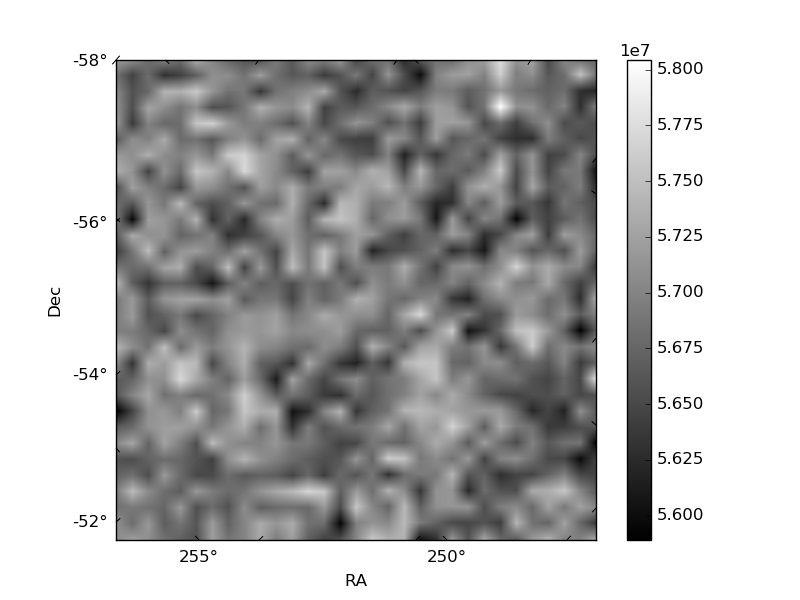
Quadrant B |
|---|---|---|---|
| Quadrant D |  |
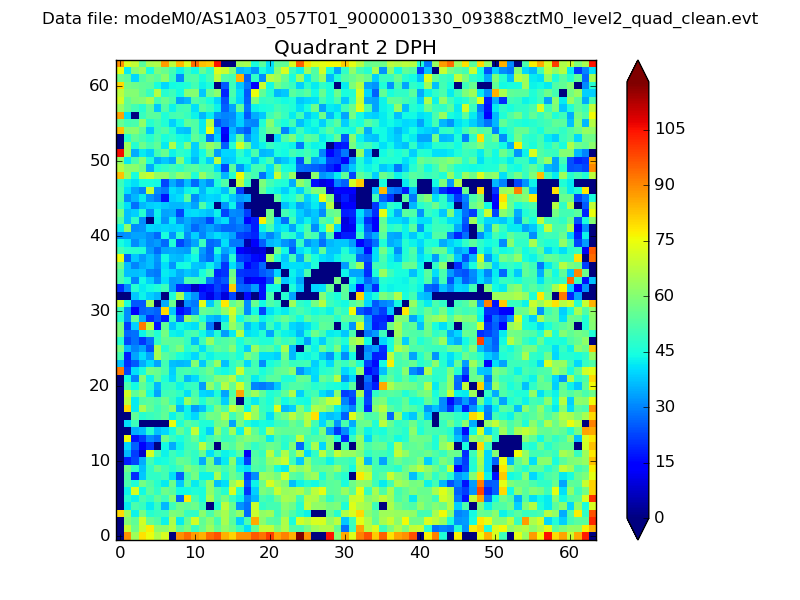 |
Quadrant C |
| Plot type | Count rate plots | Images |
|---|---|---|
| Comparison with Poisson distribution Blue bars denote a histogram of data divided into 1 sec bins. Red curve is a Poisson curve with rate = median count rate of data. |
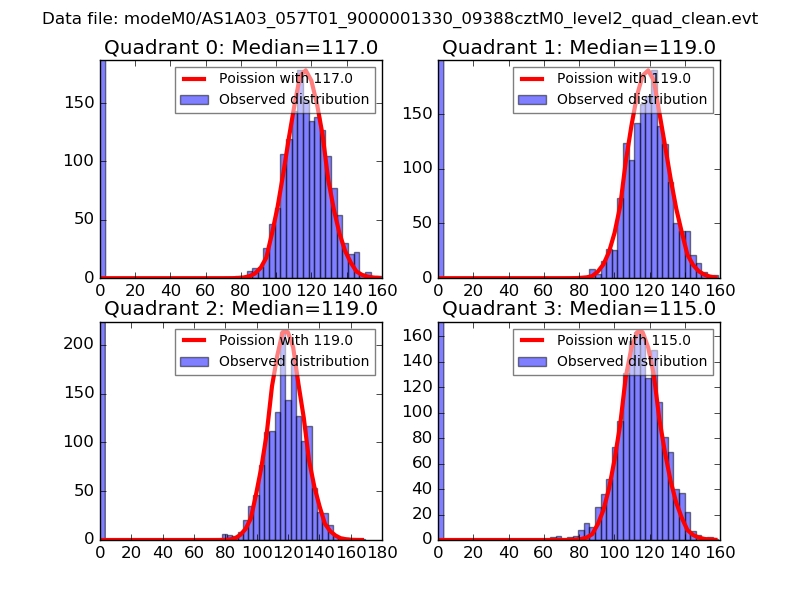 |
 |
| Quadrant-wise count rates Data is divided into 100 sec bins |
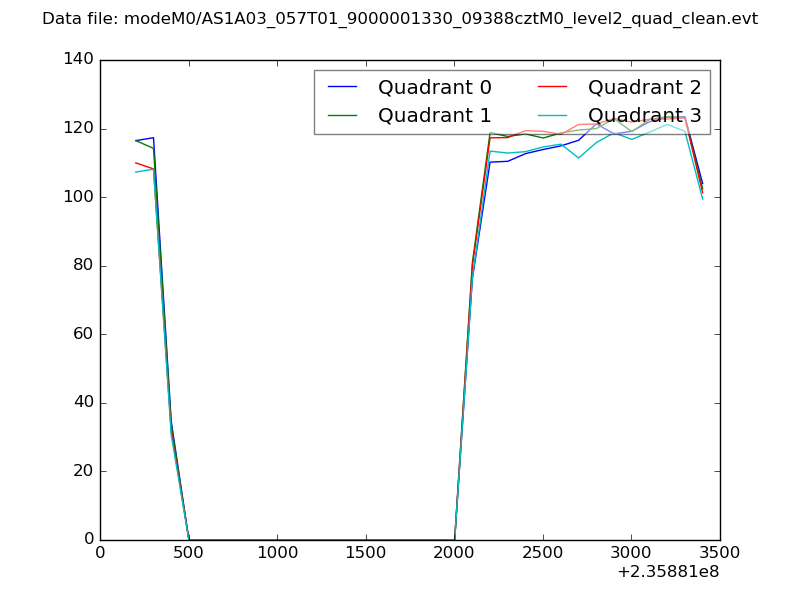 |
|
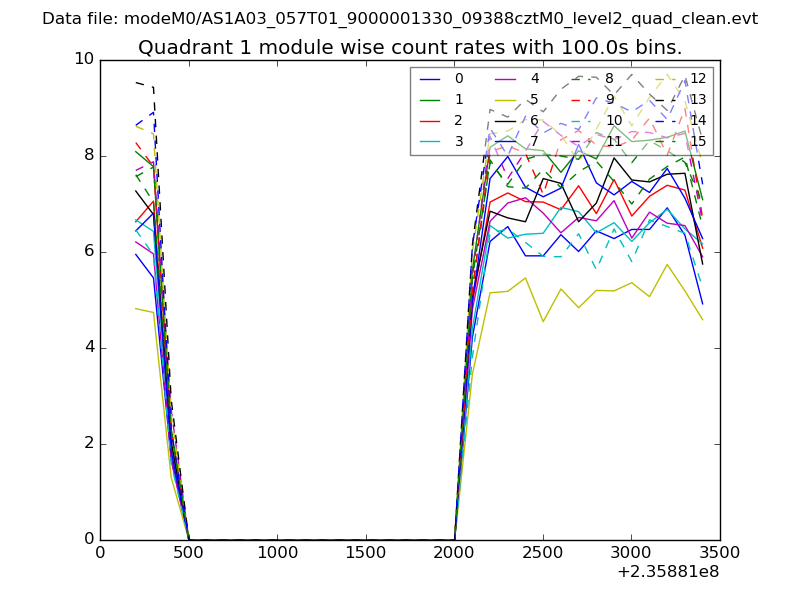
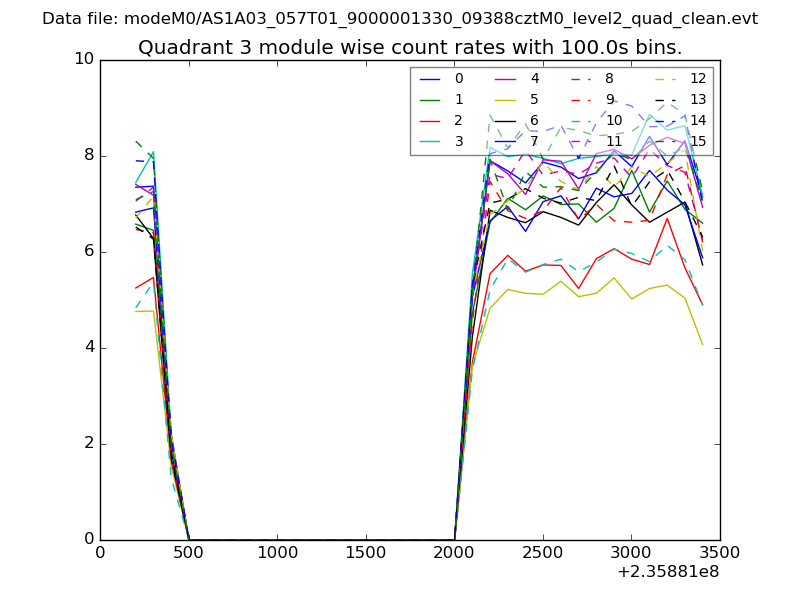
| Module-wise count rates for Quadrant A Data is divided into 100 sec bins |
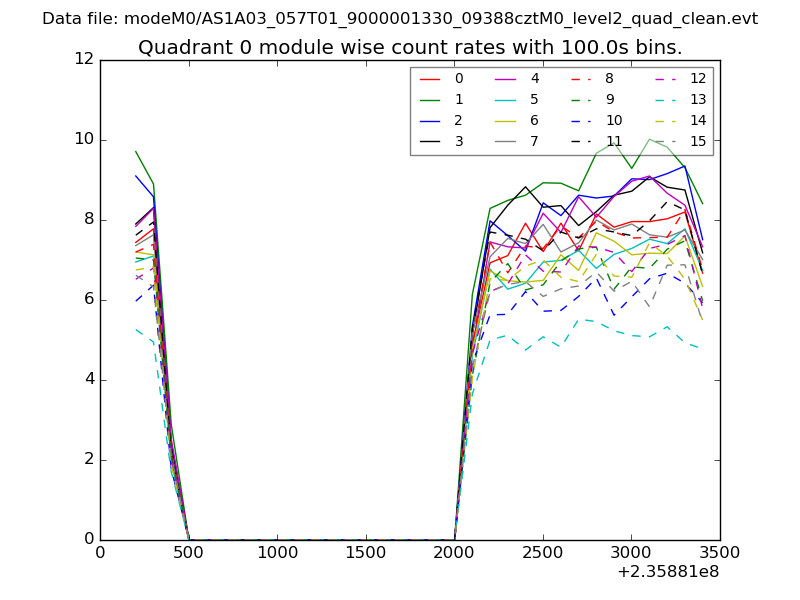 |
 |
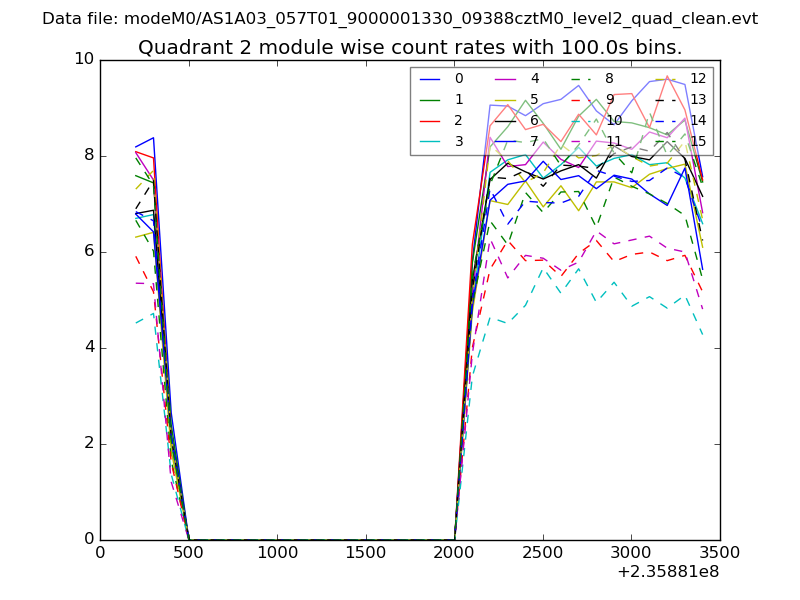
| Module-wise count rates for Quadrant B Data is divided into 100 sec bins |
 |
 |
| Module-wise count rates for Quadrant C Data is divided into 100 sec bins |
 |
 |
| Module-wise count rates for Quadrant D Data is divided into 100 sec bins |
 |
 |
| Parameter | Plot |
|---|---|
| CZT HV Monitor | 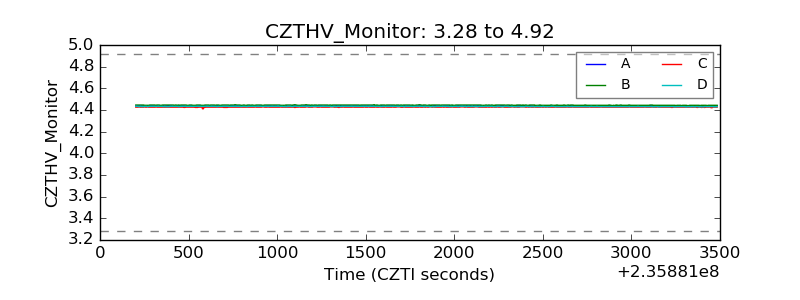 |
| D_VDD | 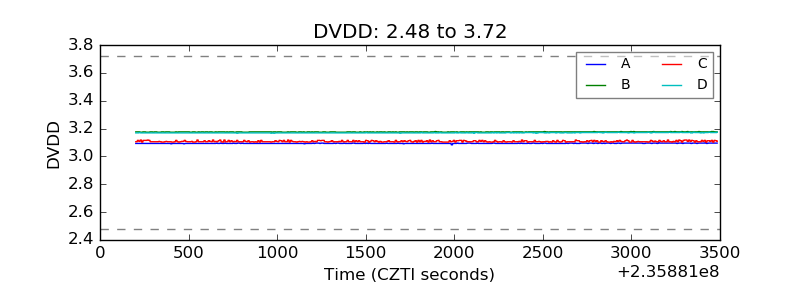 |
| Temperature 1 |  |
| Veto HV Monitor | 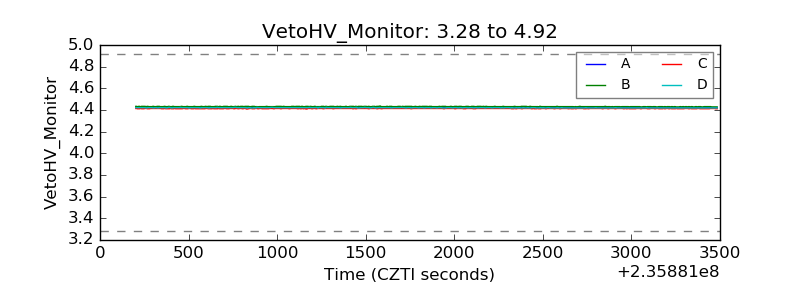 |
| Veto LLD | 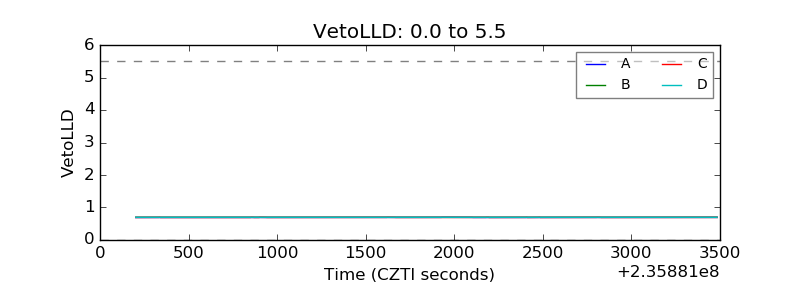 |
| Alpha Counter | 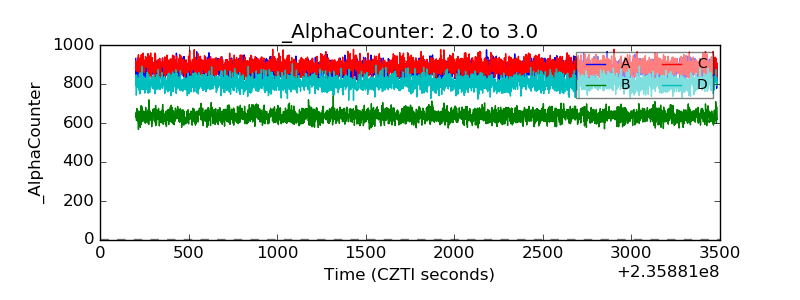 |
| _CPM_Rate | 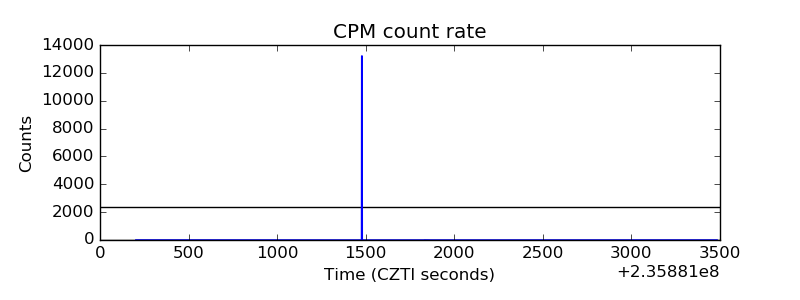 |
| CZT Counter | 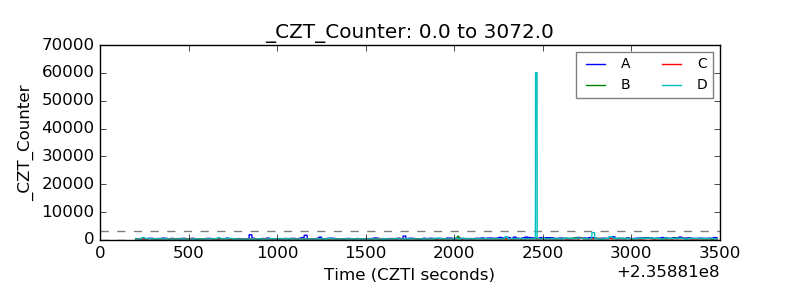 |
| +2.5 Volts monitor |  |
| +5 Volts monitor |  |
| _ROLL_ROT | 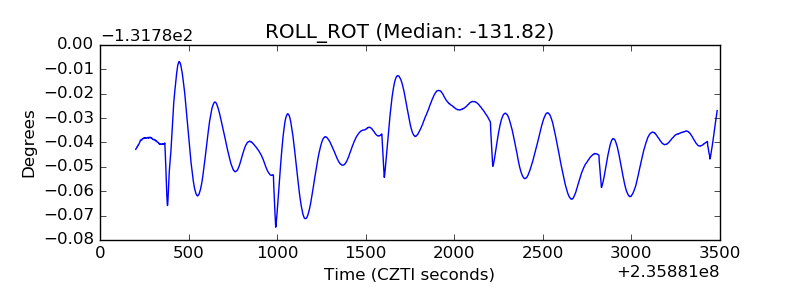 |
| _Roll_DEC | 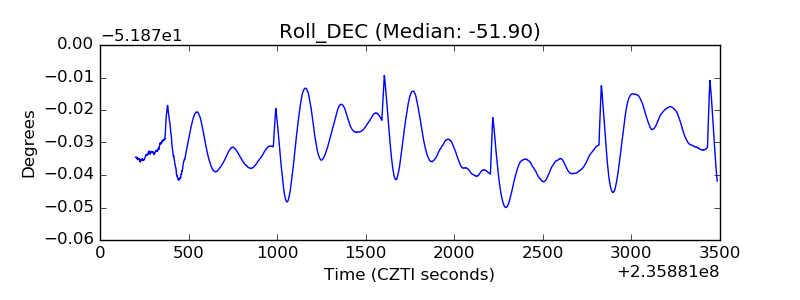 |
| _Roll_RA | 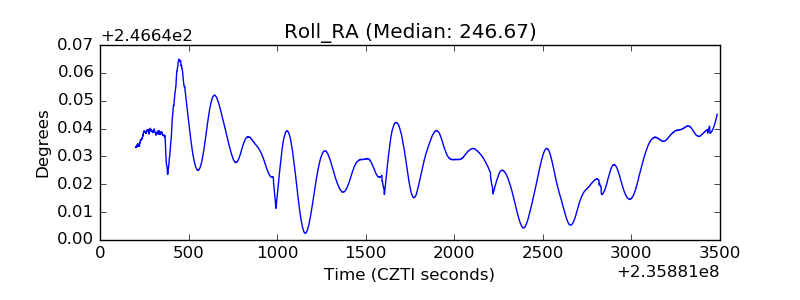 |
| Veto Counter | 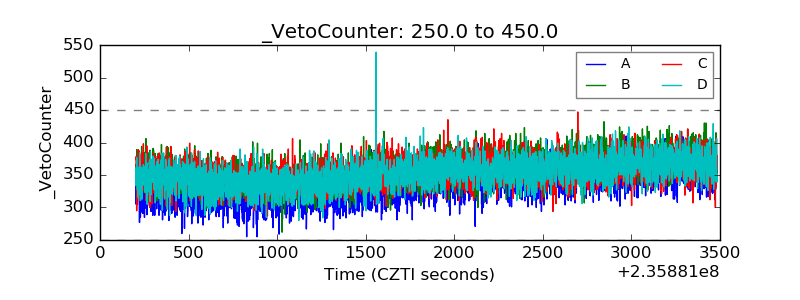 |