| Param | Original file | Final file |
|---|---|---|
| Filename | modeM0/AS1G07_069T01_9000001332_09384cztM0_level2.evt | modeM0/AS1G07_069T01_9000001332_09384cztM0_level2_quad_clean.evt |
| Size (bytes) | 109,722,240 | 21,136,320 |
| Size | 104.6 MB | 20.2 MB |
| Events in quadrant A | 873,490 | 125,235 |
| Events in quadrant B | 803,881 | 128,796 |
| Events in quadrant C | 752,902 | 134,155 |
| Events in quadrant D | 776,424 | 128,936 |
| Mode M0 | |||
|---|---|---|---|
| Quadrant | BADHDUFLAG | Total packets | Discarded packets |
| A | 0 | 4133 | 436 |
| B | 0 | 3894 | 328 |
| C | 0 | 3826 | 308 |
| D | 0 | 3925 | 354 |
| Mode SS | |||
|---|---|---|---|
| Quadrant | BADHDUFLAG | Total packets | Discarded packets |
| A | 0 | 38 | 0 |
| B | 0 | 38 | 2 |
| C | 0 | 38 | 4 |
| D | 0 | 38 | 4 |
| Mode M9 | |||
|---|---|---|---|
| Quadrant | BADHDUFLAG | Total packets | Discarded packets |
| A | 0 | 2 | 0 |
| B | 0 | 2 | 0 |
| C | 0 | 2 | 1 |
| D | 0 | 2 | 0 |
| Quadrant | Total seconds | Saturated seconds | Saturation percentage |
|---|---|---|---|
| A | 1647 | 82 | 4.978749% |
| B | 1668 | 93 | 5.575540% |
| C | 1673 | 44 | 2.630006% |
| D | 1661 | 39 | 2.347983% |
Noise dominated data is calculated using 1-second bins in cleaned event files. If a bin has >2000 counts, and if more than 50% of those come from <1% of pixels, then it is considered to be noise-dominated and hence unusable.
| Quadrant | # 1 sec bins | Bins with >0 counts | Bins with >2000 counts | High rate bins dominated by noise | Noise dominated (total time) | Noise dominated (detector-on time) | Marked lightcurve |
|---|---|---|---|---|---|---|---|
| A | 2055 | 1764 | 0 | 0 | 0.00% | 0.00% | 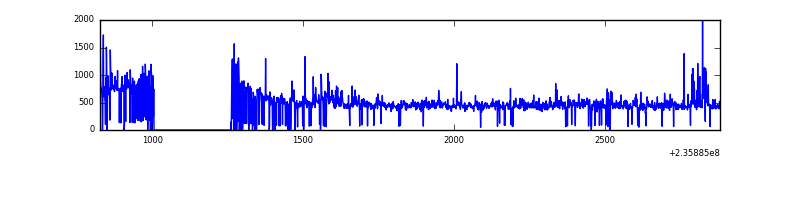 |
| B | 2056 | 1779 | 0 | 0 | 0.00% | 0.00% | 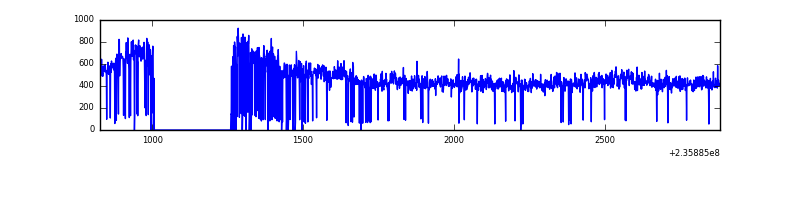 |
| C | 2056 | 1771 | 0 | 0 | 0.00% | 0.00% | 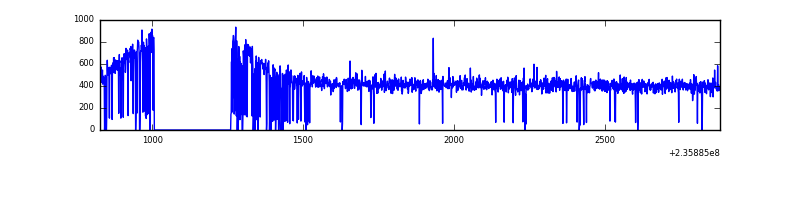 |
| D | 2056 | 1776 | 0 | 0 | 0.00% | 0.00% | 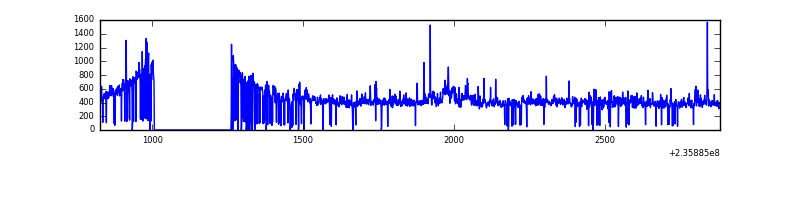 |
Top three noisy pixels from each quadrant. If the there are fewer than three noisy pixels in the level2.evt file, extra rows are filled as -1
| Pixel properties | Quadrant properties | ||||||
|---|---|---|---|---|---|---|---|
| Quadrant | DetID | PixID | Counts | Sigma | Mean | Median | Sigma |
| A | 8 | 5 | 118134 | 2914.45 | 188 | 183 | 40.5 |
| A | 1 | 162 | 14004 | 341.5 | 188 | 183 | 40.5 |
| A | 1 | 178 | 4724 | 112.2 | 188 | 183 | 40.5 |
| B | 0 | 219 | 35443 | 873.86 | 197 | 191 | 40.3 |
| B | 12 | 111 | 4521 | 107.33 | 197 | 191 | 40.3 |
| B | 11 | 111 | 3465 | 81.15 | 197 | 191 | 40.3 |
| C | 13 | 61 | 1453 | 26.92 | 192 | 192 | 46.8 |
| C | 8 | 222 | 1022 | 17.72 | 192 | 192 | 46.8 |
| C | 14 | 234 | 938 | 15.93 | 192 | 192 | 46.8 |
| D | 1 | 52 | 19038 | 380.02 | 185 | 180 | 49.6 |
| D | 13 | 137 | 17619 | 351.43 | 185 | 180 | 49.6 |
| D | 8 | 195 | 11658 | 231.3 | 185 | 180 | 49.6 |
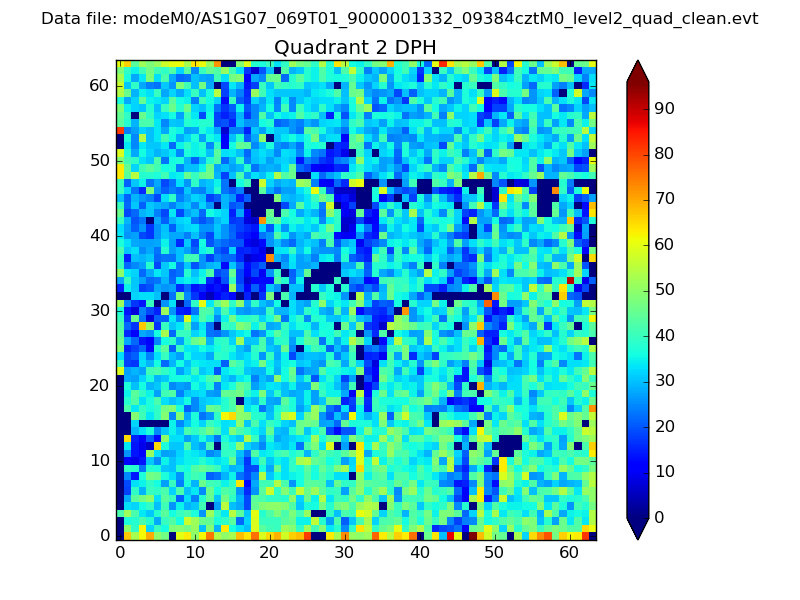
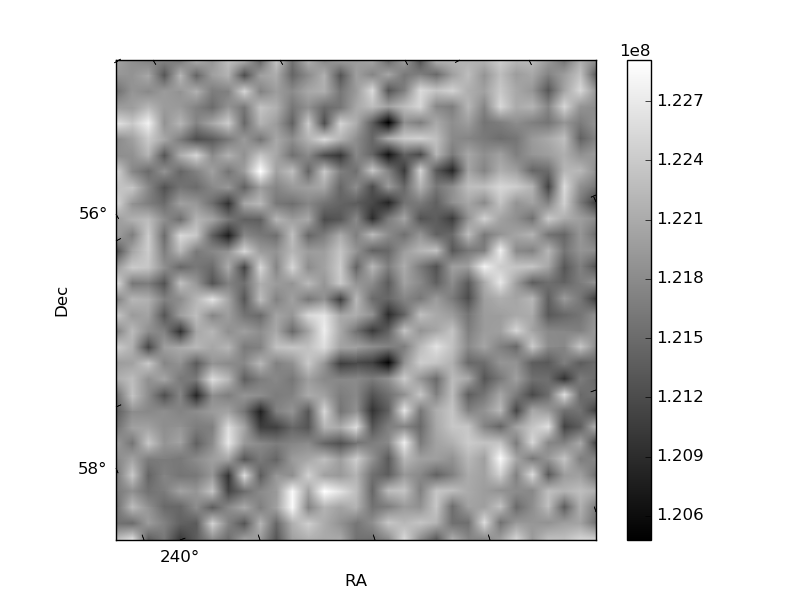
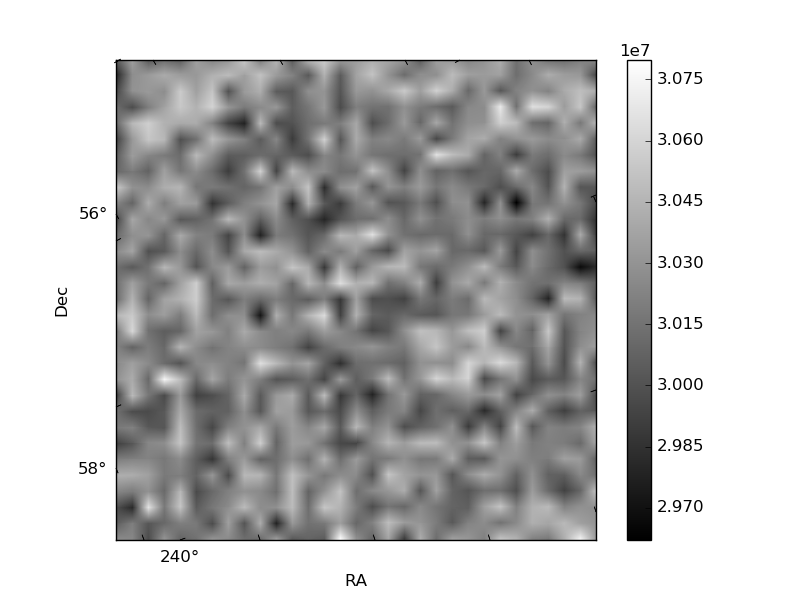
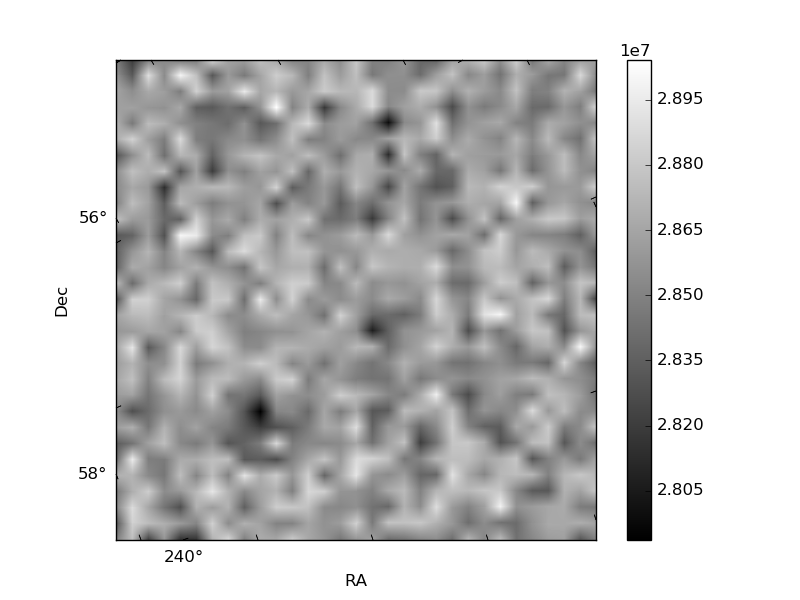
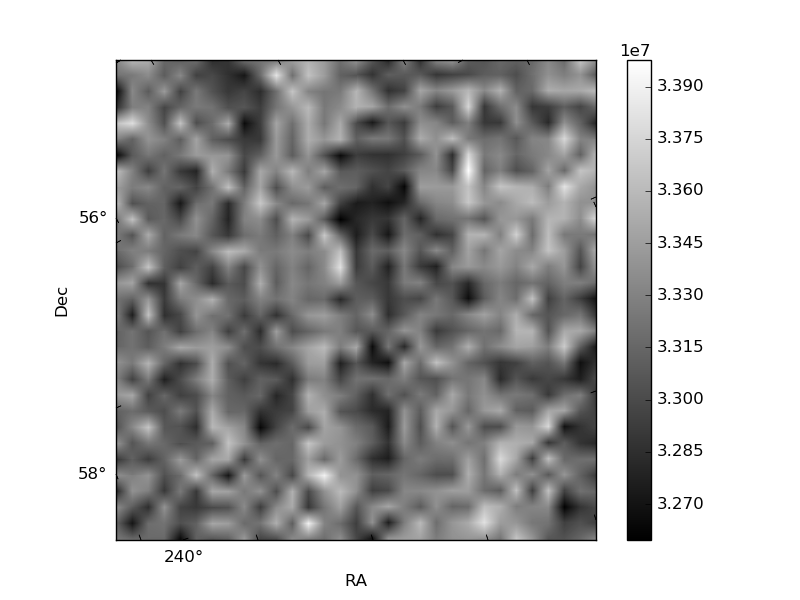
Histogram calculated using DETX and DETY for each event in the final _common_clean file
| Quadrant A | 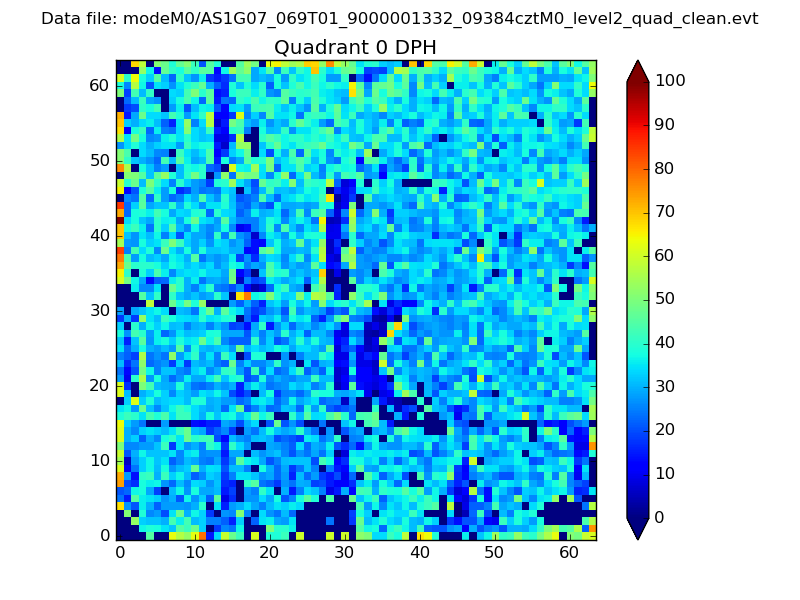 |
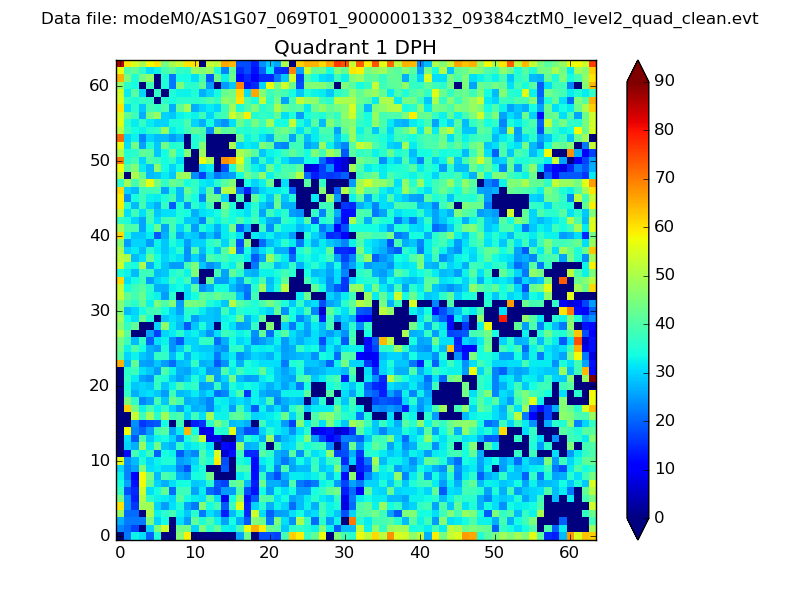 |
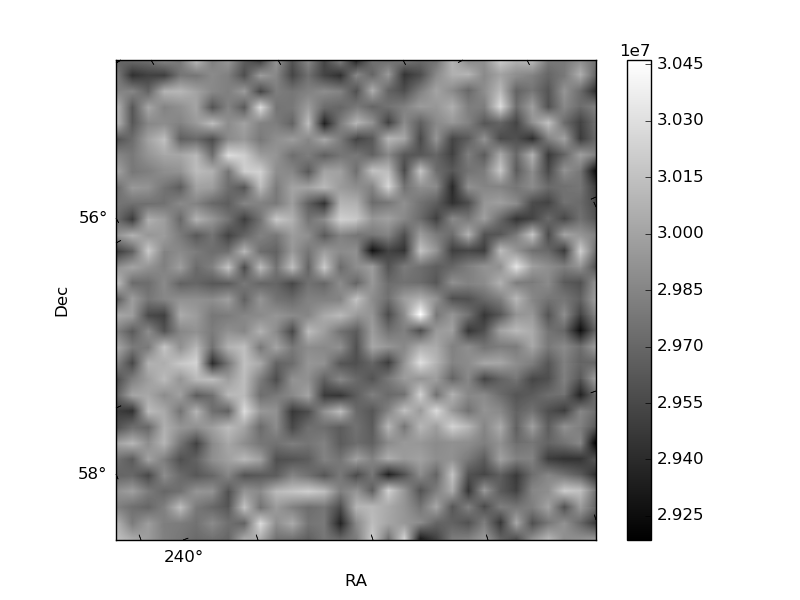
Quadrant B |
|---|---|---|---|
| Quadrant D | 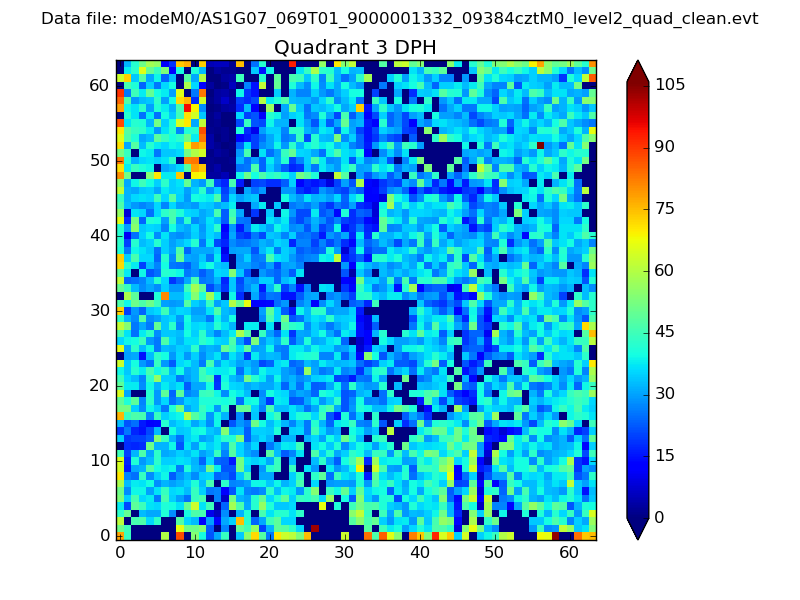 |
 |
Quadrant C |
| Plot type | Count rate plots | Images |
|---|---|---|
| Comparison with Poisson distribution Blue bars denote a histogram of data divided into 1 sec bins. Red curve is a Poisson curve with rate = median count rate of data. |
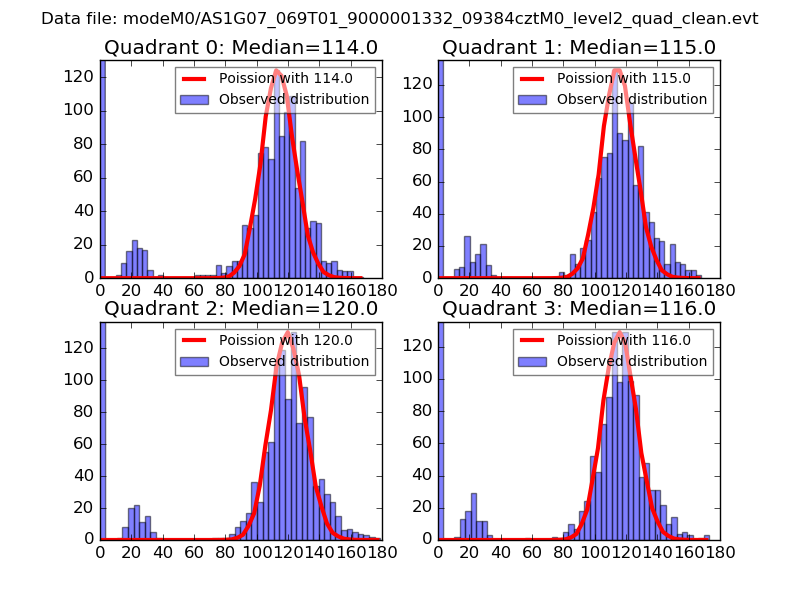 |
 |
| Quadrant-wise count rates Data is divided into 100 sec bins |
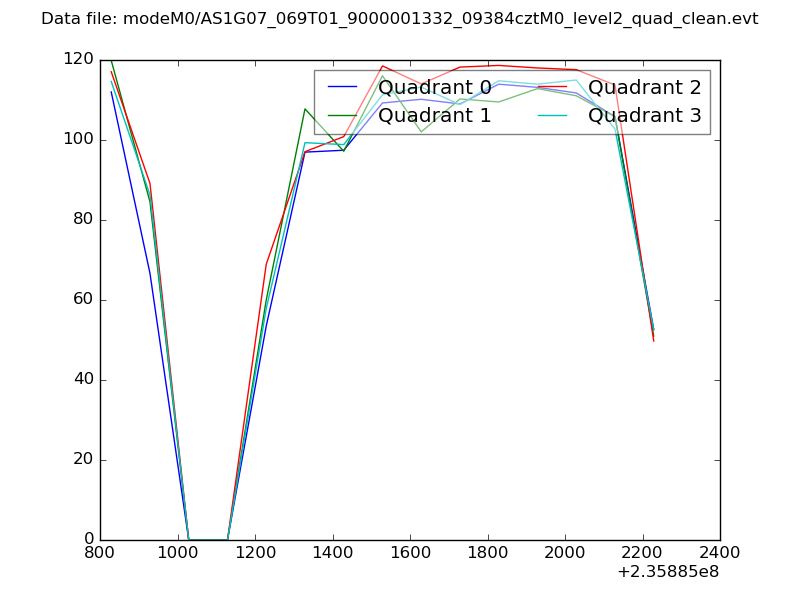 |
|
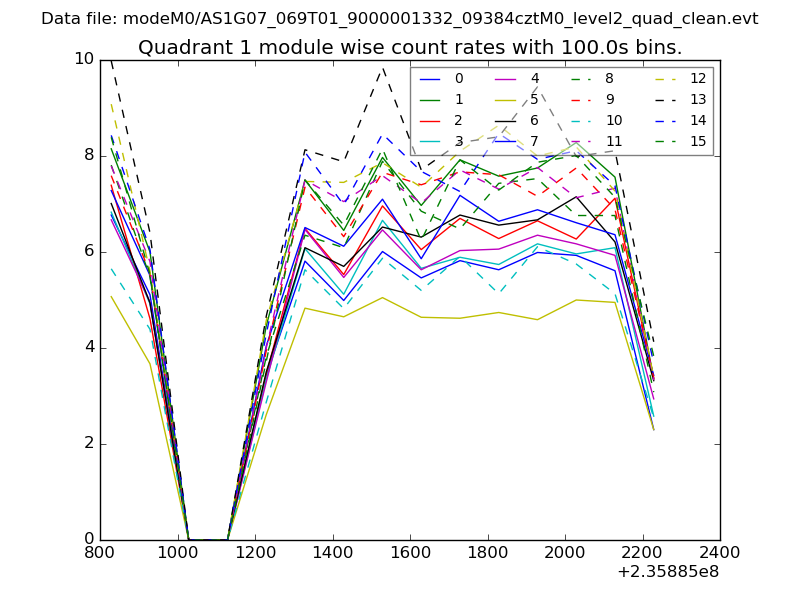
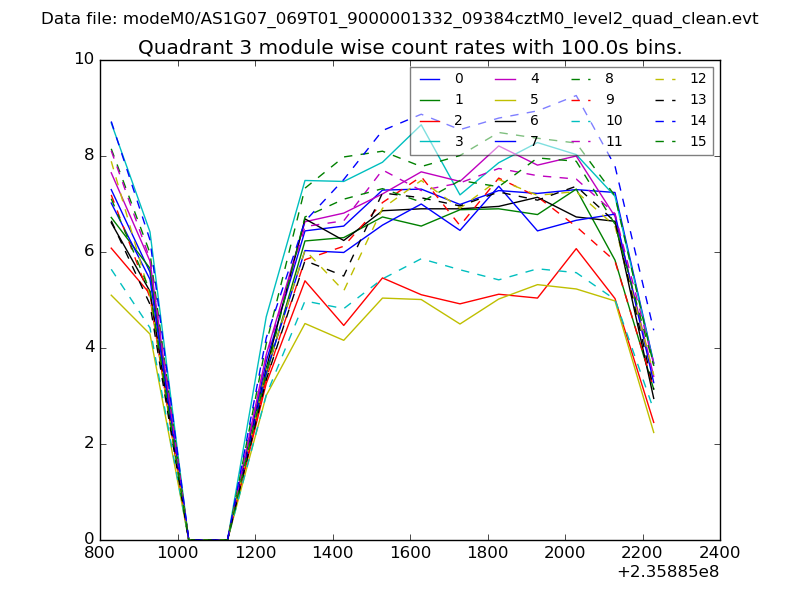
| Module-wise count rates for Quadrant A Data is divided into 100 sec bins |
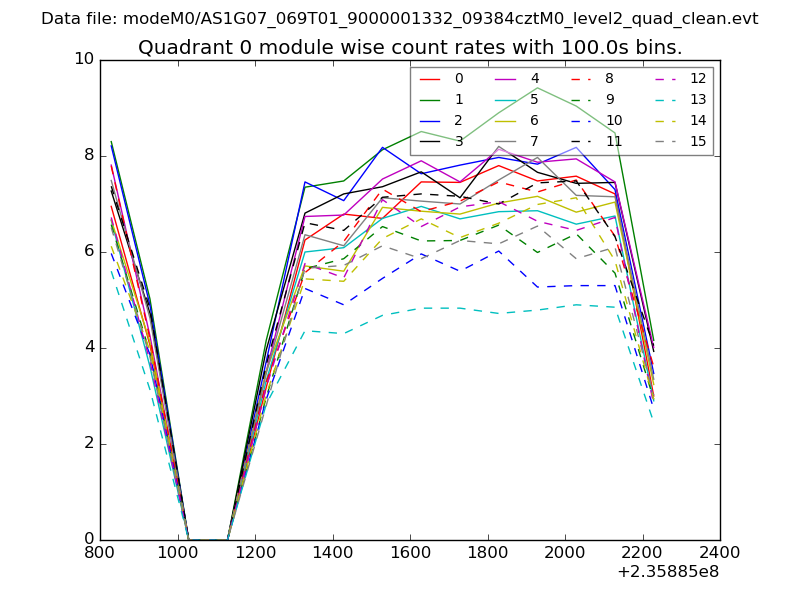 |
 |
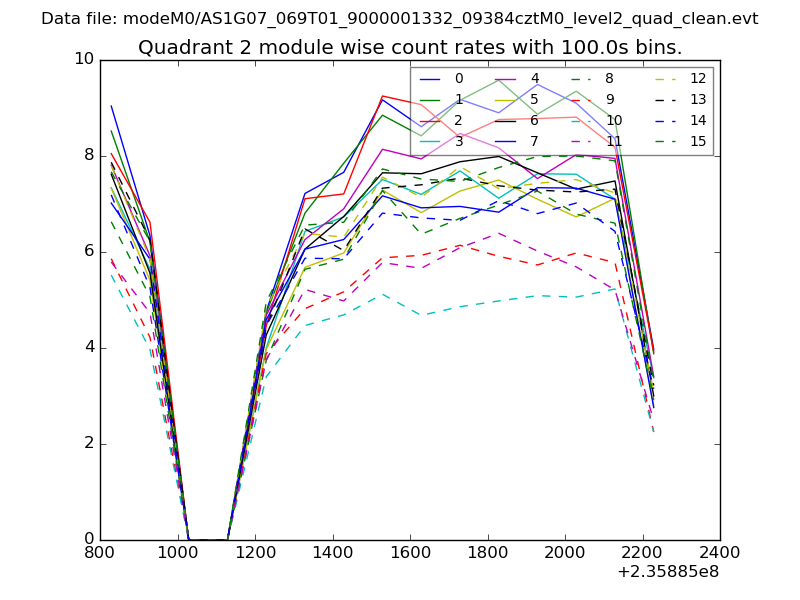
| Module-wise count rates for Quadrant B Data is divided into 100 sec bins |
 |
 |
| Module-wise count rates for Quadrant C Data is divided into 100 sec bins |
 |
 |
| Module-wise count rates for Quadrant D Data is divided into 100 sec bins |
 |
 |
| Parameter | Plot |
|---|---|
| CZT HV Monitor | 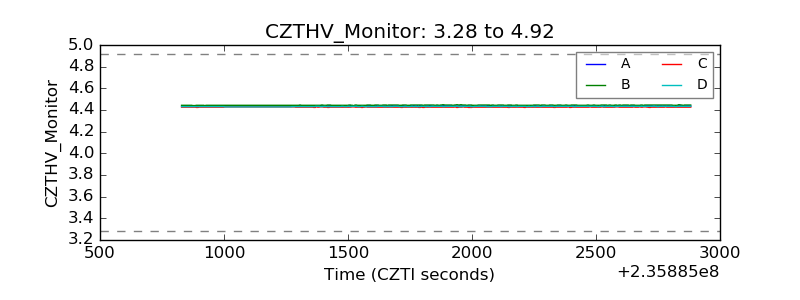 |
| D_VDD | 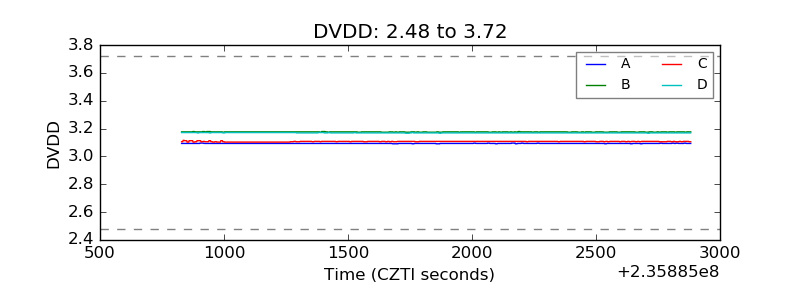 |
| Temperature 1 | 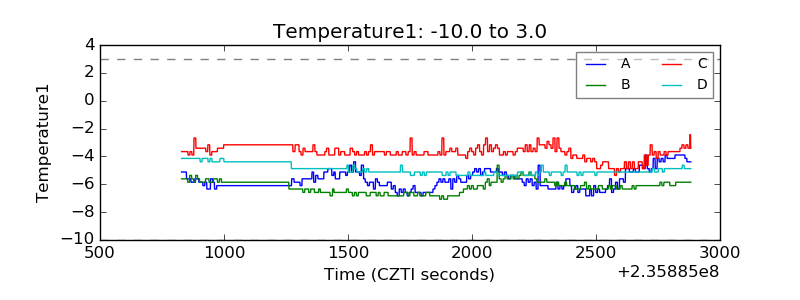 |
| Veto HV Monitor | 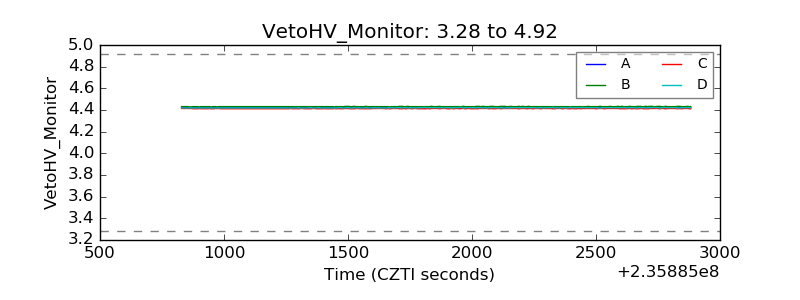 |
| Veto LLD | 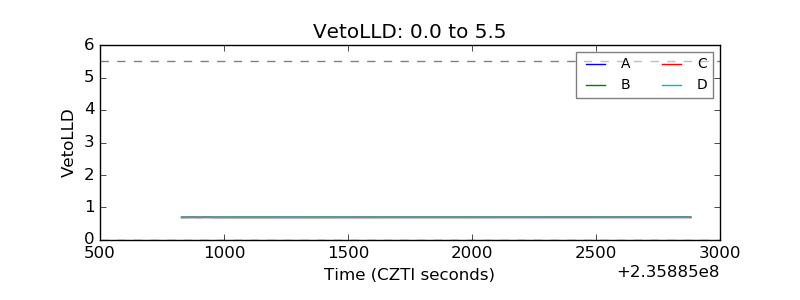 |
| Alpha Counter | 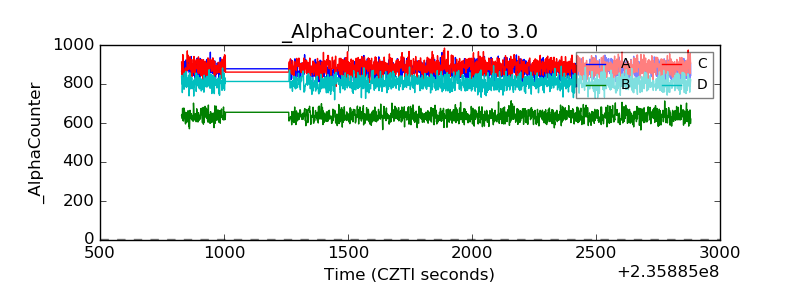 |
| _CPM_Rate | 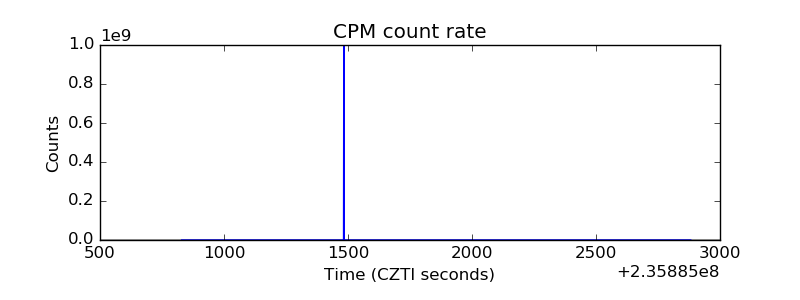 |
| CZT Counter | 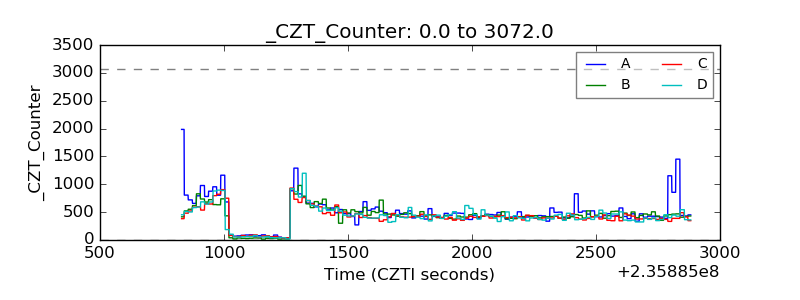 |
| +2.5 Volts monitor |  |
| +5 Volts monitor |  |
| _ROLL_ROT | 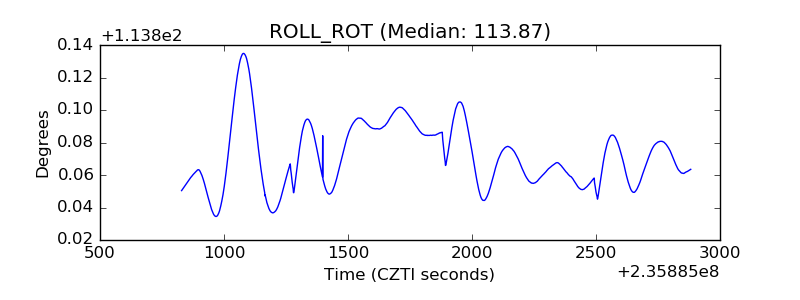 |
| _Roll_DEC | 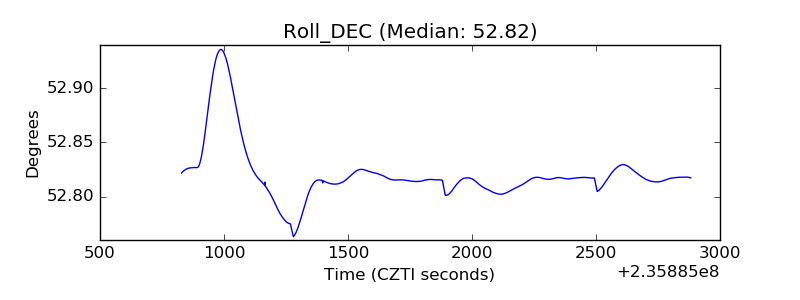 |
| _Roll_RA | 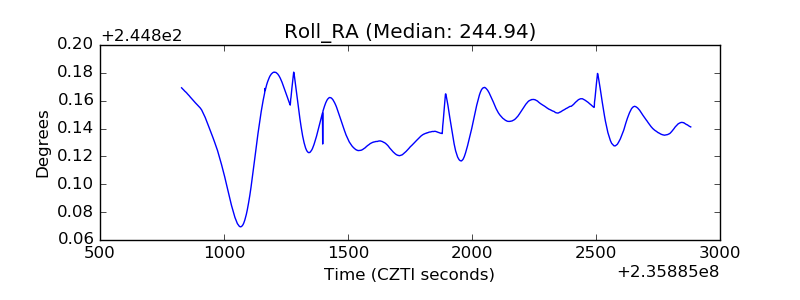 |
| Veto Counter | 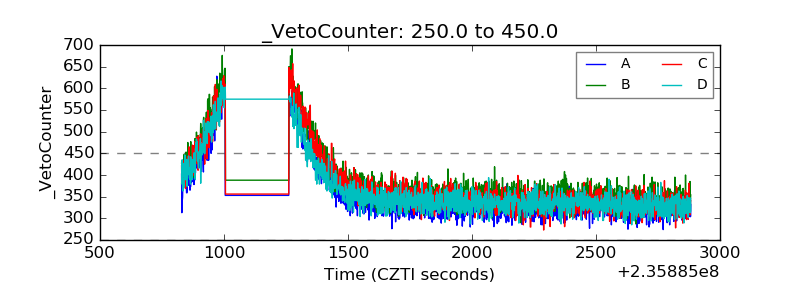 |