| Param | Original file | Final file |
|---|---|---|
| Filename | modeM0/AS1G07_069T01_9000001332_09388cztM0_level2.evt | modeM0/AS1G07_069T01_9000001332_09388cztM0_level2_quad_clean.evt |
| Size (bytes) | 2,139,724,800 | 289,206,720 |
| Size | 2.0 GB | 275.8 MB |
| Events in quadrant A | 13,154,872 | 1,862,883 |
| Events in quadrant B | 11,338,057 | 1,889,597 |
| Events in quadrant C | 10,686,329 | 1,890,851 |
| Events in quadrant D | 27,994,325 | 1,453,086 |
| Mode M0 | |||
|---|---|---|---|
| Quadrant | BADHDUFLAG | Total packets | Discarded packets |
| A | 0 | 54852 | 83 |
| B | 0 | 49736 | 84 |
| C | 0 | 49177 | 94 |
| D | 0 | 100852 | 889 |
| Mode SS | |||
|---|---|---|---|
| Quadrant | BADHDUFLAG | Total packets | Discarded packets |
| A | 0 | 494 | 0 |
| B | 0 | 494 | 2 |
| C | 0 | 494 | 0 |
| D | 0 | 494 | 2 |
| Mode M9 | |||
|---|---|---|---|
| Quadrant | BADHDUFLAG | Total packets | Discarded packets |
| A | 0 | 30 | 0 |
| B | 0 | 30 | 0 |
| C | 0 | 30 | 0 |
| D | 0 | 30 | 0 |
| Quadrant | Total seconds | Saturated seconds | Saturation percentage |
|---|---|---|---|
| A | 24147 | 418 | 1.731064% |
| B | 24150 | 380 | 1.573499% |
| C | 24142 | 227 | 0.940270% |
| D | 24072 | 7119 | 29.573779% |
Noise dominated data is calculated using 1-second bins in cleaned event files. If a bin has >2000 counts, and if more than 50% of those come from <1% of pixels, then it is considered to be noise-dominated and hence unusable.
| Quadrant | # 1 sec bins | Bins with >0 counts | Bins with >2000 counts | High rate bins dominated by noise | Noise dominated (total time) | Noise dominated (detector-on time) | Marked lightcurve |
|---|---|---|---|---|---|---|---|
| A | 27200 | 24186 | 19 | 19 | 0.07% | 0.08% | 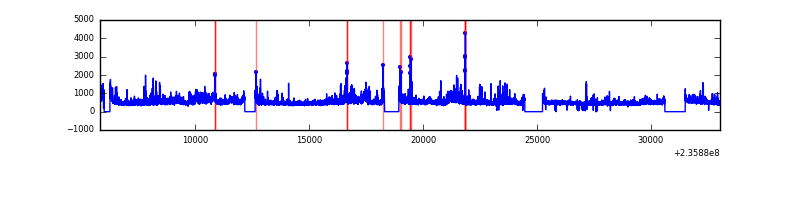 |
| B | 27200 | 24187 | 1 | 1 | 0.00% | 0.00% | 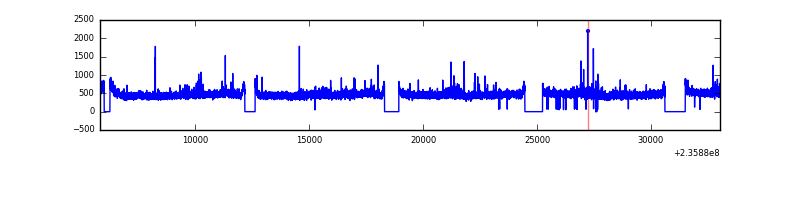 |
| C | 27200 | 24186 | 0 | 0 | 0.00% | 0.00% | 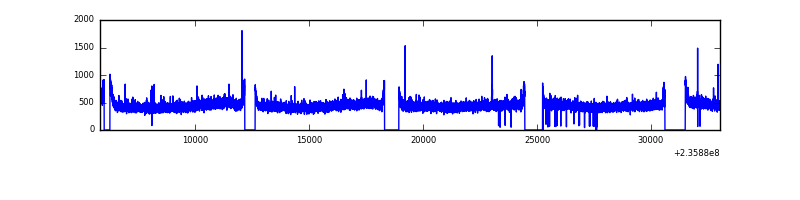 |
| D | 27200 | 24164 | 6468 | 6468 | 23.78% | 26.77% | 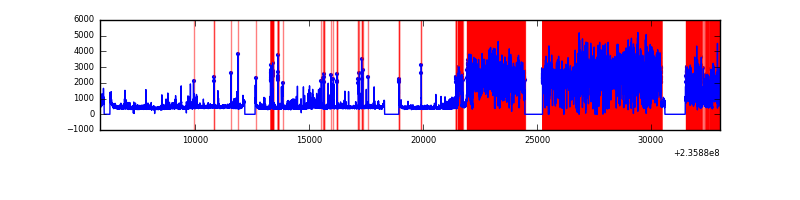 |
Top three noisy pixels from each quadrant. If the there are fewer than three noisy pixels in the level2.evt file, extra rows are filled as -1
| Pixel properties | Quadrant properties | ||||||
|---|---|---|---|---|---|---|---|
| Quadrant | DetID | PixID | Counts | Sigma | Mean | Median | Sigma |
| A | 8 | 5 | 1820165 | 3215.44 | 2790 | 2719 | 565.2 |
| A | 1 | 162 | 209774 | 366.32 | 2790 | 2719 | 565.2 |
| A | 4 | 2 | 100704 | 173.35 | 2790 | 2719 | 565.2 |
| B | 0 | 214 | 157905 | 287.92 | 2815 | 2739 | 538.9 |
| B | 0 | 219 | 115513 | 209.26 | 2815 | 2739 | 538.9 |
| B | 0 | 187 | 90948 | 163.68 | 2815 | 2739 | 538.9 |
| C | 13 | 61 | 20304 | 28.03 | 2731 | 2739 | 626.7 |
| C | 10 | 22 | 18387 | 24.97 | 2731 | 2739 | 626.7 |
| C | 14 | 234 | 10621 | 12.58 | 2731 | 2739 | 626.7 |
| D | 1 | 52 | 18423801 | 31760.15 | 2336 | 2281 | 580.0 |
| D | 13 | 104 | 145225 | 246.45 | 2336 | 2281 | 580.0 |
| D | 12 | 233 | 109857 | 185.47 | 2336 | 2281 | 580.0 |
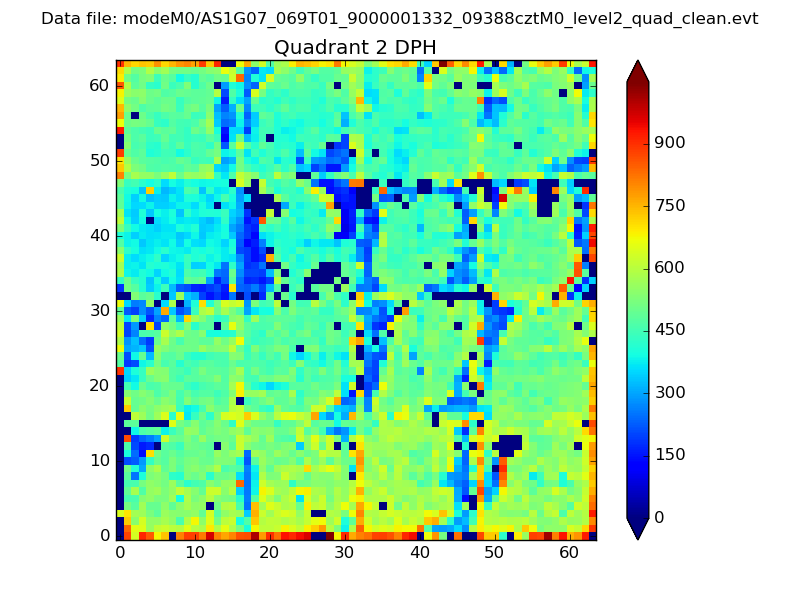
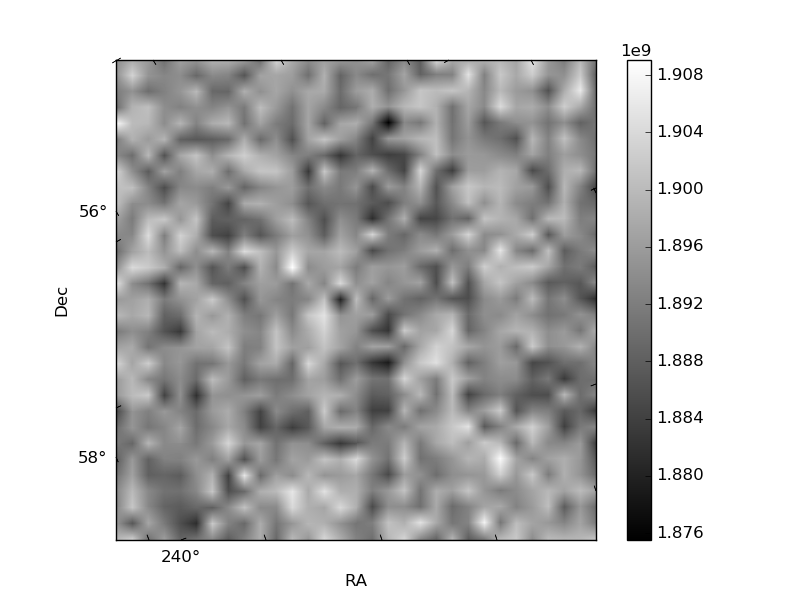
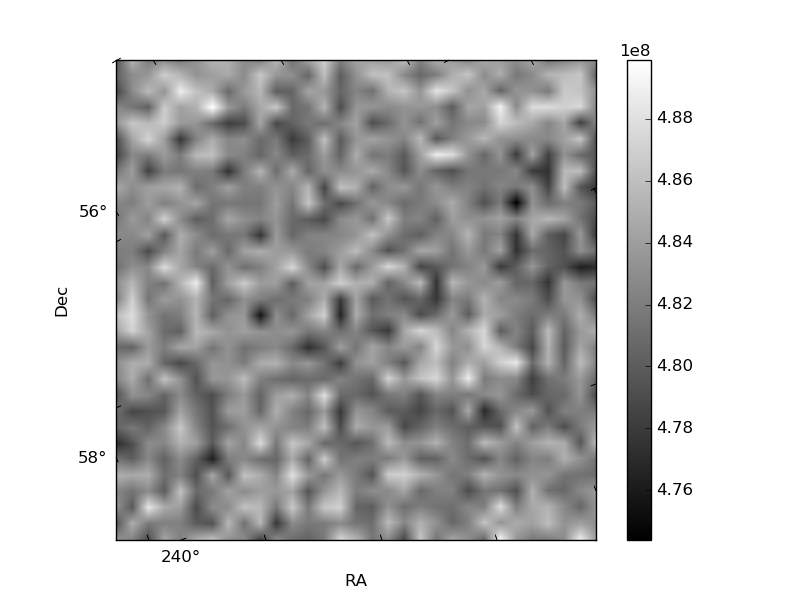
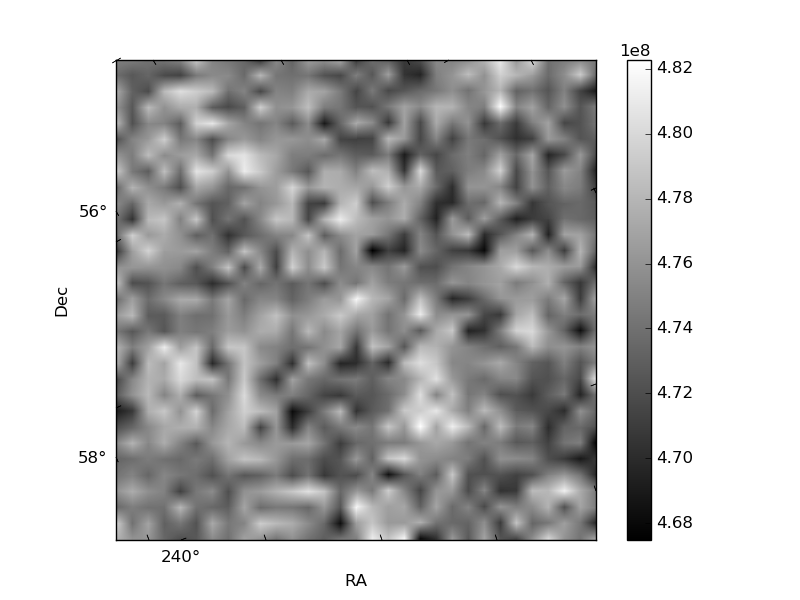
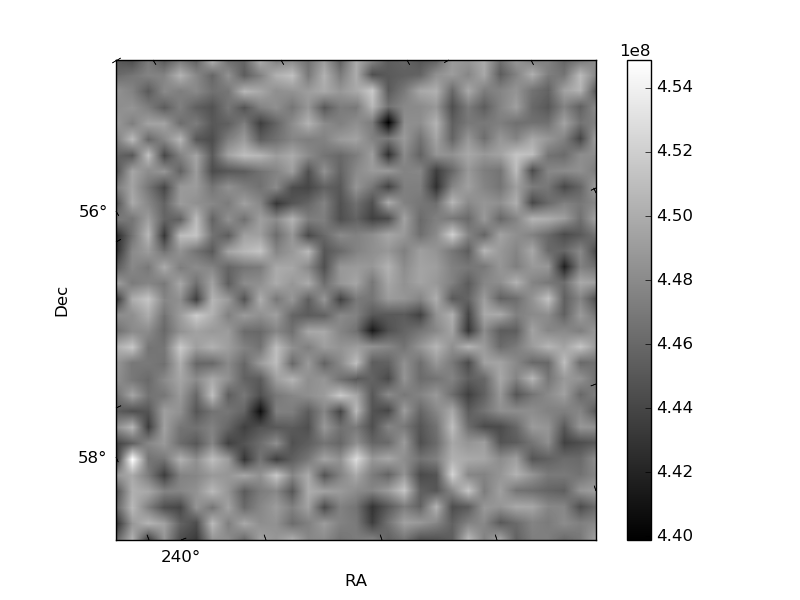
Histogram calculated using DETX and DETY for each event in the final _common_clean file
| Quadrant A | 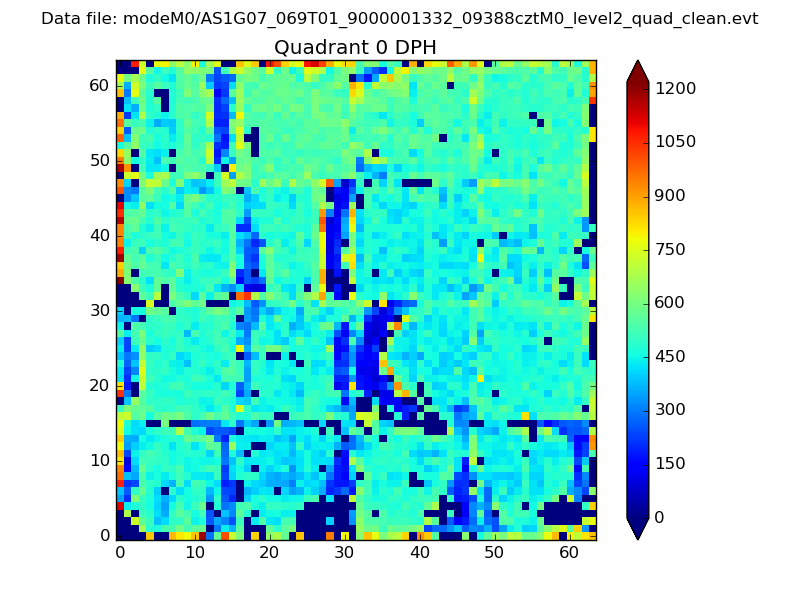 |
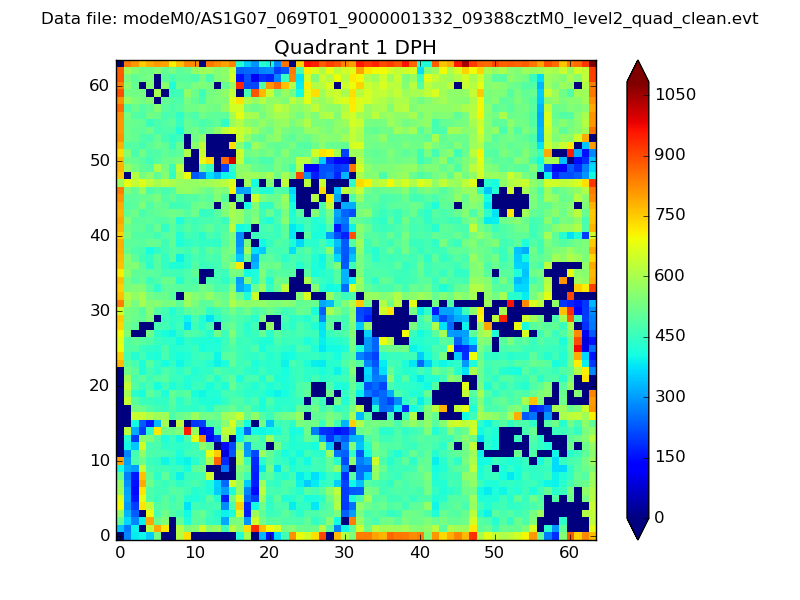 |
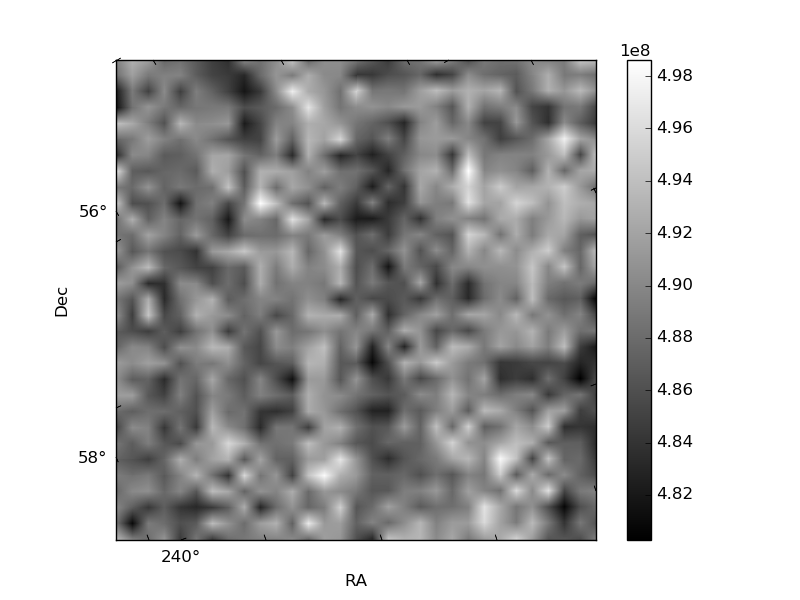
Quadrant B |
|---|---|---|---|
| Quadrant D | 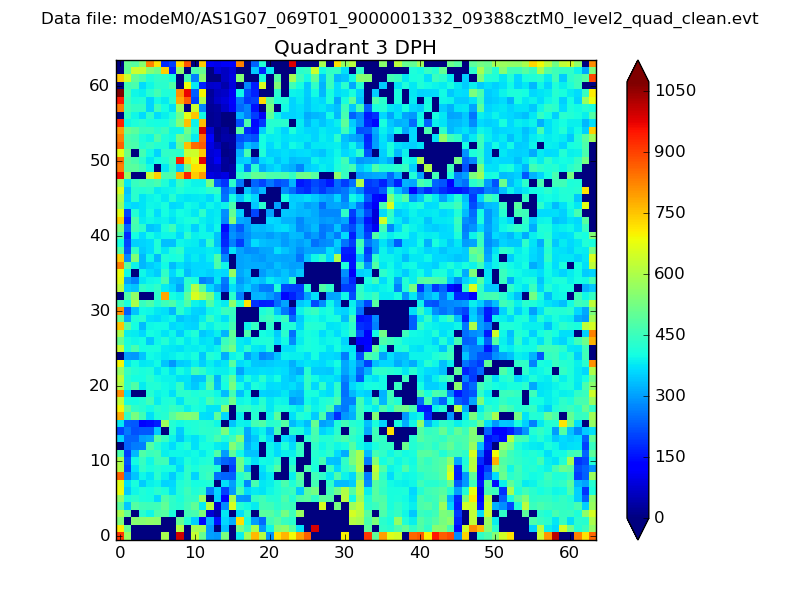 |
 |
Quadrant C |
| Plot type | Count rate plots | Images |
|---|---|---|
| Comparison with Poisson distribution Blue bars denote a histogram of data divided into 1 sec bins. Red curve is a Poisson curve with rate = median count rate of data. |
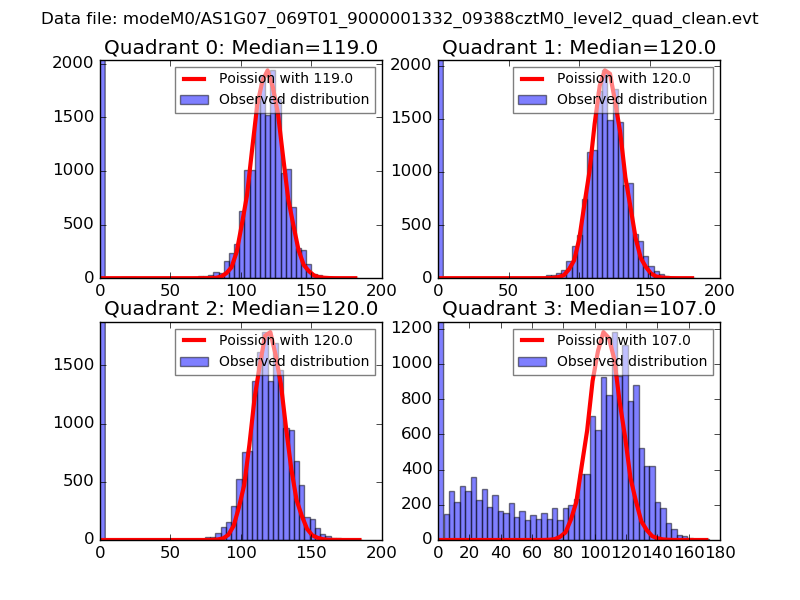 |
 |
| Quadrant-wise count rates Data is divided into 100 sec bins |
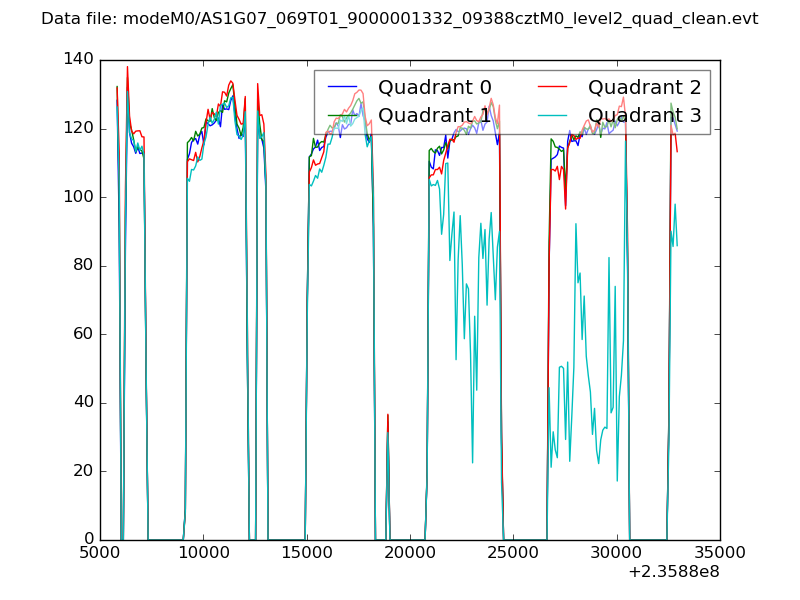 |
|
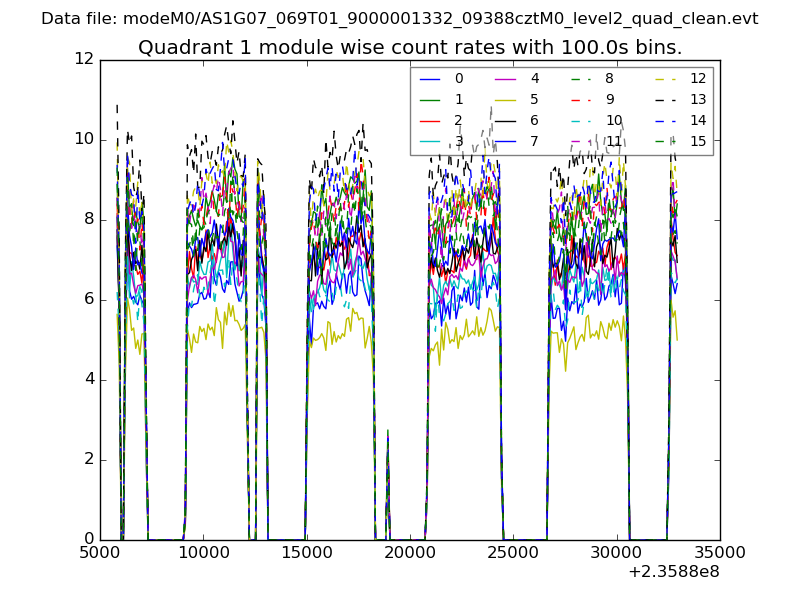
| Module-wise count rates for Quadrant A Data is divided into 100 sec bins |
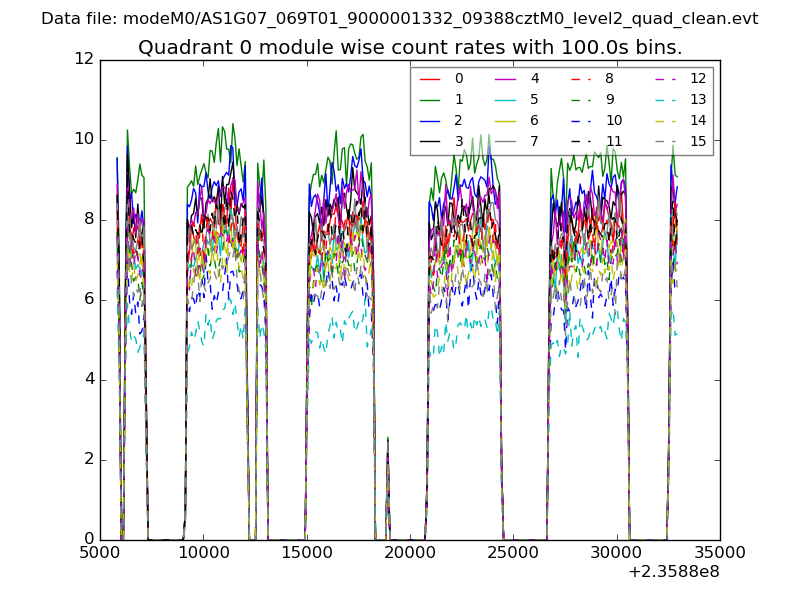 |
 |
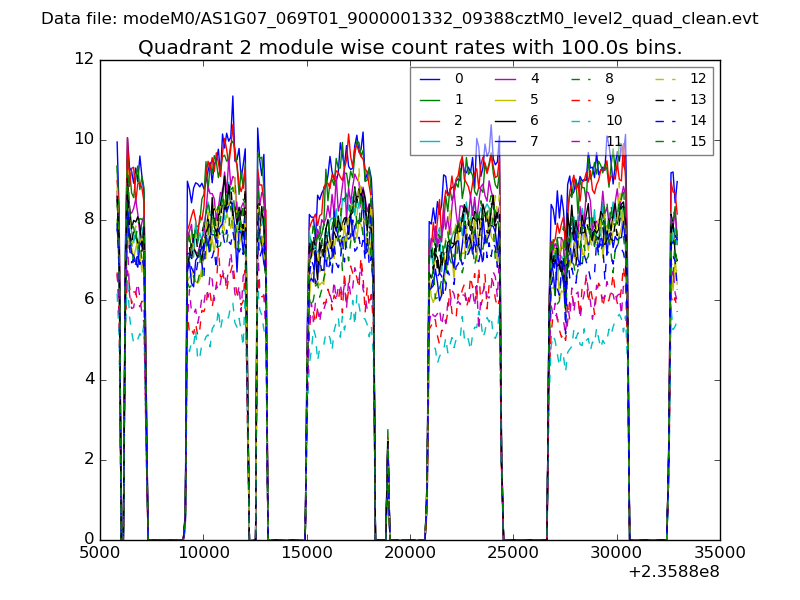
| Module-wise count rates for Quadrant B Data is divided into 100 sec bins |
 |
 |
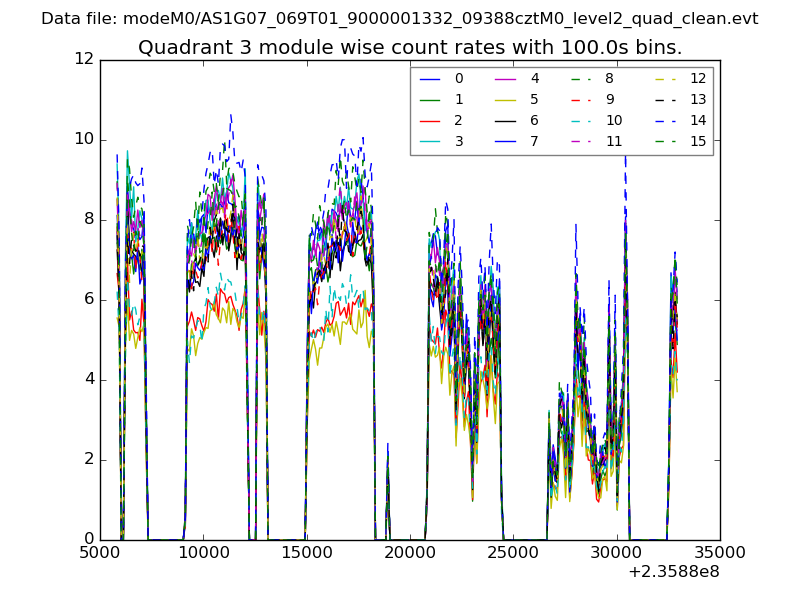
| Module-wise count rates for Quadrant C Data is divided into 100 sec bins |
 |
 |
| Module-wise count rates for Quadrant D Data is divided into 100 sec bins |
 |
 |
| Parameter | Plot |
|---|---|
| CZT HV Monitor | 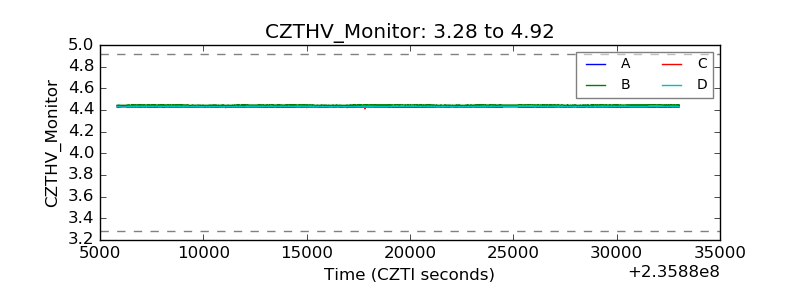 |
| D_VDD | 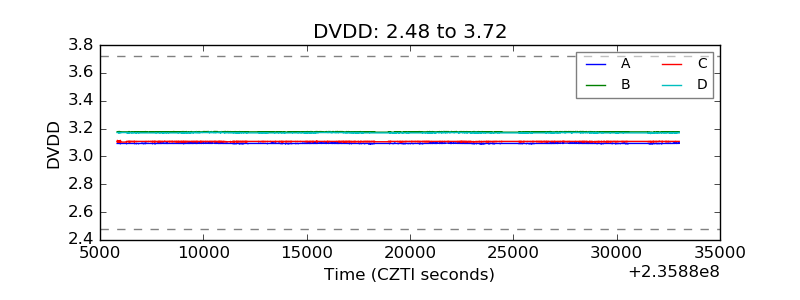 |
| Temperature 1 | 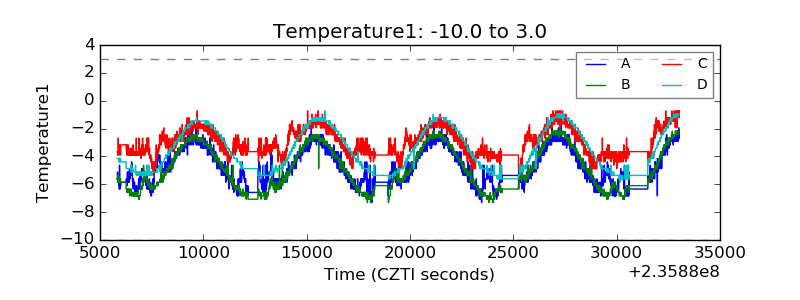 |
| Veto HV Monitor | 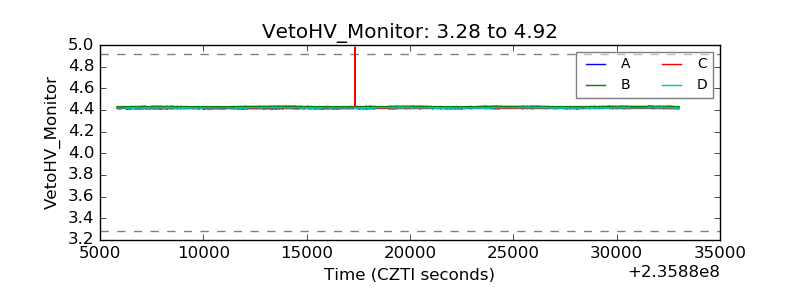 |
| Veto LLD | 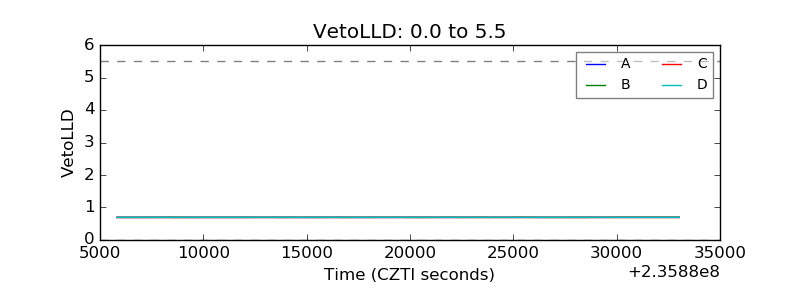 |
| Alpha Counter | 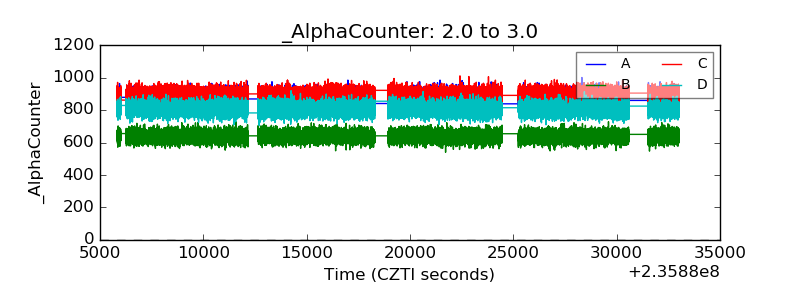 |
| _CPM_Rate | 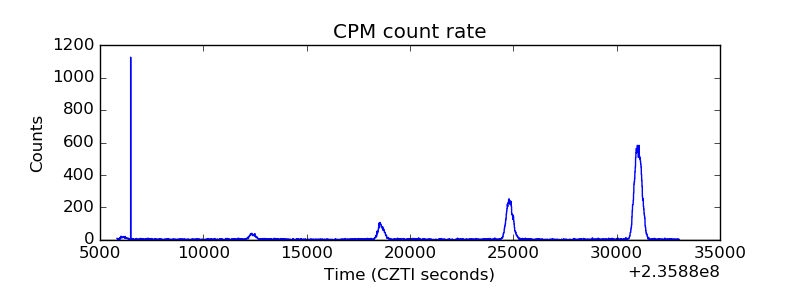 |
| CZT Counter | 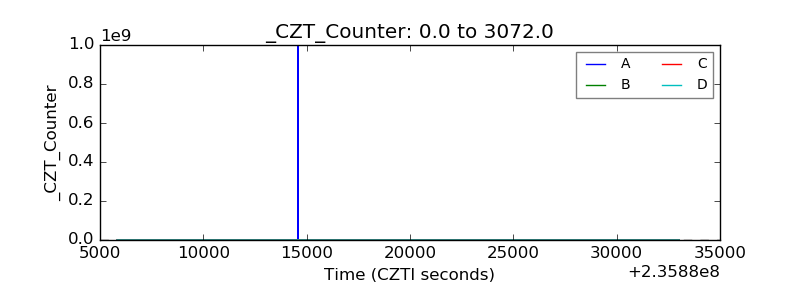 |
| +2.5 Volts monitor |  |
| +5 Volts monitor |  |
| _ROLL_ROT | 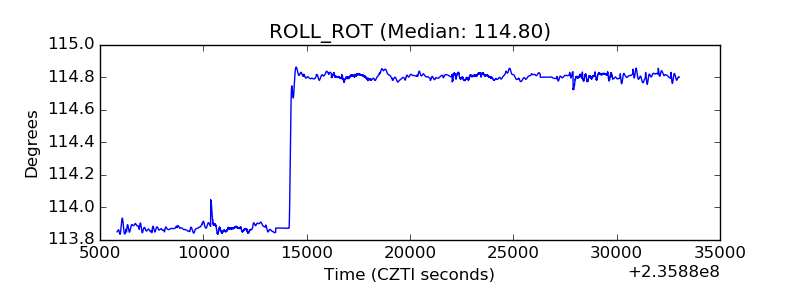 |
| _Roll_DEC | 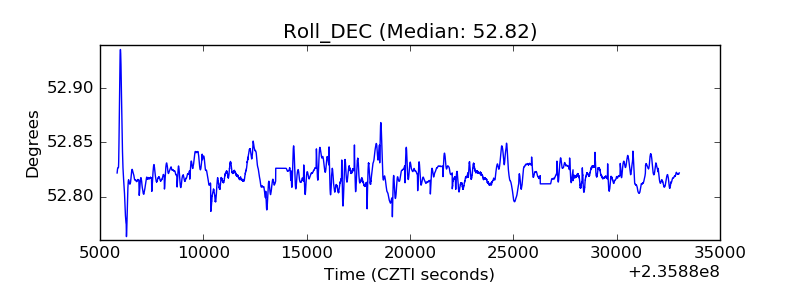 |
| _Roll_RA | 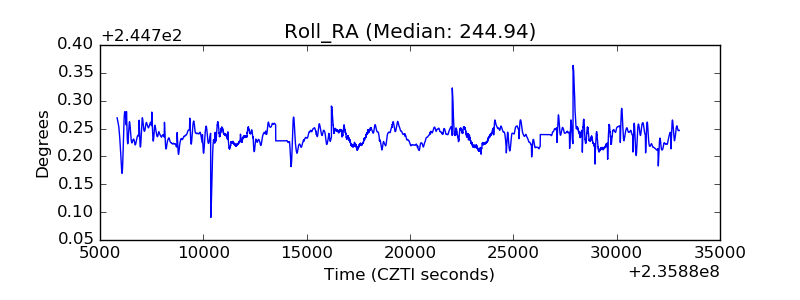 |
| Veto Counter | 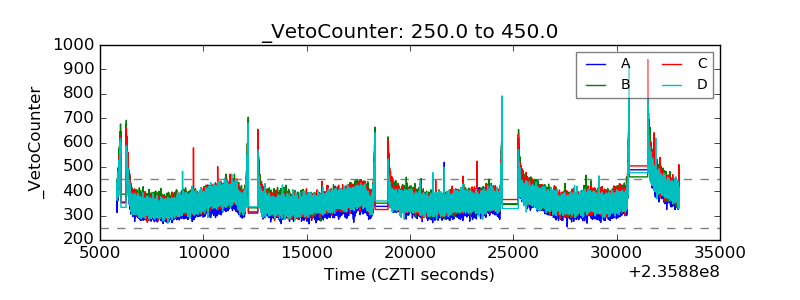 |