| Param | Original file | Final file |
|---|---|---|
| Filename | modeM0/AS1G07_069T01_9000001332_09391cztM0_level2.evt | modeM0/AS1G07_069T01_9000001332_09391cztM0_level2_quad_clean.evt |
| Size (bytes) | 444,899,520 | 98,778,240 |
| Size | 424.3 MB | 94.2 MB |
| Events in quadrant A | 3,529,539 | 647,917 |
| Events in quadrant B | 3,032,506 | 654,151 |
| Events in quadrant C | 2,763,111 | 651,299 |
| Events in quadrant D | 3,747,108 | 625,054 |
| Mode M0 | |||
|---|---|---|---|
| Quadrant | BADHDUFLAG | Total packets | Discarded packets |
| A | 0 | 14437 | 12 |
| B | 0 | 13187 | 6 |
| C | 0 | 12205 | 17 |
| D | 0 | 15026 | 14 |
| Mode SS | |||
|---|---|---|---|
| Quadrant | BADHDUFLAG | Total packets | Discarded packets |
| A | 0 | 120 | 0 |
| B | 0 | 120 | 0 |
| C | 0 | 120 | 0 |
| D | 0 | 120 | 0 |
| Mode M9 | |||
|---|---|---|---|
| Quadrant | BADHDUFLAG | Total packets | Discarded packets |
| A | 0 | 12 | 0 |
| B | 0 | 12 | 0 |
| C | 0 | 12 | 0 |
| D | 0 | 12 | 0 |
| Quadrant | Total seconds | Saturated seconds | Saturation percentage |
|---|---|---|---|
| A | 5914 | 69 | 1.166723% |
| B | 5916 | 78 | 1.318458% |
| C | 5909 | 44 | 0.744627% |
| D | 5913 | 201 | 3.399290% |
Noise dominated data is calculated using 1-second bins in cleaned event files. If a bin has >2000 counts, and if more than 50% of those come from <1% of pixels, then it is considered to be noise-dominated and hence unusable.
| Quadrant | # 1 sec bins | Bins with >0 counts | Bins with >2000 counts | High rate bins dominated by noise | Noise dominated (total time) | Noise dominated (detector-on time) | Marked lightcurve |
|---|---|---|---|---|---|---|---|
| A | 7098 | 5919 | 4 | 4 | 0.06% | 0.07% | 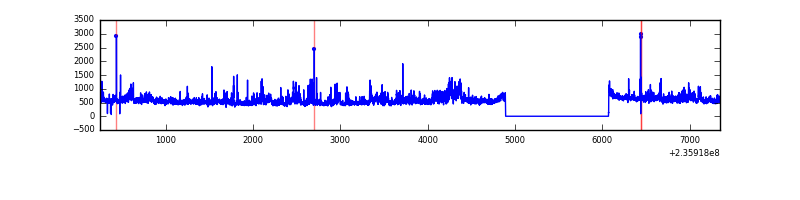 |
| B | 7098 | 5919 | 10 | 10 | 0.14% | 0.17% | 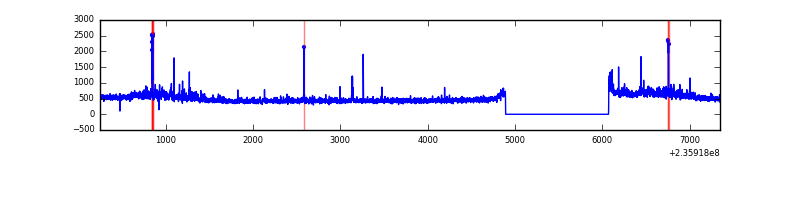 |
| C | 7098 | 5917 | 0 | 0 | 0.00% | 0.00% | 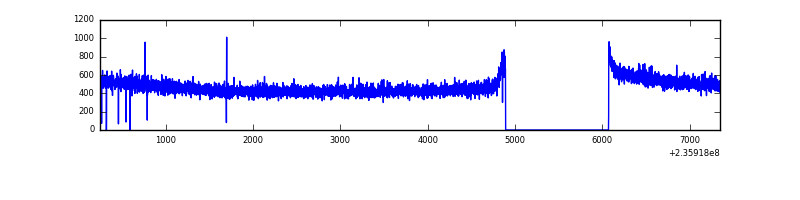 |
| D | 7098 | 5919 | 132 | 132 | 1.86% | 2.23% | 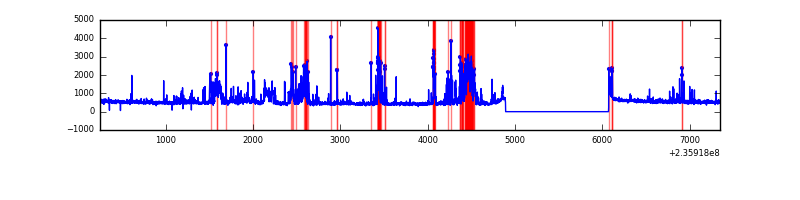 |
Top three noisy pixels from each quadrant. If the there are fewer than three noisy pixels in the level2.evt file, extra rows are filled as -1
| Pixel properties | Quadrant properties | ||||||
|---|---|---|---|---|---|---|---|
| Quadrant | DetID | PixID | Counts | Sigma | Mean | Median | Sigma |
| A | 8 | 5 | 669244 | 4568.0 | 723 | 707 | 146.4 |
| A | 13 | 251 | 31722 | 211.92 | 723 | 707 | 146.4 |
| A | 1 | 162 | 21955 | 145.18 | 723 | 707 | 146.4 |
| B | 0 | 187 | 100119 | 733.2 | 721 | 704 | 135.6 |
| B | 0 | 214 | 76037 | 555.59 | 721 | 704 | 135.6 |
| B | 0 | 219 | 30354 | 218.67 | 721 | 704 | 135.6 |
| C | 13 | 61 | 5253 | 28.11 | 707 | 712 | 161.5 |
| C | 8 | 222 | 1952 | 7.68 | 707 | 712 | 161.5 |
| C | 3 | 202 | 1844 | 7.01 | 707 | 712 | 161.5 |
| D | 2 | 14 | 332610 | 1892.96 | 700 | 683 | 175.3 |
| D | 12 | 227 | 252831 | 1437.98 | 700 | 683 | 175.3 |
| D | 1 | 52 | 216315 | 1229.74 | 700 | 683 | 175.3 |
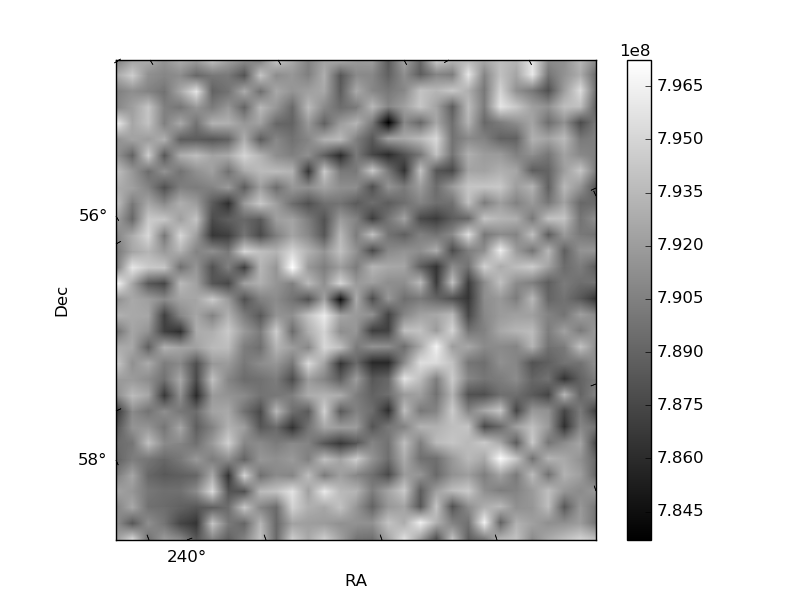
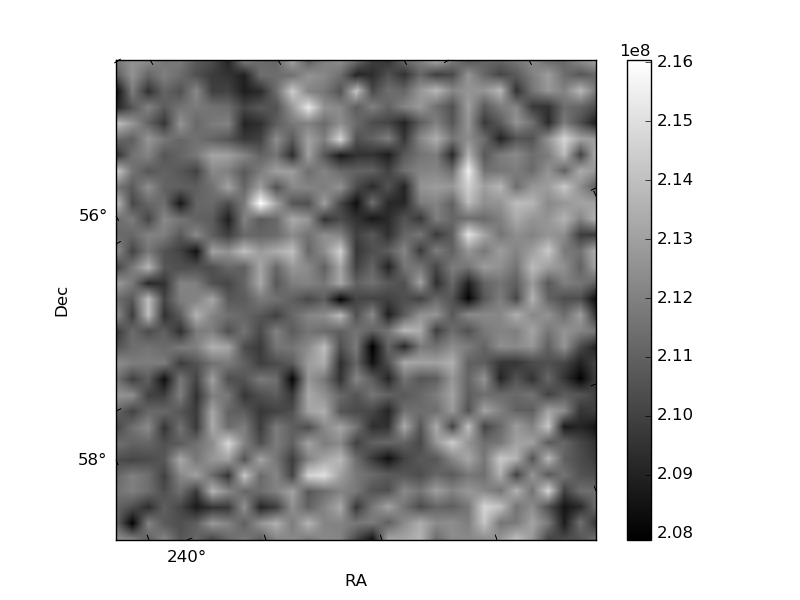
Histogram calculated using DETX and DETY for each event in the final _common_clean file
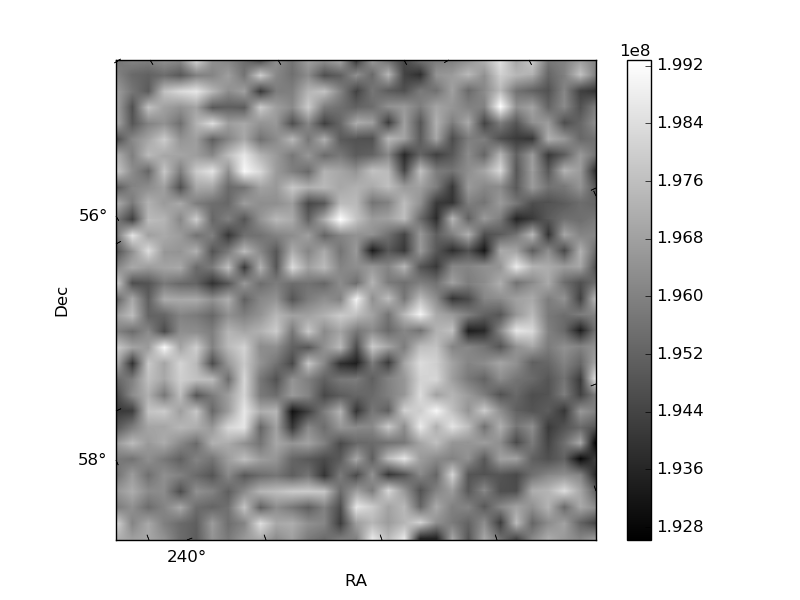
| Quadrant A | 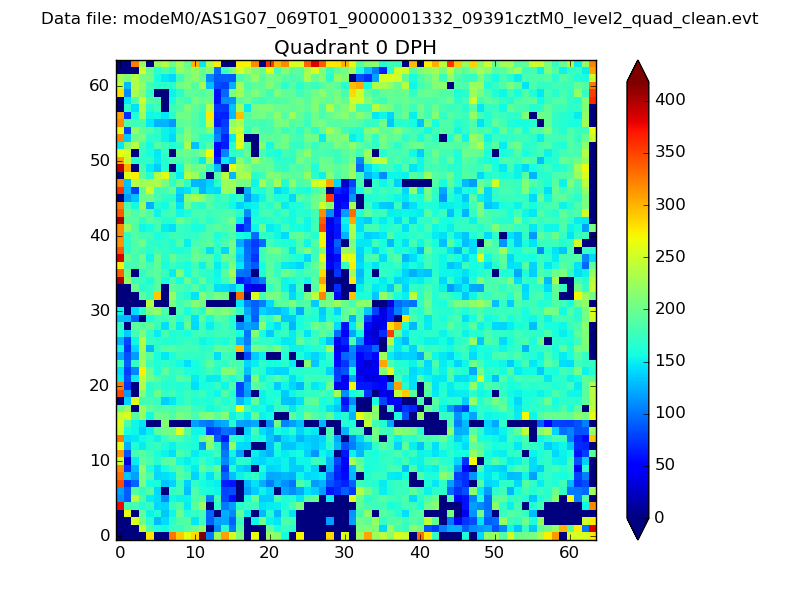 |
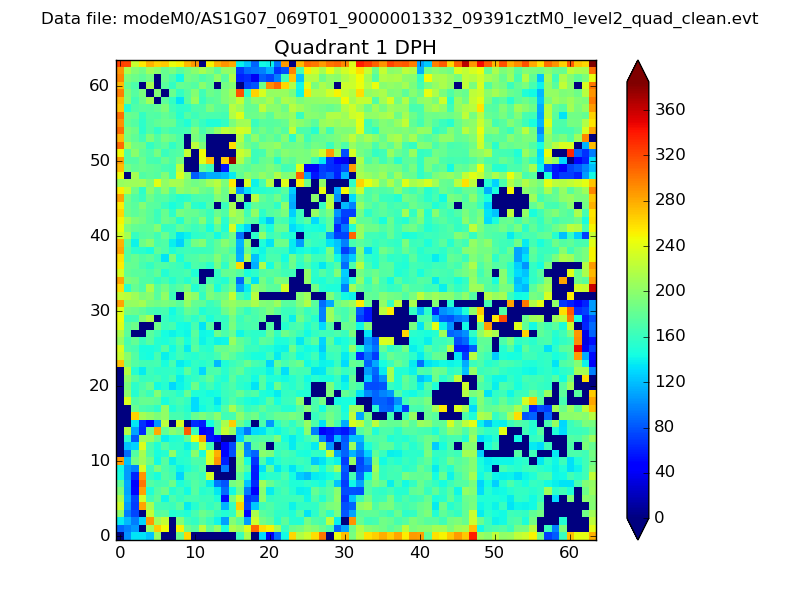 |
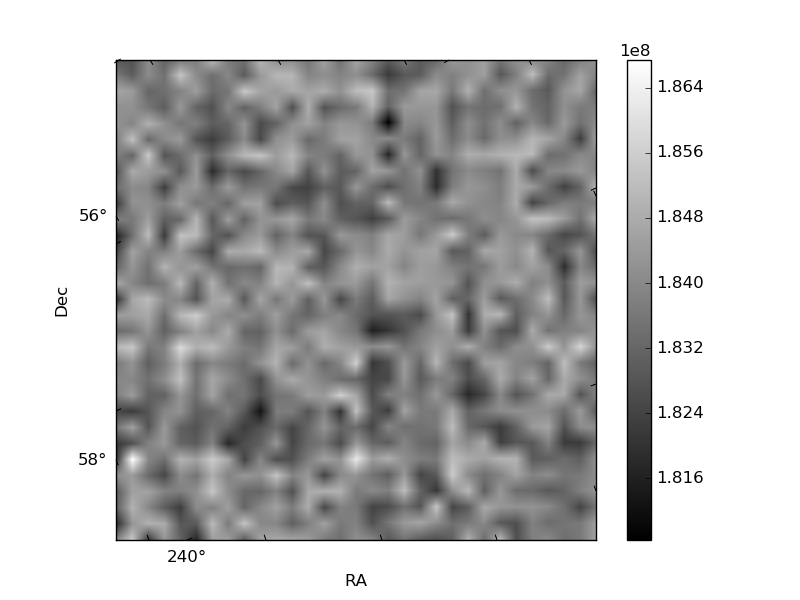
Quadrant B |
|---|---|---|---|
| Quadrant D | 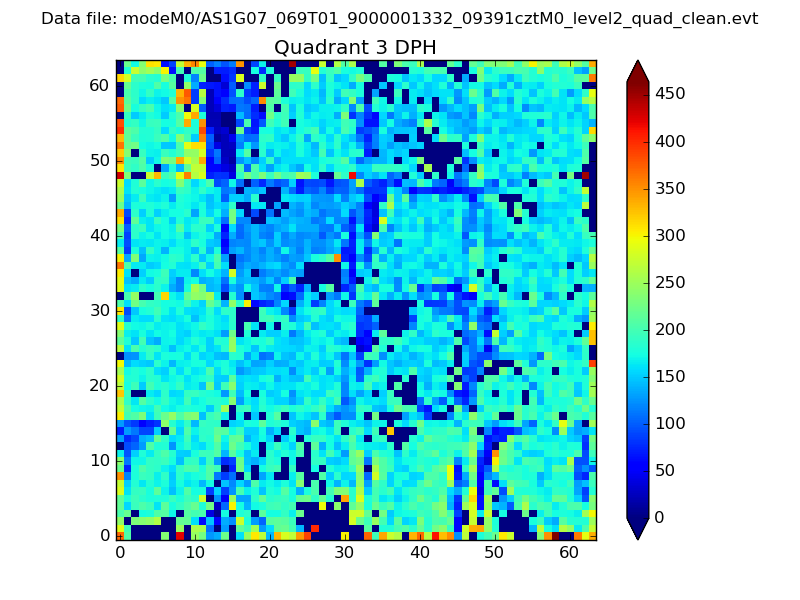 |
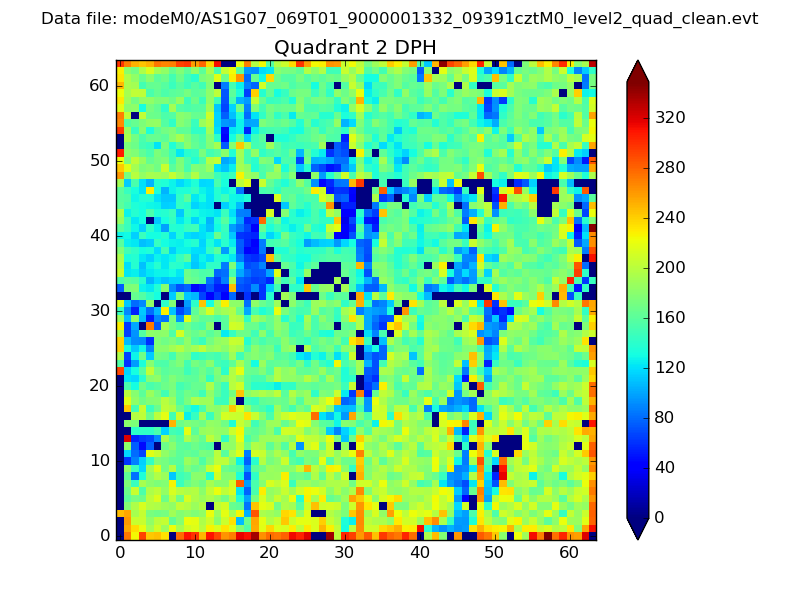 |
Quadrant C |
| Plot type | Count rate plots | Images |
|---|---|---|
| Comparison with Poisson distribution Blue bars denote a histogram of data divided into 1 sec bins. Red curve is a Poisson curve with rate = median count rate of data. |
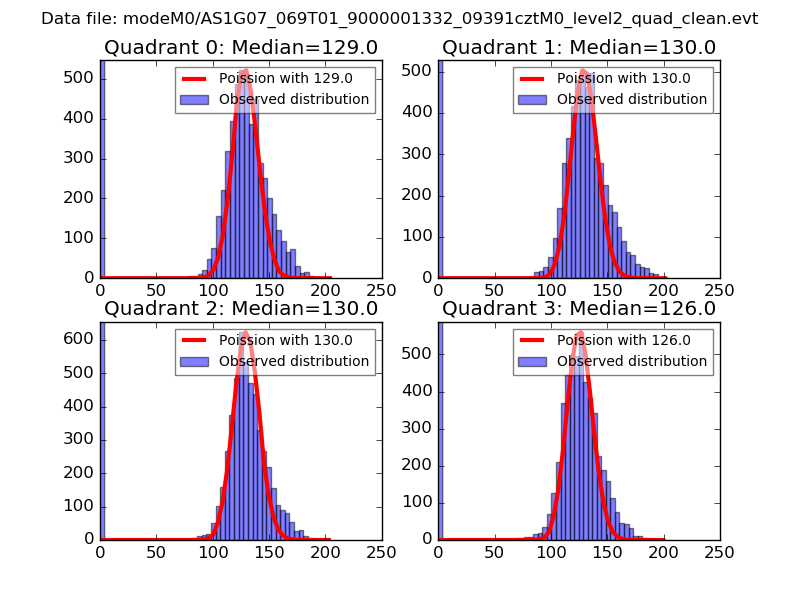 |
 |
| Quadrant-wise count rates Data is divided into 100 sec bins |
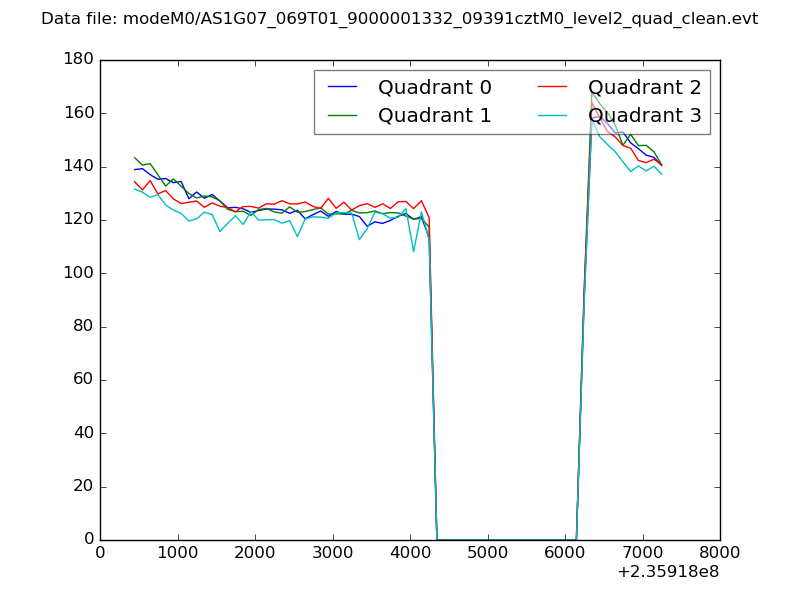 |
|
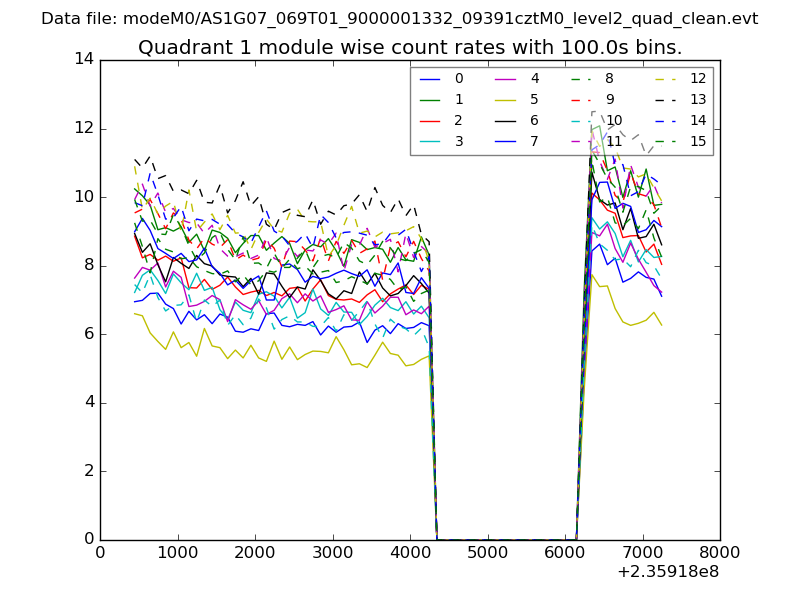
| Module-wise count rates for Quadrant A Data is divided into 100 sec bins |
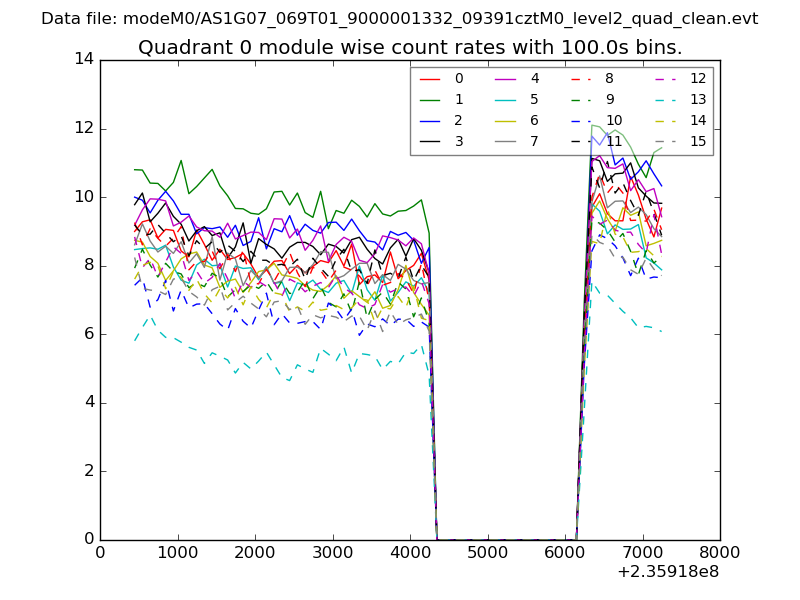 |
 |
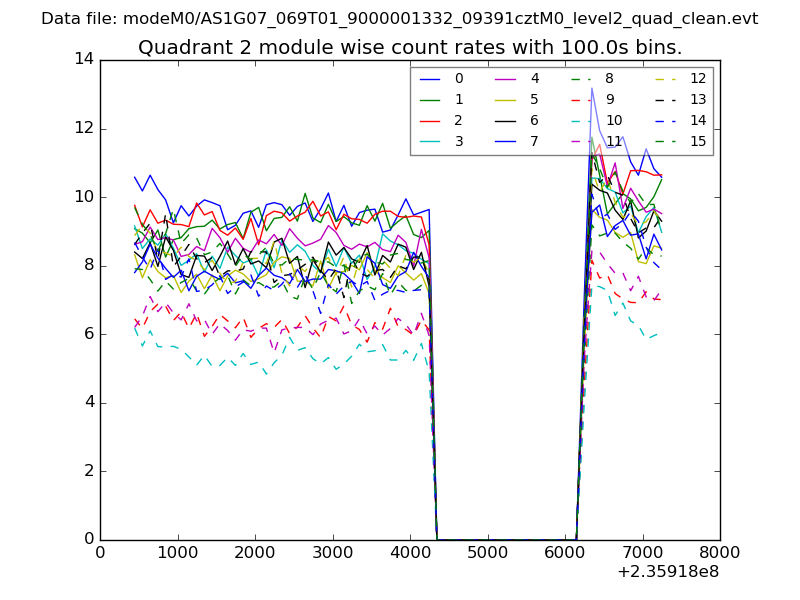
| Module-wise count rates for Quadrant B Data is divided into 100 sec bins |
 |
 |
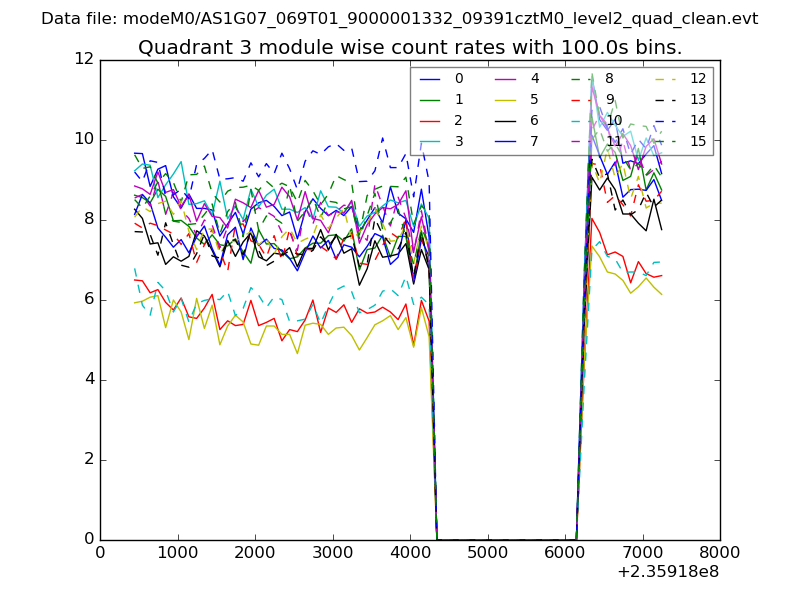
| Module-wise count rates for Quadrant C Data is divided into 100 sec bins |
 |
 |
| Module-wise count rates for Quadrant D Data is divided into 100 sec bins |
 |
 |
| Parameter | Plot |
|---|---|
| CZT HV Monitor | 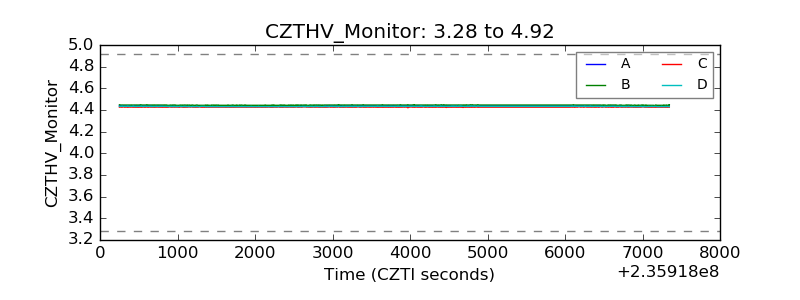 |
| D_VDD |  |
| Temperature 1 | 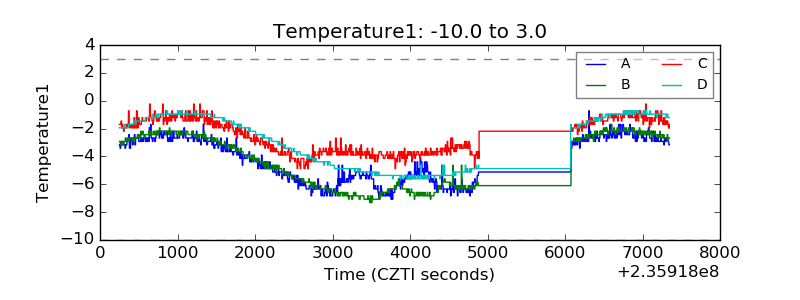 |
| Veto HV Monitor |  |
| Veto LLD | 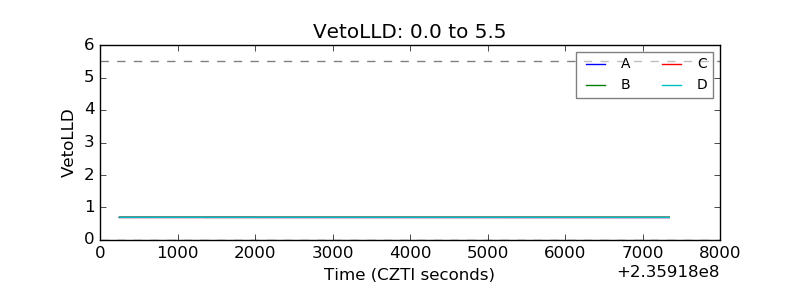 |
| Alpha Counter | 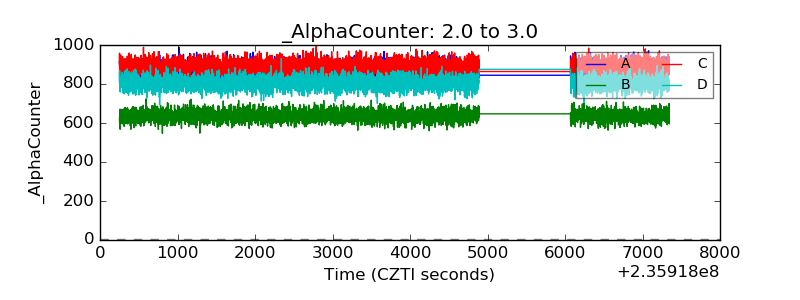 |
| _CPM_Rate | 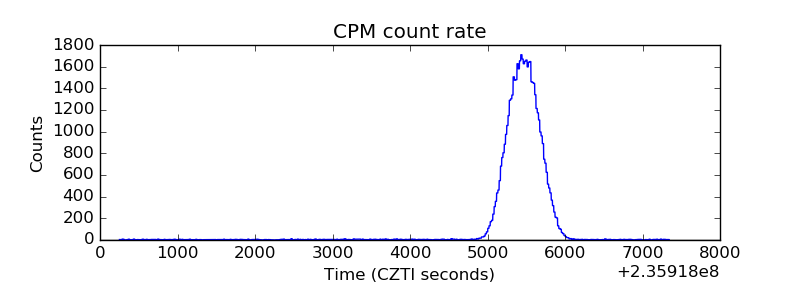 |
| CZT Counter | 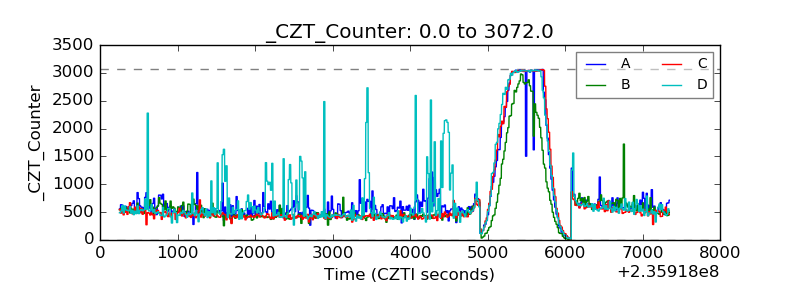 |
| +2.5 Volts monitor |  |
| +5 Volts monitor |  |
| _ROLL_ROT | 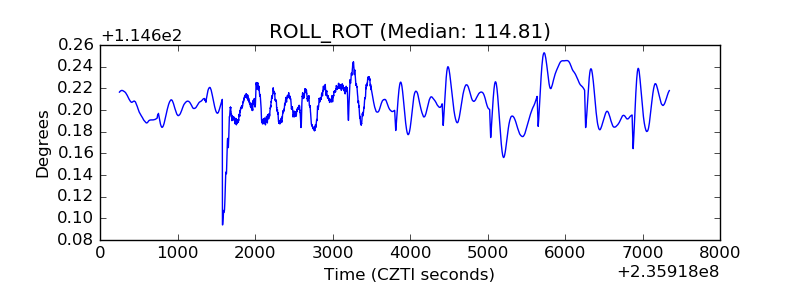 |
| _Roll_DEC | 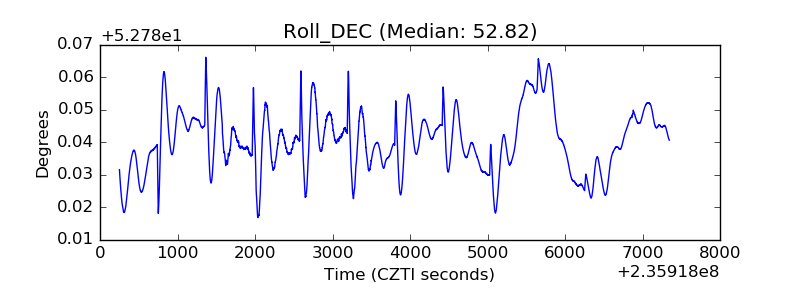 |
| _Roll_RA | 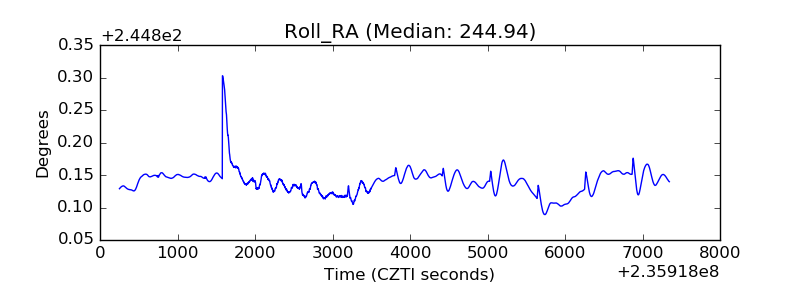 |
| Veto Counter | 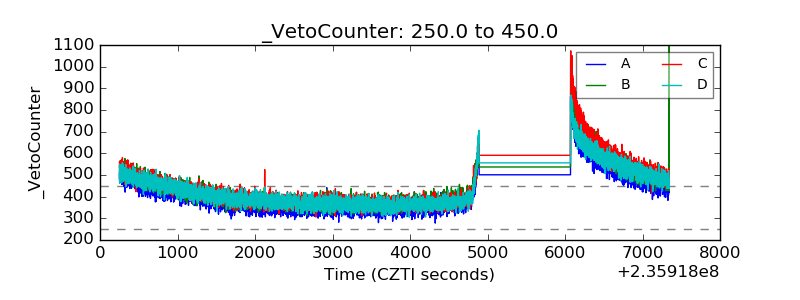 |