| Param | Original file | Final file |
|---|---|---|
| Filename | modeM0/AS1G07_069T01_9000001332_09392cztM0_level2.evt | modeM0/AS1G07_069T01_9000001332_09392cztM0_level2_quad_clean.evt |
| Size (bytes) | 770,319,360 | 175,386,240 |
| Size | 734.6 MB | 167.3 MB |
| Events in quadrant A | 6,443,837 | 1,148,356 |
| Events in quadrant B | 5,053,301 | 1,166,036 |
| Events in quadrant C | 4,858,376 | 1,172,002 |
| Events in quadrant D | 6,279,616 | 1,115,570 |
| Mode M0 | |||
|---|---|---|---|
| Quadrant | BADHDUFLAG | Total packets | Discarded packets |
| A | 0 | 26127 | 16 |
| B | 0 | 22201 | 16 |
| C | 0 | 21459 | 12 |
| D | 0 | 25618 | 23 |
| Mode SS | |||
|---|---|---|---|
| Quadrant | BADHDUFLAG | Total packets | Discarded packets |
| A | 0 | 210 | 2 |
| B | 0 | 210 | 0 |
| C | 0 | 210 | 0 |
| D | 0 | 210 | 0 |
| Mode M9 | |||
|---|---|---|---|
| Quadrant | BADHDUFLAG | Total packets | Discarded packets |
| A | 0 | 25 | 0 |
| B | 0 | 25 | 0 |
| C | 0 | 25 | 0 |
| D | 0 | 25 | 1 |
| Quadrant | Total seconds | Saturated seconds | Saturation percentage |
|---|---|---|---|
| A | 10254 | 216 | 2.106495% |
| B | 10254 | 100 | 0.975229% |
| C | 10255 | 108 | 1.053145% |
| D | 10251 | 415 | 4.048386% |
Noise dominated data is calculated using 1-second bins in cleaned event files. If a bin has >2000 counts, and if more than 50% of those come from <1% of pixels, then it is considered to be noise-dominated and hence unusable.
| Quadrant | # 1 sec bins | Bins with >0 counts | Bins with >2000 counts | High rate bins dominated by noise | Noise dominated (total time) | Noise dominated (detector-on time) | Marked lightcurve |
|---|---|---|---|---|---|---|---|
| A | 12724 | 10261 | 67 | 67 | 0.53% | 0.65% |  |
| B | 12724 | 10261 | 4 | 4 | 0.03% | 0.04% | 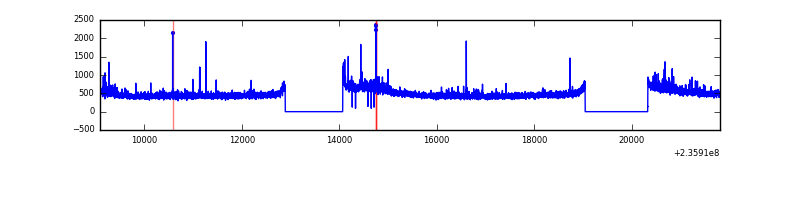 |
| C | 12724 | 10261 | 16 | 16 | 0.13% | 0.16% | 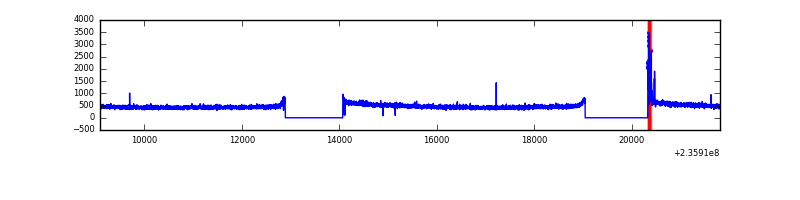 |
| D | 12724 | 10261 | 281 | 281 | 2.21% | 2.74% | 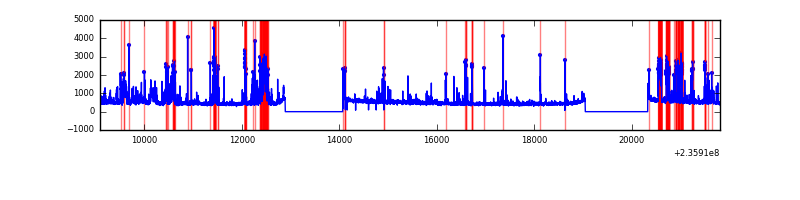 |
Top three noisy pixels from each quadrant. If the there are fewer than three noisy pixels in the level2.evt file, extra rows are filled as -1
| Pixel properties | Quadrant properties | ||||||
|---|---|---|---|---|---|---|---|
| Quadrant | DetID | PixID | Counts | Sigma | Mean | Median | Sigma |
| A | 8 | 5 | 1577936 | 6385.15 | 1231 | 1205 | 246.9 |
| A | 5 | 16 | 37733 | 147.92 | 1231 | 1205 | 246.9 |
| A | 1 | 162 | 36008 | 140.94 | 1231 | 1205 | 246.9 |
| B | 0 | 214 | 86336 | 369.67 | 1240 | 1209 | 230.3 |
| B | 0 | 187 | 66896 | 285.25 | 1240 | 1209 | 230.3 |
| B | 8 | 234 | 28753 | 119.61 | 1240 | 1209 | 230.3 |
| C | 14 | 234 | 76989 | 273.25 | 1223 | 1232 | 277.2 |
| C | 13 | 61 | 9182 | 28.68 | 1223 | 1232 | 277.2 |
| C | 10 | 22 | 7519 | 22.68 | 1223 | 1232 | 277.2 |
| D | 1 | 52 | 603054 | 1976.33 | 1202 | 1176 | 304.5 |
| D | 2 | 14 | 343601 | 1124.39 | 1202 | 1176 | 304.5 |
| D | 12 | 227 | 256605 | 838.73 | 1202 | 1176 | 304.5 |
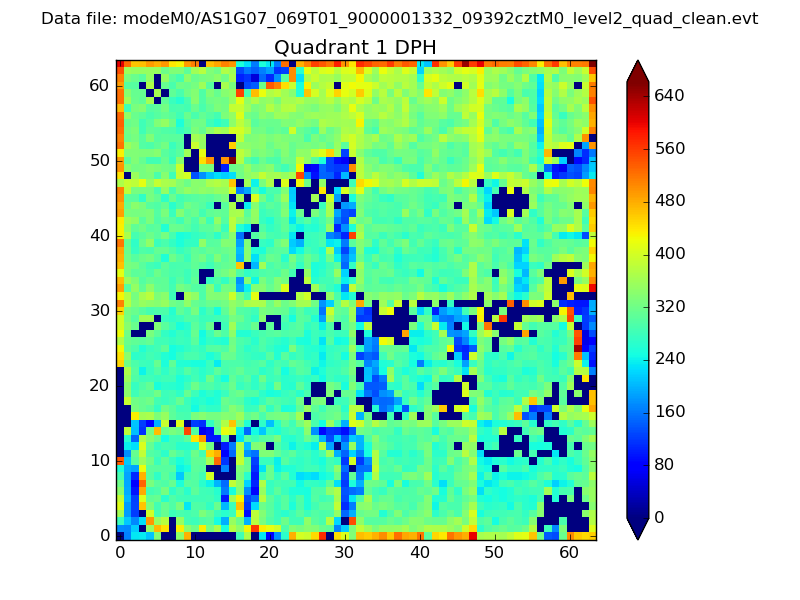
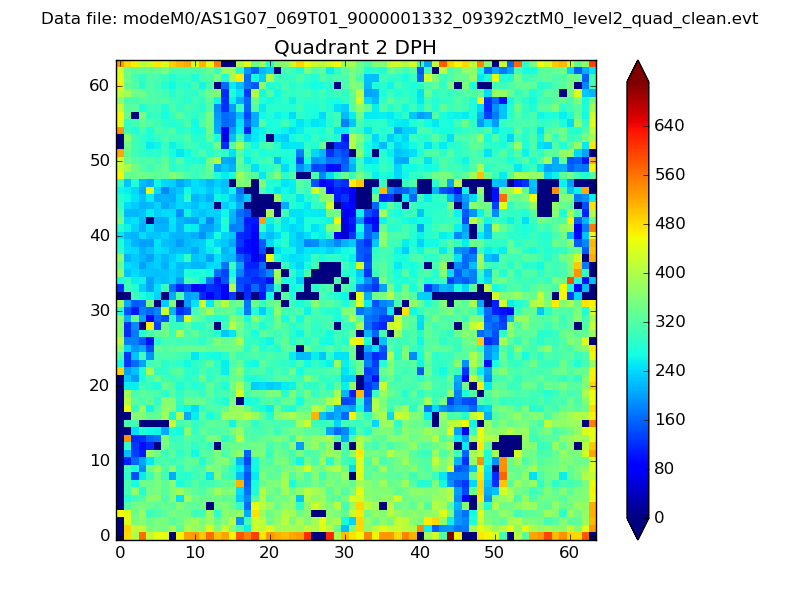
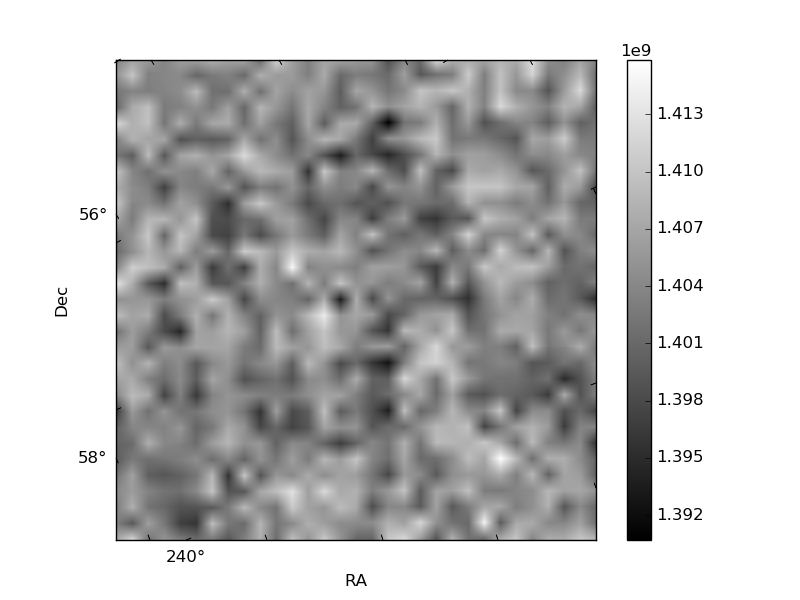
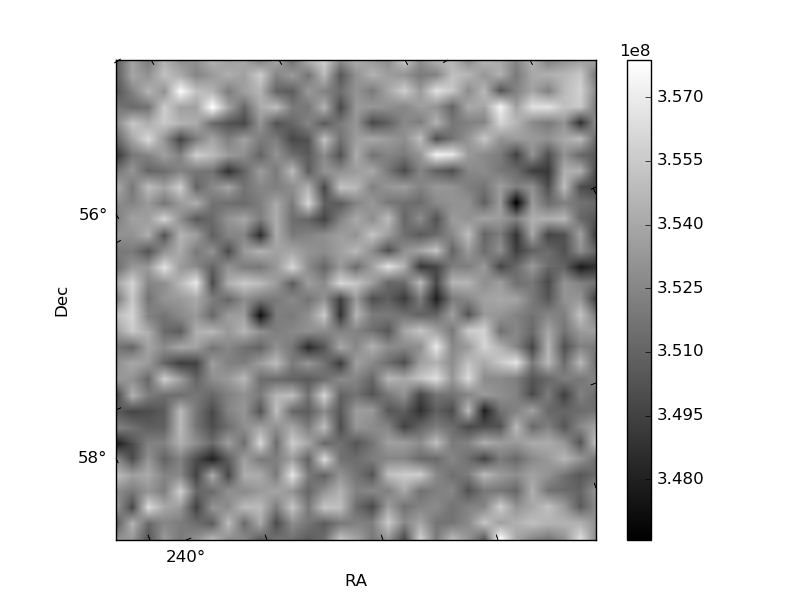
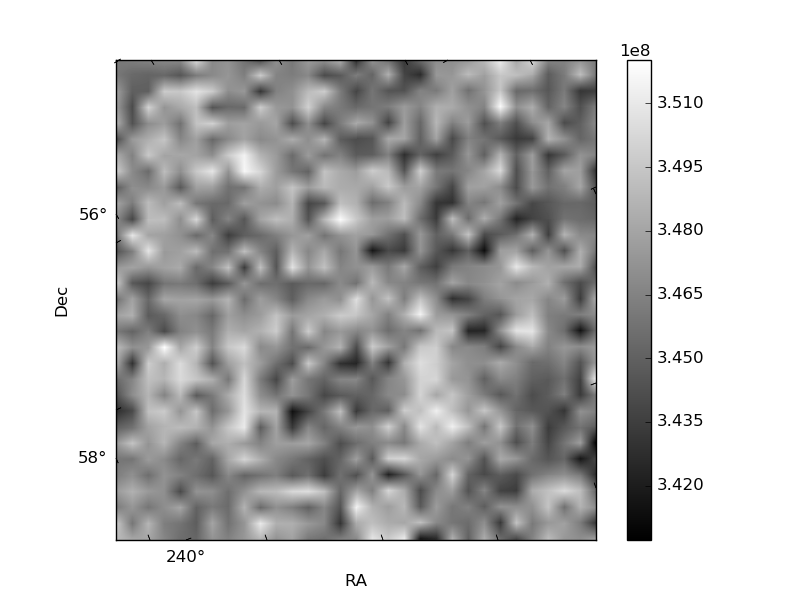
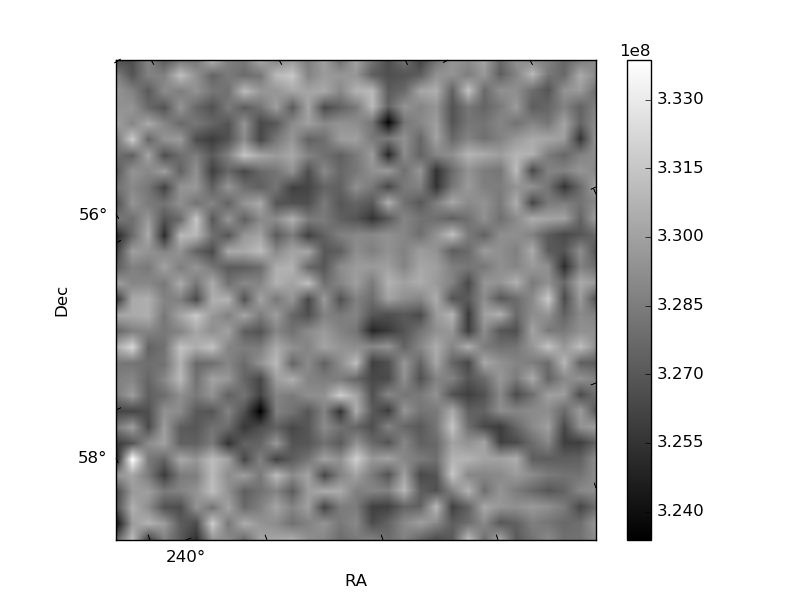
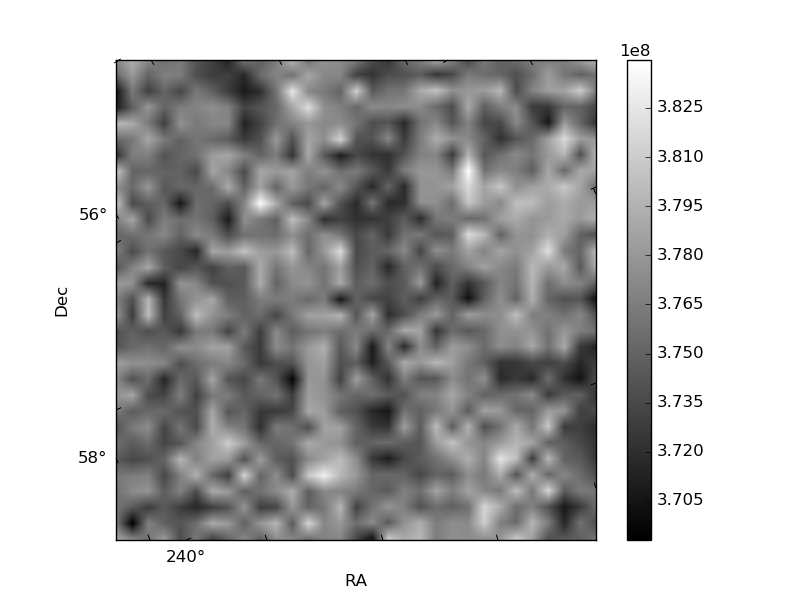
Histogram calculated using DETX and DETY for each event in the final _common_clean file
| Quadrant A | 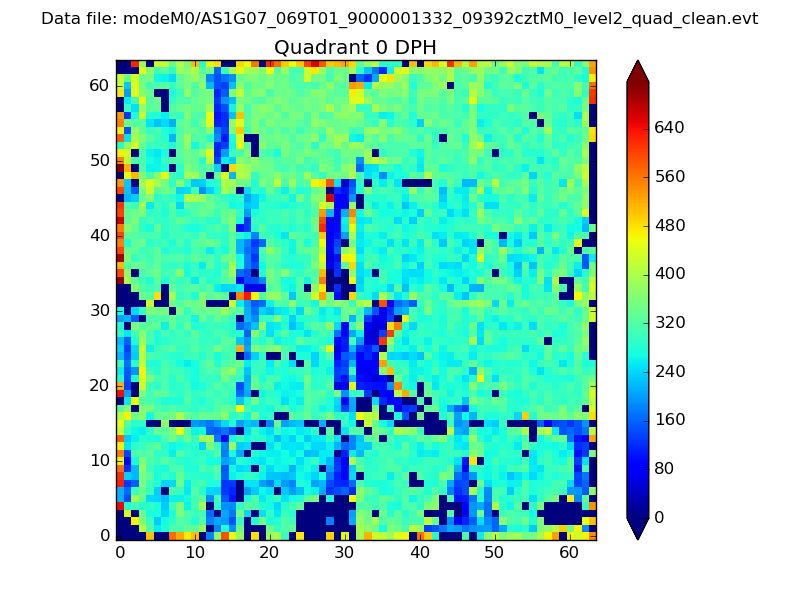 |
 |
Quadrant B |
|---|---|---|---|
| Quadrant D | 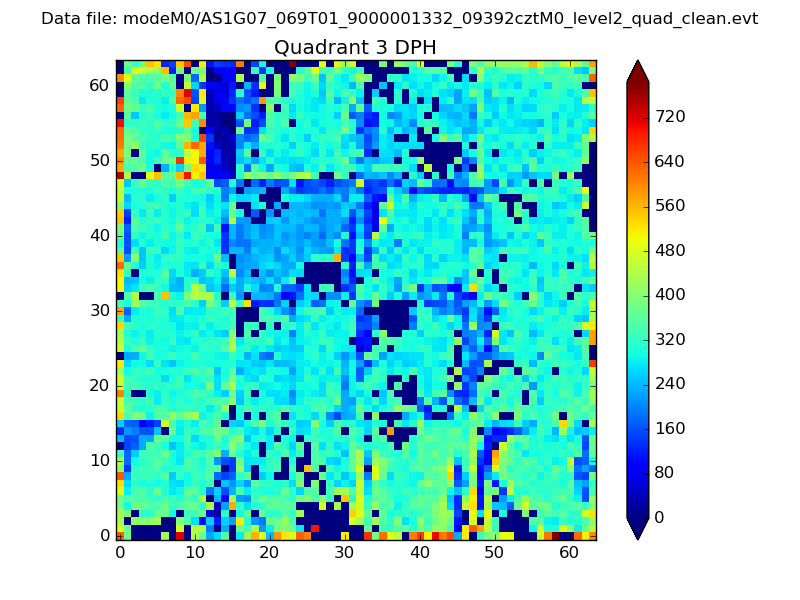 |
 |
Quadrant C |
| Plot type | Count rate plots | Images |
|---|---|---|
| Comparison with Poisson distribution Blue bars denote a histogram of data divided into 1 sec bins. Red curve is a Poisson curve with rate = median count rate of data. |
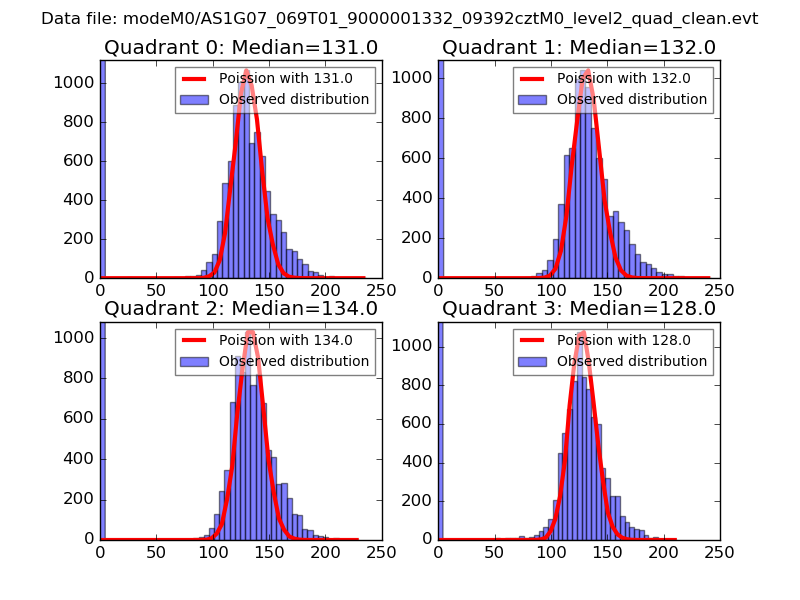 |
 |
| Quadrant-wise count rates Data is divided into 100 sec bins |
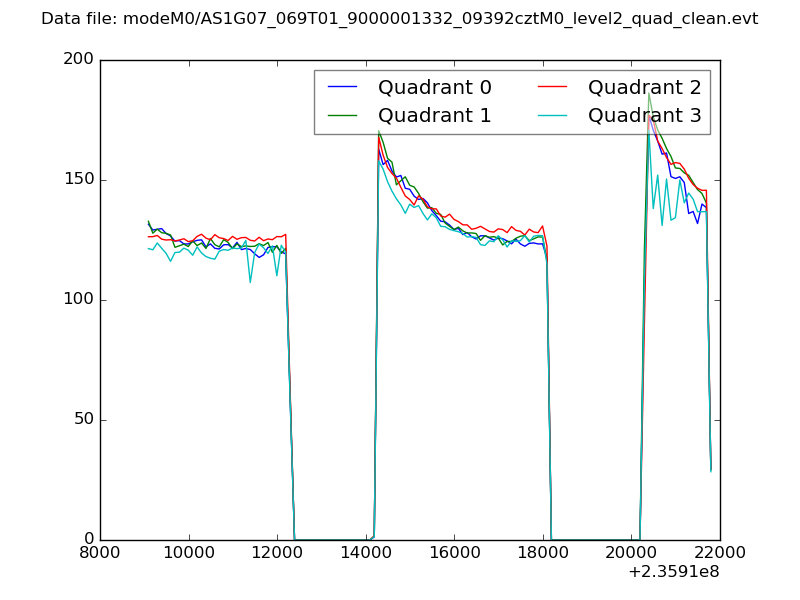 |
|
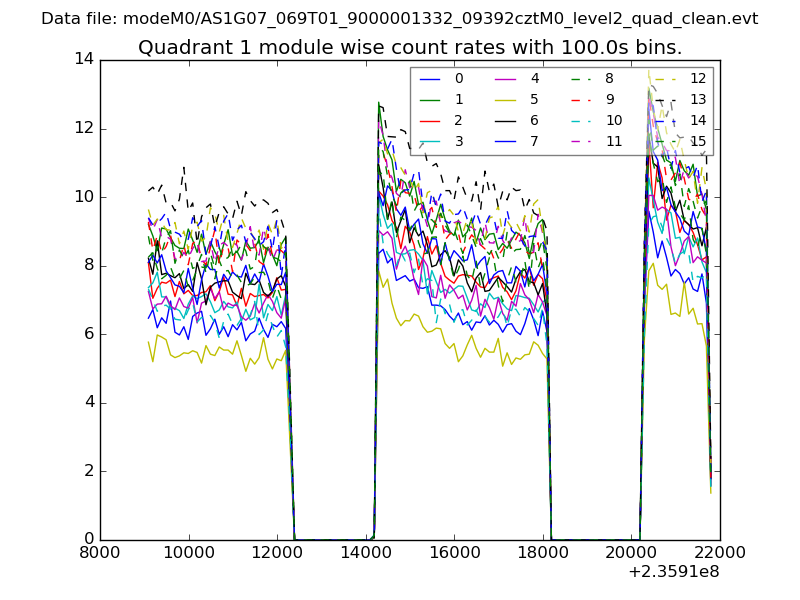
| Module-wise count rates for Quadrant A Data is divided into 100 sec bins |
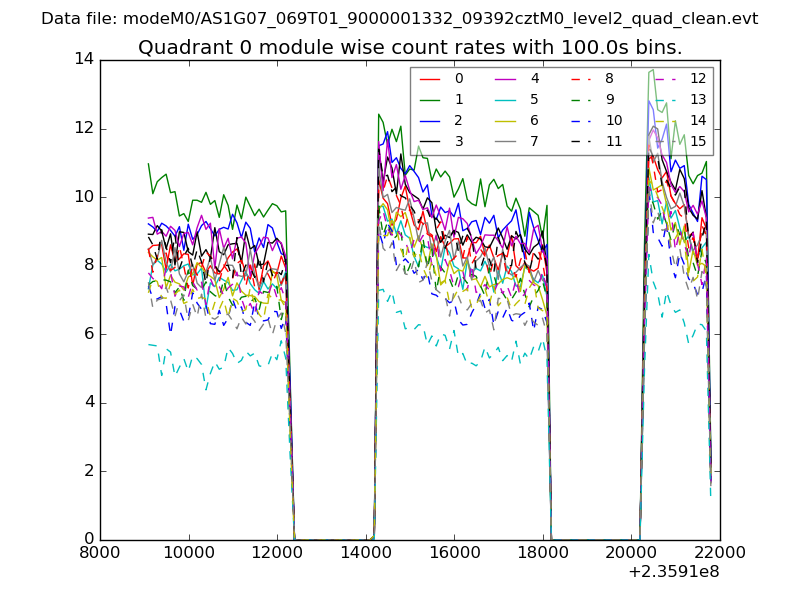 |
 |
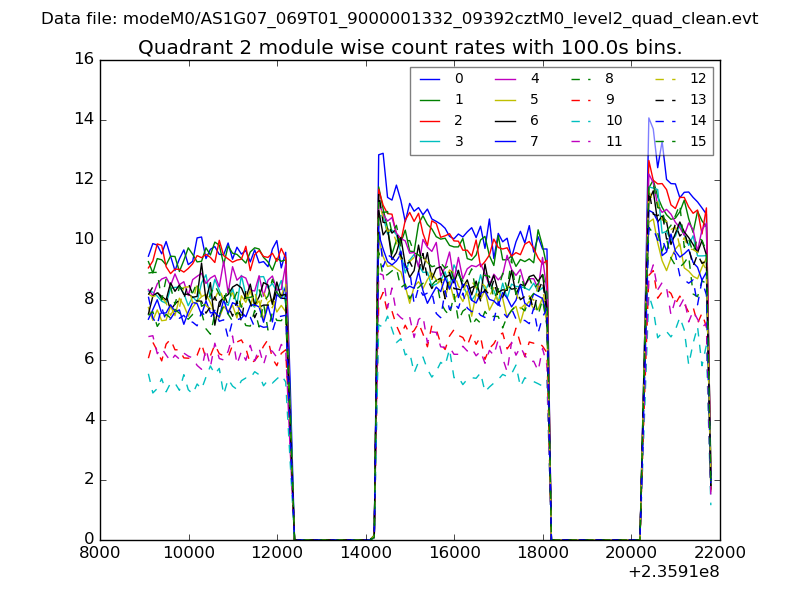
| Module-wise count rates for Quadrant B Data is divided into 100 sec bins |
 |
 |
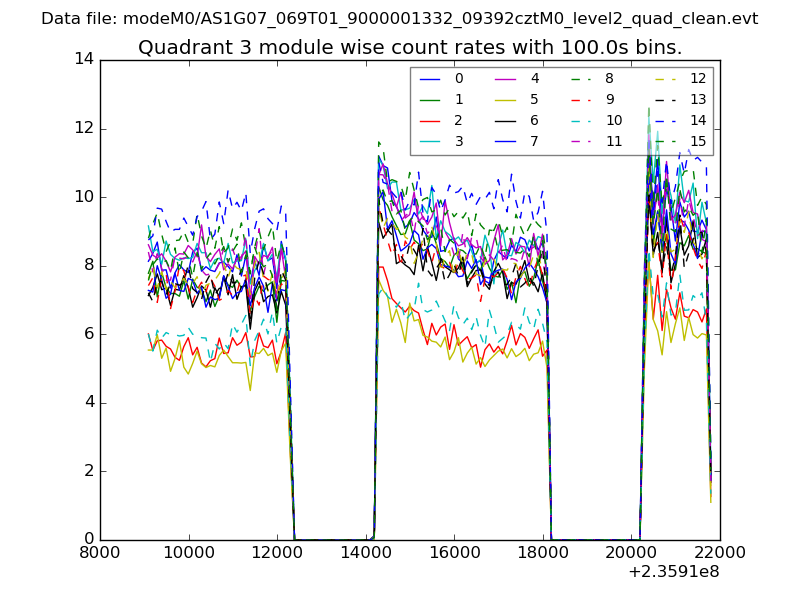
| Module-wise count rates for Quadrant C Data is divided into 100 sec bins |
 |
 |
| Module-wise count rates for Quadrant D Data is divided into 100 sec bins |
 |
 |
| Parameter | Plot |
|---|---|
| CZT HV Monitor | 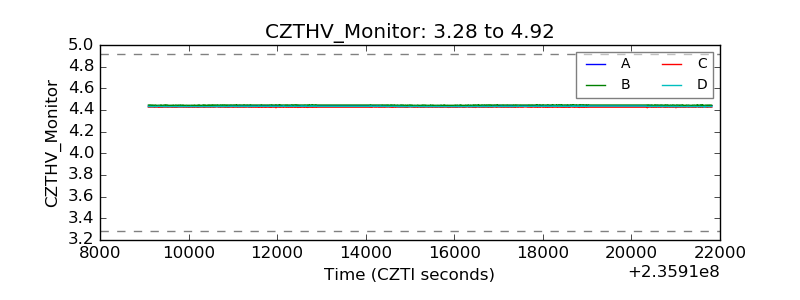 |
| D_VDD |  |
| Temperature 1 | 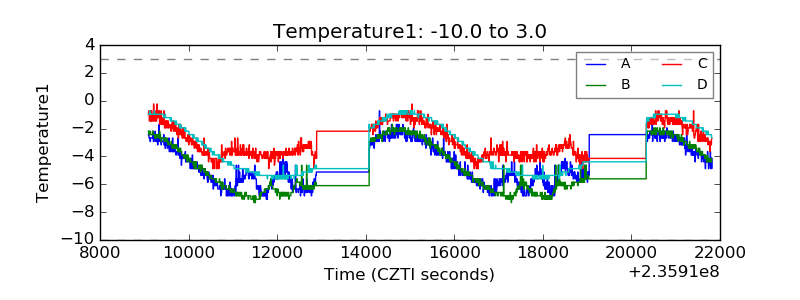 |
| Veto HV Monitor | 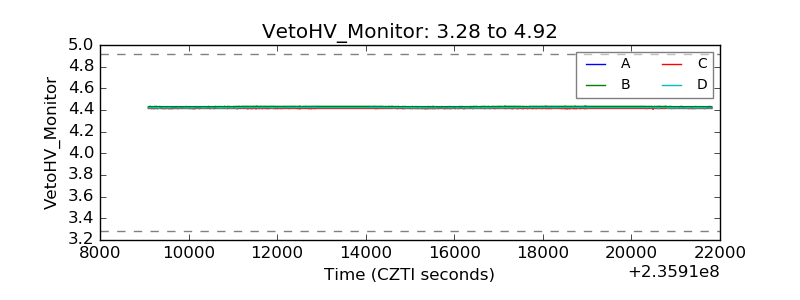 |
| Veto LLD | 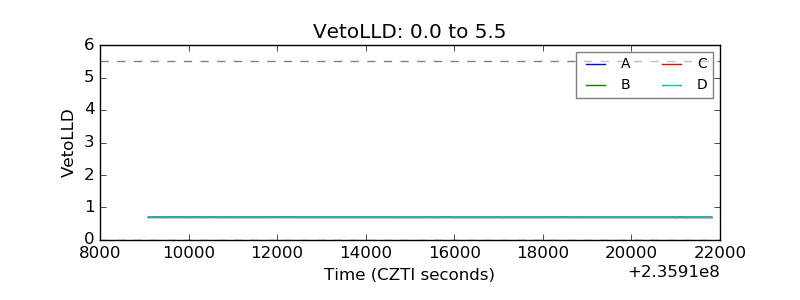 |
| Alpha Counter | 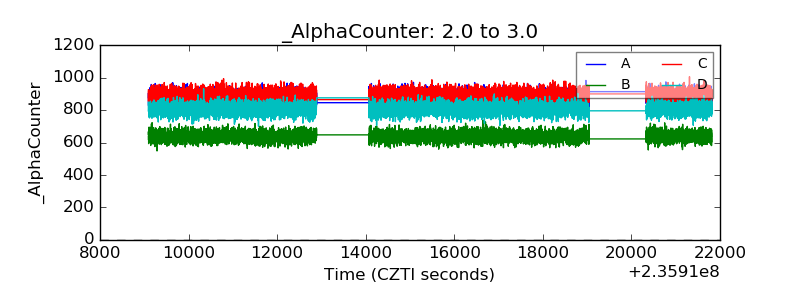 |
| _CPM_Rate | 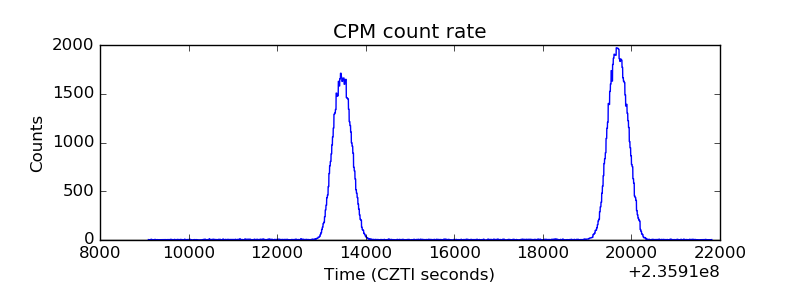 |
| CZT Counter | 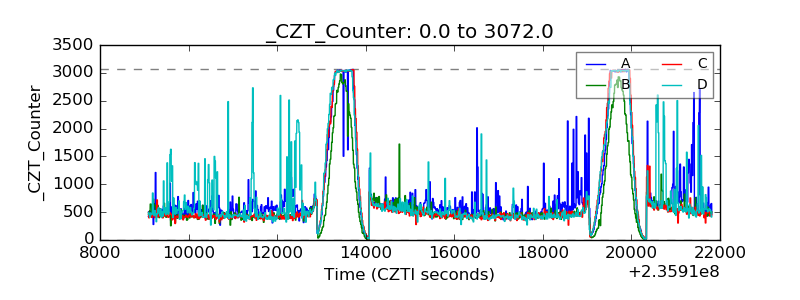 |
| +2.5 Volts monitor |  |
| +5 Volts monitor |  |
| _ROLL_ROT | 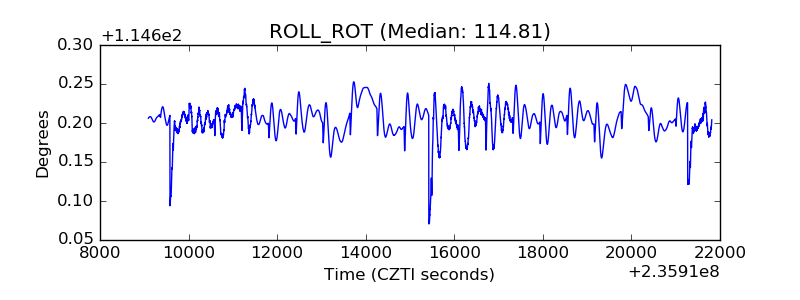 |
| _Roll_DEC | 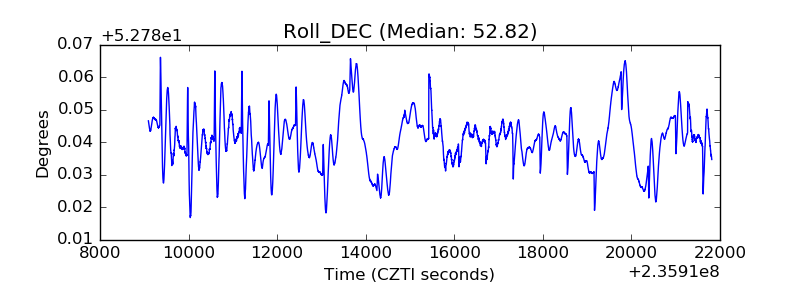 |
| _Roll_RA | 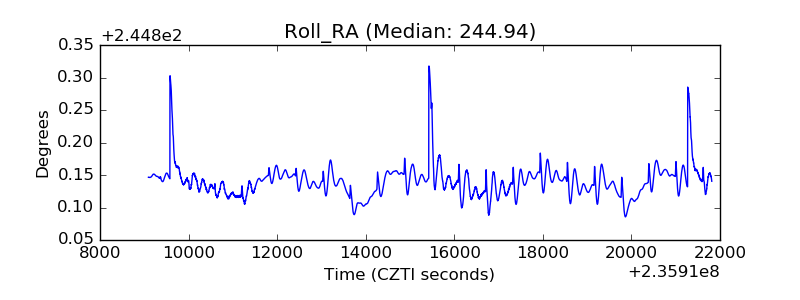 |
| Veto Counter | 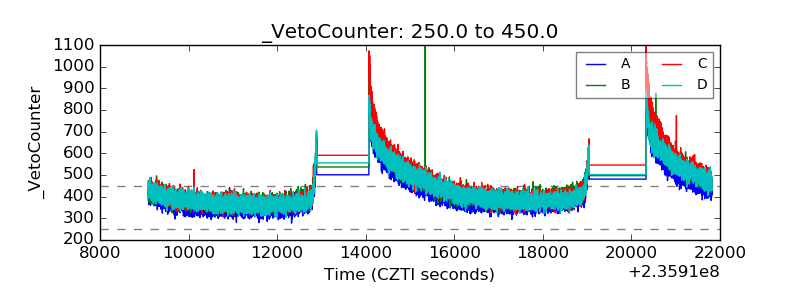 |