| Param | Original file | Final file |
|---|---|---|
| Filename | modeM0/AS1G07_069T01_9000001332_09393cztM0_level2.evt | modeM0/AS1G07_069T01_9000001332_09393cztM0_level2_quad_clean.evt |
| Size (bytes) | 480,199,680 | 102,191,040 |
| Size | 458.0 MB | 97.5 MB |
| Events in quadrant A | 4,128,145 | 664,498 |
| Events in quadrant B | 3,002,427 | 681,751 |
| Events in quadrant C | 3,138,526 | 685,648 |
| Events in quadrant D | 3,867,551 | 644,982 |
| Mode M0 | |||
|---|---|---|---|
| Quadrant | BADHDUFLAG | Total packets | Discarded packets |
| A | 0 | 16316 | 2 |
| B | 0 | 12876 | 1 |
| C | 0 | 13231 | 1 |
| D | 0 | 15381 | 1 |
| Mode SS | |||
|---|---|---|---|
| Quadrant | BADHDUFLAG | Total packets | Discarded packets |
| A | 0 | 120 | 0 |
| B | 0 | 120 | 0 |
| C | 0 | 120 | 0 |
| D | 0 | 120 | 0 |
| Mode M9 | |||
|---|---|---|---|
| Quadrant | BADHDUFLAG | Total packets | Discarded packets |
| A | 0 | 13 | 0 |
| B | 0 | 13 | 0 |
| C | 0 | 13 | 0 |
| D | 0 | 13 | 0 |
| Quadrant | Total seconds | Saturated seconds | Saturation percentage |
|---|---|---|---|
| A | 5989 | 213 | 3.556520% |
| B | 5989 | 66 | 1.102020% |
| C | 5989 | 124 | 2.070463% |
| D | 5989 | 362 | 6.044415% |
Noise dominated data is calculated using 1-second bins in cleaned event files. If a bin has >2000 counts, and if more than 50% of those come from <1% of pixels, then it is considered to be noise-dominated and hence unusable.
| Quadrant | # 1 sec bins | Bins with >0 counts | Bins with >2000 counts | High rate bins dominated by noise | Noise dominated (total time) | Noise dominated (detector-on time) | Marked lightcurve |
|---|---|---|---|---|---|---|---|
| A | 7284 | 5990 | 89 | 89 | 1.22% | 1.49% | 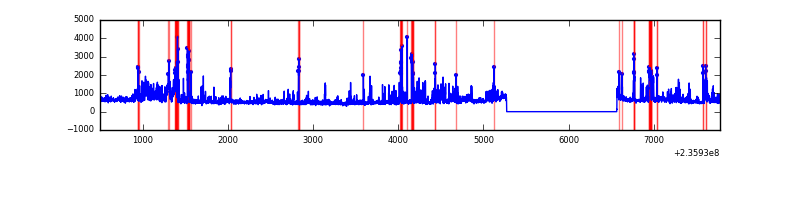 |
| B | 7284 | 5990 | 0 | 0 | 0.00% | 0.00% | 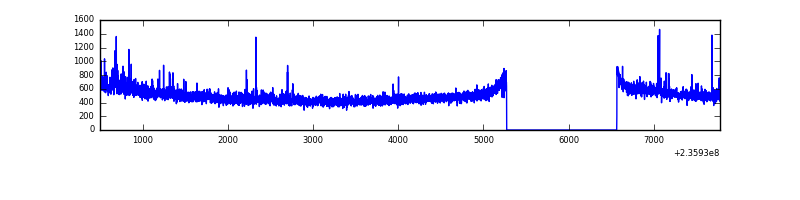 |
| C | 7284 | 5990 | 29 | 29 | 0.40% | 0.48% | 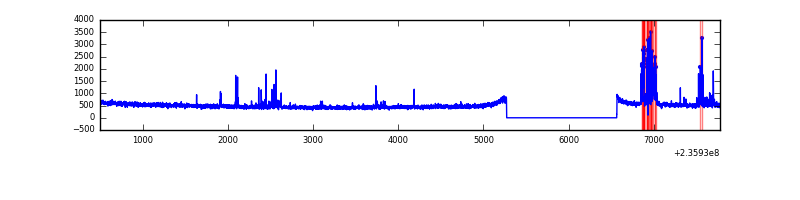 |
| D | 7284 | 5990 | 240 | 240 | 3.29% | 4.01% | 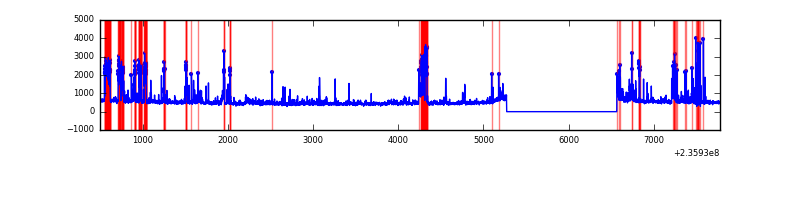 |
Top three noisy pixels from each quadrant. If the there are fewer than three noisy pixels in the level2.evt file, extra rows are filled as -1
| Pixel properties | Quadrant properties | ||||||
|---|---|---|---|---|---|---|---|
| Quadrant | DetID | PixID | Counts | Sigma | Mean | Median | Sigma |
| A | 8 | 5 | 1238711 | 8321.62 | 740 | 726 | 148.8 |
| A | 5 | 16 | 17350 | 111.75 | 740 | 726 | 148.8 |
| A | 1 | 162 | 11667 | 73.54 | 740 | 726 | 148.8 |
| B | 0 | 214 | 52537 | 375.66 | 749 | 731 | 137.9 |
| B | 12 | 111 | 14446 | 99.45 | 749 | 731 | 137.9 |
| B | 11 | 111 | 11561 | 78.53 | 749 | 731 | 137.9 |
| C | 4 | 254 | 194614 | 1156.27 | 741 | 747 | 167.7 |
| C | 14 | 234 | 47693 | 280.0 | 741 | 747 | 167.7 |
| C | 13 | 61 | 5507 | 28.39 | 741 | 747 | 167.7 |
| D | 1 | 52 | 457032 | 2489.72 | 722 | 707 | 183.3 |
| D | 9 | 64 | 195241 | 1061.38 | 722 | 707 | 183.3 |
| D | 7 | 71 | 169159 | 919.08 | 722 | 707 | 183.3 |
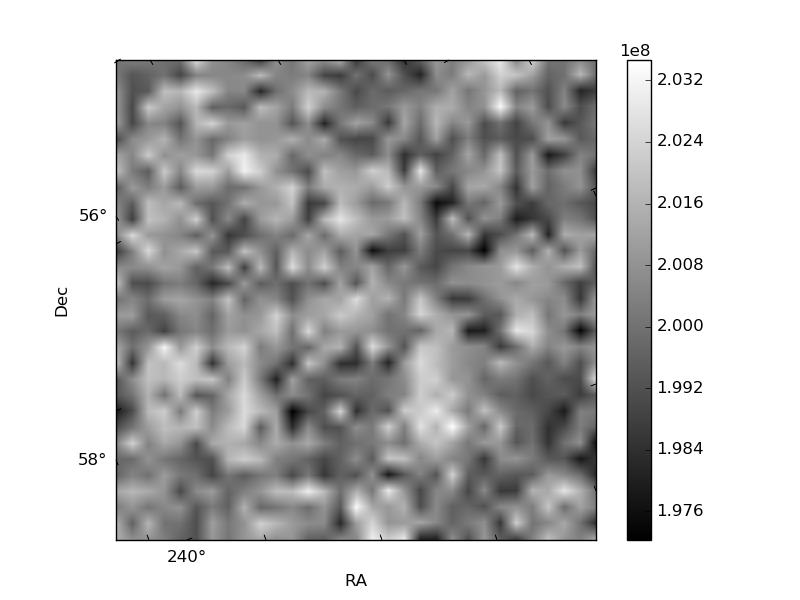
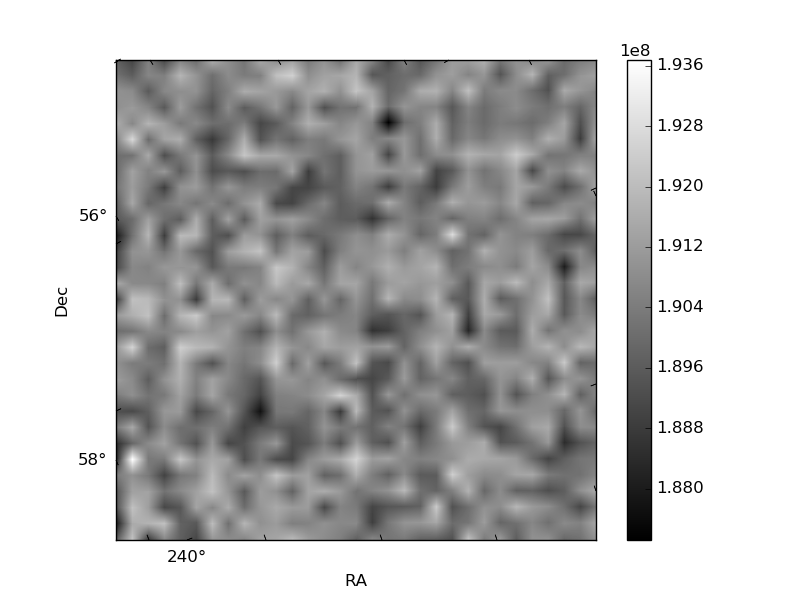
Histogram calculated using DETX and DETY for each event in the final _common_clean file
| Quadrant A |  |
 |
Quadrant B |
|---|---|---|---|
| Quadrant D |  |
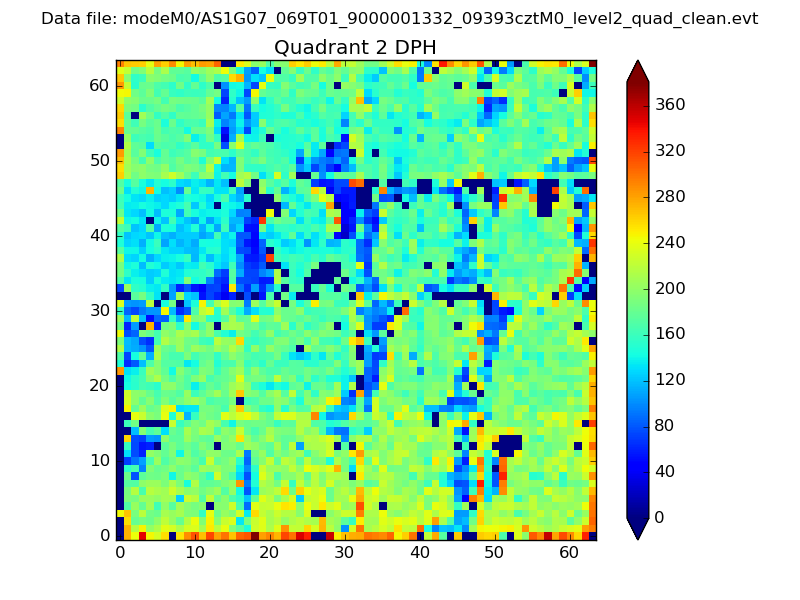 |
Quadrant C |
| Plot type | Count rate plots | Images |
|---|---|---|
| Comparison with Poisson distribution Blue bars denote a histogram of data divided into 1 sec bins. Red curve is a Poisson curve with rate = median count rate of data. |
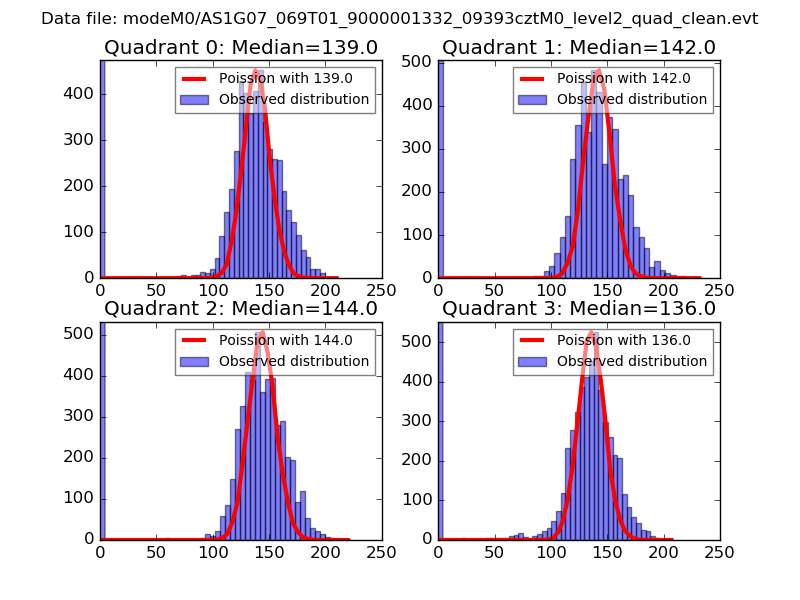 |
 |
| Quadrant-wise count rates Data is divided into 100 sec bins |
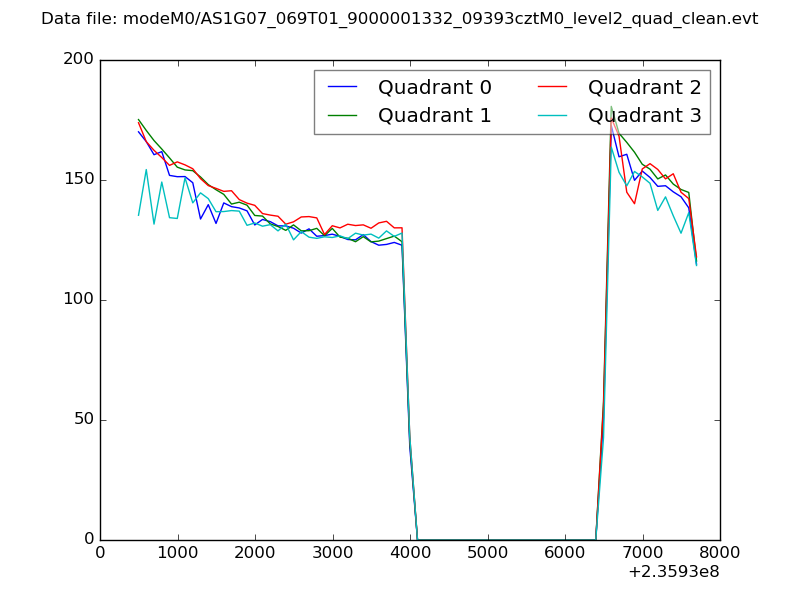 |
|
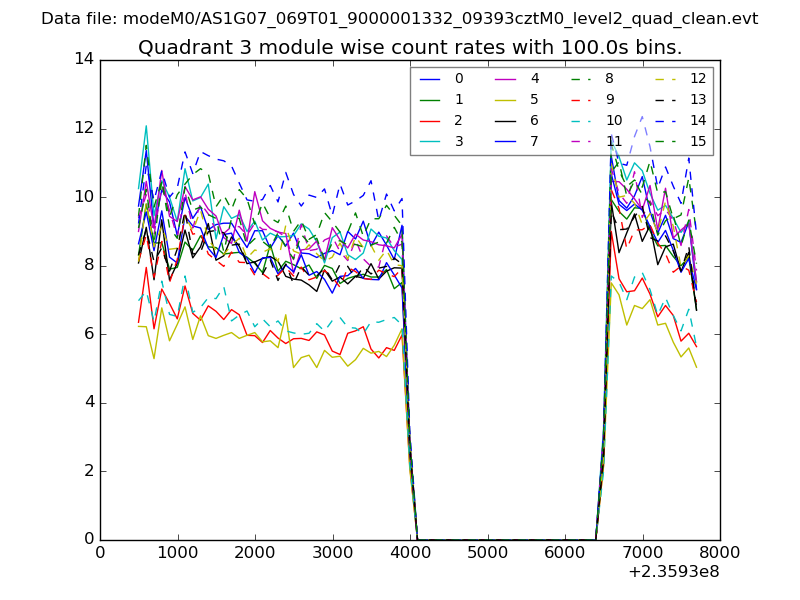
| Module-wise count rates for Quadrant A Data is divided into 100 sec bins |
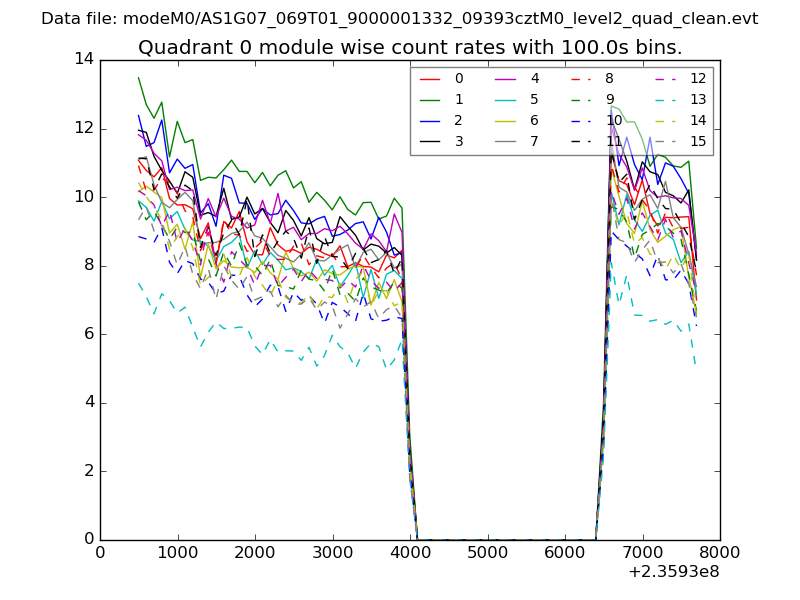 |
 |
| Module-wise count rates for Quadrant B Data is divided into 100 sec bins |
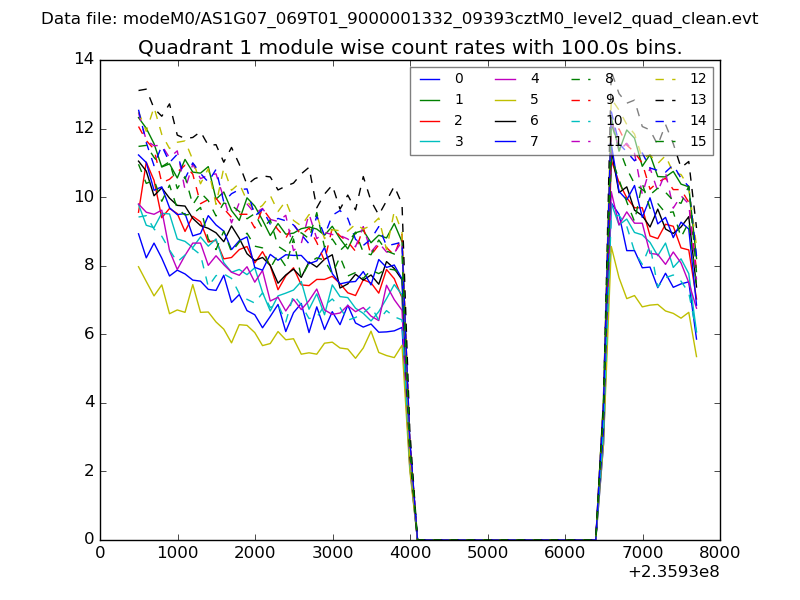 |
 |
| Module-wise count rates for Quadrant C Data is divided into 100 sec bins |
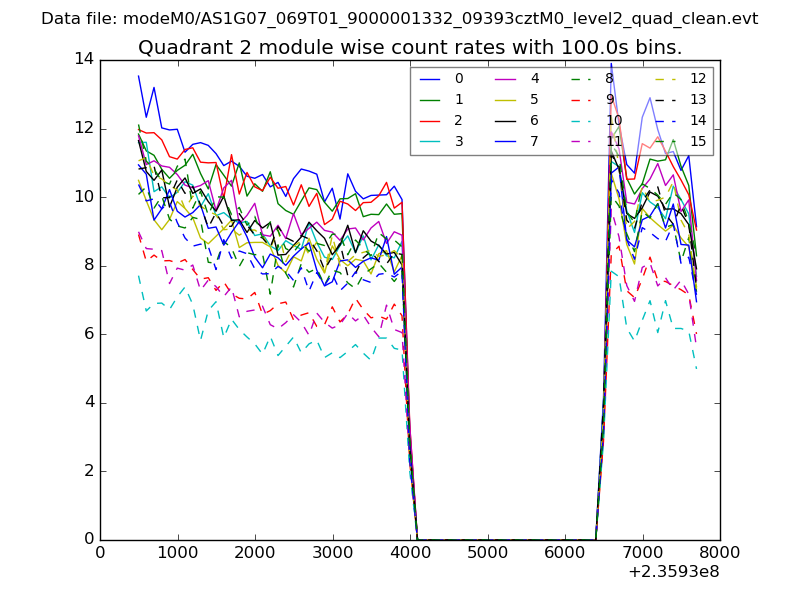 |
 |
| Module-wise count rates for Quadrant D Data is divided into 100 sec bins |
 |
 |
| Parameter | Plot |
|---|---|
| CZT HV Monitor | 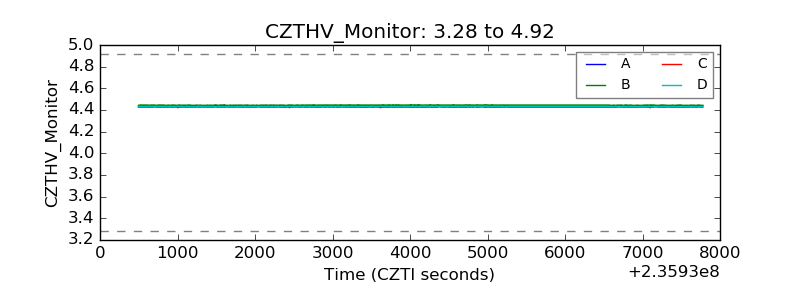 |
| D_VDD | 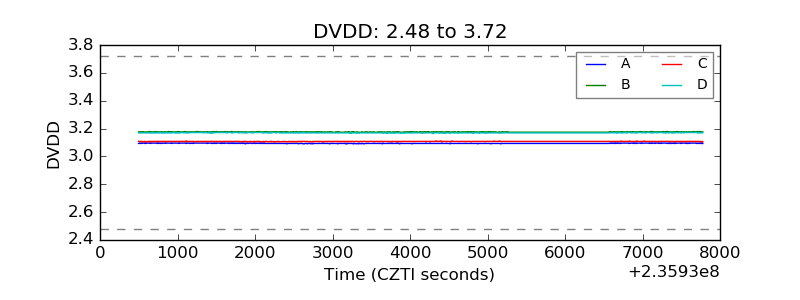 |
| Temperature 1 | 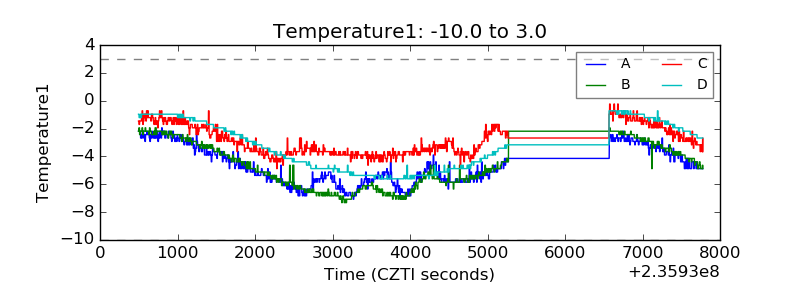 |
| Veto HV Monitor | 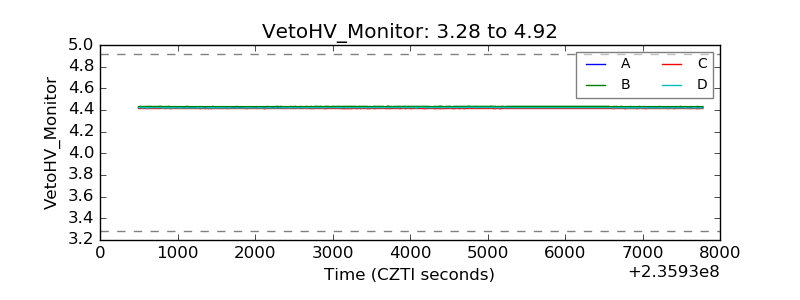 |
| Veto LLD | 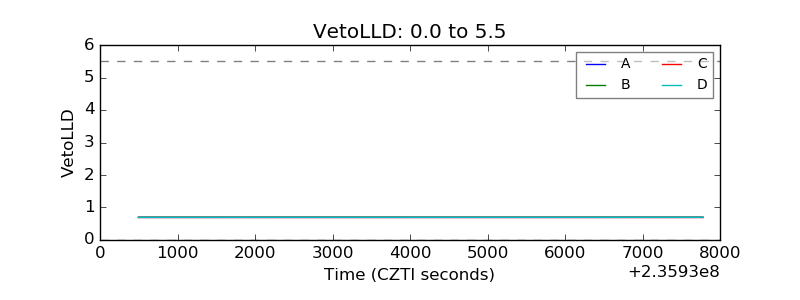 |
| Alpha Counter | 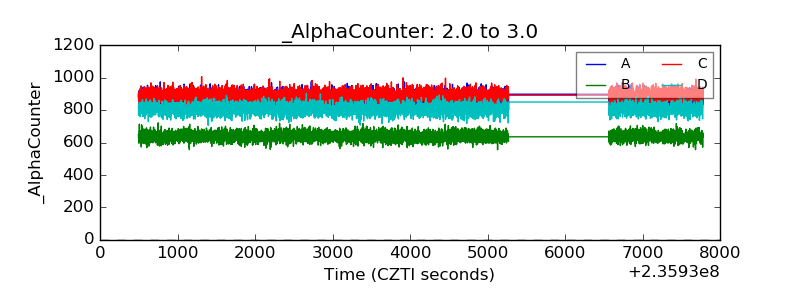 |
| _CPM_Rate | 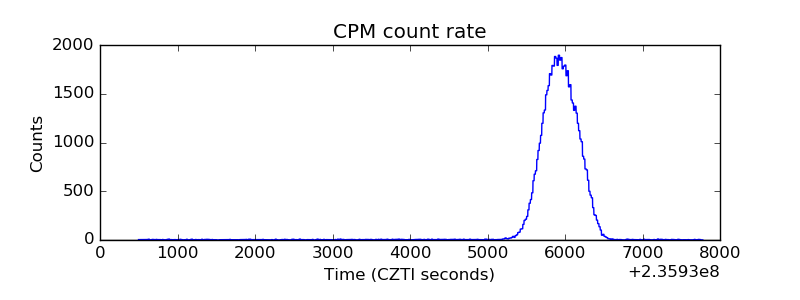 |
| CZT Counter |  |
| +2.5 Volts monitor |  |
| +5 Volts monitor |  |
| _ROLL_ROT | 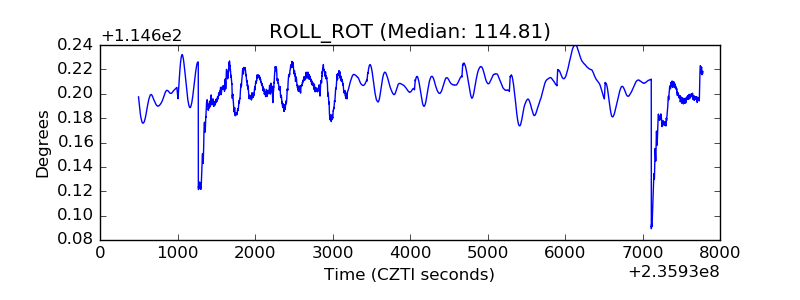 |
| _Roll_DEC | 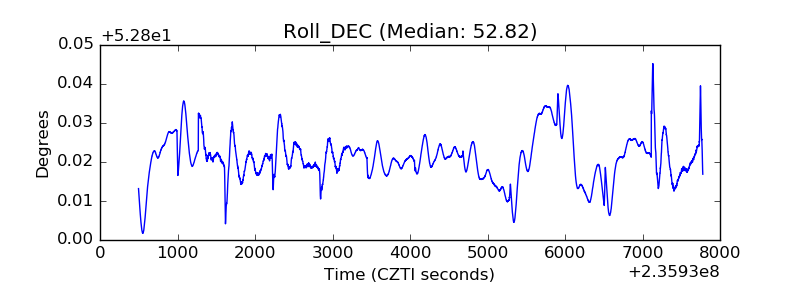 |
| _Roll_RA | 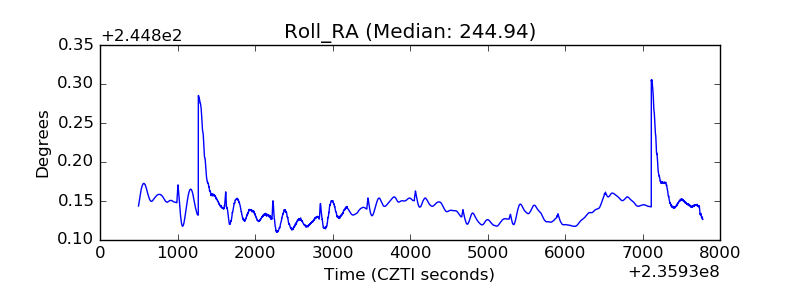 |
| Veto Counter | 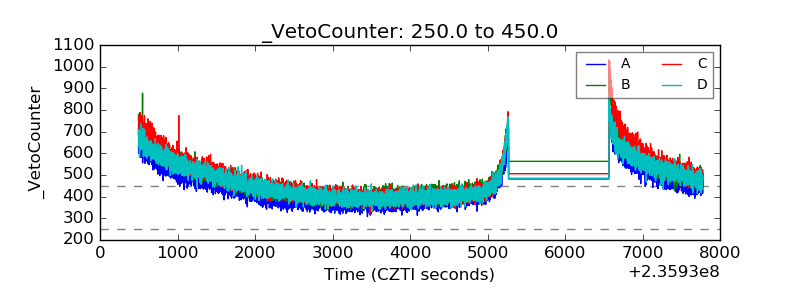 |