| Param | Original file | Final file |
|---|---|---|
| Filename | modeM0/AS1G07_069T01_9000001332_09394cztM0_level2.evt | modeM0/AS1G07_069T01_9000001332_09394cztM0_level2_quad_clean.evt |
| Size (bytes) | 469,612,800 | 98,568,000 |
| Size | 447.9 MB | 94.0 MB |
| Events in quadrant A | 4,066,927 | 629,577 |
| Events in quadrant B | 3,110,801 | 645,537 |
| Events in quadrant C | 3,223,116 | 653,961 |
| Events in quadrant D | 3,396,647 | 619,633 |
| Mode M0 | |||
|---|---|---|---|
| Quadrant | BADHDUFLAG | Total packets | Discarded packets |
| A | 0 | 16374 | 8 |
| B | 0 | 13383 | 4 |
| C | 0 | 13730 | 2 |
| D | 0 | 14392 | 2 |
| Mode SS | |||
|---|---|---|---|
| Quadrant | BADHDUFLAG | Total packets | Discarded packets |
| A | 0 | 128 | 0 |
| B | 0 | 128 | 0 |
| C | 0 | 128 | 0 |
| D | 0 | 128 | 0 |
| Mode M9 | |||
|---|---|---|---|
| Quadrant | BADHDUFLAG | Total packets | Discarded packets |
| A | 0 | 17 | 0 |
| B | 0 | 17 | 0 |
| C | 0 | 17 | 0 |
| D | 0 | 18 | 0 |
| Quadrant | Total seconds | Saturated seconds | Saturation percentage |
|---|---|---|---|
| A | 6249 | 118 | 1.888302% |
| B | 6250 | 49 | 0.784000% |
| C | 6251 | 92 | 1.471765% |
| D | 6251 | 149 | 2.383619% |
Noise dominated data is calculated using 1-second bins in cleaned event files. If a bin has >2000 counts, and if more than 50% of those come from <1% of pixels, then it is considered to be noise-dominated and hence unusable.
| Quadrant | # 1 sec bins | Bins with >0 counts | Bins with >2000 counts | High rate bins dominated by noise | Noise dominated (total time) | Noise dominated (detector-on time) | Marked lightcurve |
|---|---|---|---|---|---|---|---|
| A | 7566 | 6251 | 59 | 59 | 0.78% | 0.94% | 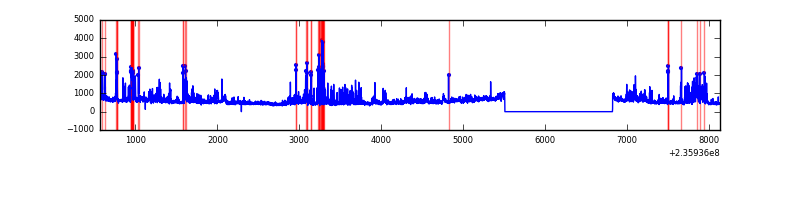 |
| B | 7566 | 6252 | 1 | 1 | 0.01% | 0.02% | 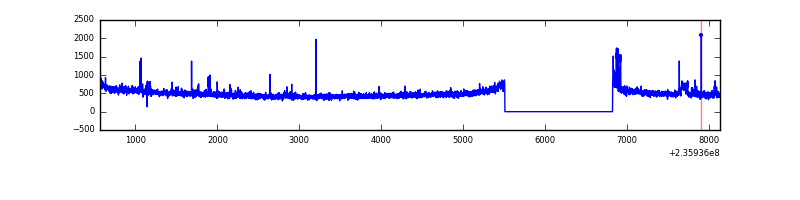 |
| C | 7566 | 6252 | 32 | 32 | 0.42% | 0.51% |  |
| D | 7566 | 6252 | 70 | 70 | 0.93% | 1.12% | 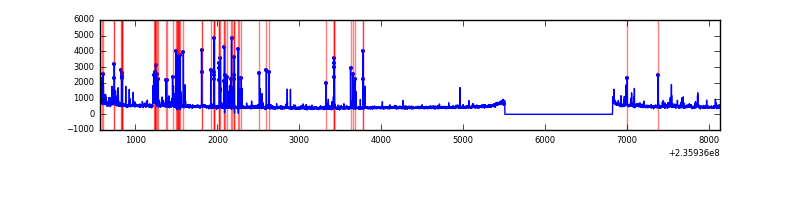 |
Top three noisy pixels from each quadrant. If the there are fewer than three noisy pixels in the level2.evt file, extra rows are filled as -1
| Pixel properties | Quadrant properties | ||||||
|---|---|---|---|---|---|---|---|
| Quadrant | DetID | PixID | Counts | Sigma | Mean | Median | Sigma |
| A | 8 | 5 | 967341 | 6336.96 | 758 | 743 | 152.5 |
| A | 5 | 16 | 160111 | 1044.81 | 758 | 743 | 152.5 |
| A | 1 | 162 | 9536 | 57.65 | 758 | 743 | 152.5 |
| B | 5 | 174 | 59509 | 412.55 | 768 | 751 | 142.4 |
| B | 0 | 214 | 30584 | 209.46 | 768 | 751 | 142.4 |
| B | 12 | 111 | 15101 | 100.75 | 768 | 751 | 142.4 |
| C | 4 | 254 | 251929 | 1449.85 | 759 | 764 | 173.2 |
| C | 13 | 61 | 5736 | 28.7 | 759 | 764 | 173.2 |
| C | 14 | 234 | 5392 | 26.72 | 759 | 764 | 173.2 |
| D | 1 | 52 | 309407 | 1623.98 | 745 | 727 | 190.1 |
| D | 12 | 233 | 127938 | 669.26 | 745 | 727 | 190.1 |
| D | 7 | 71 | 63910 | 332.41 | 745 | 727 | 190.1 |
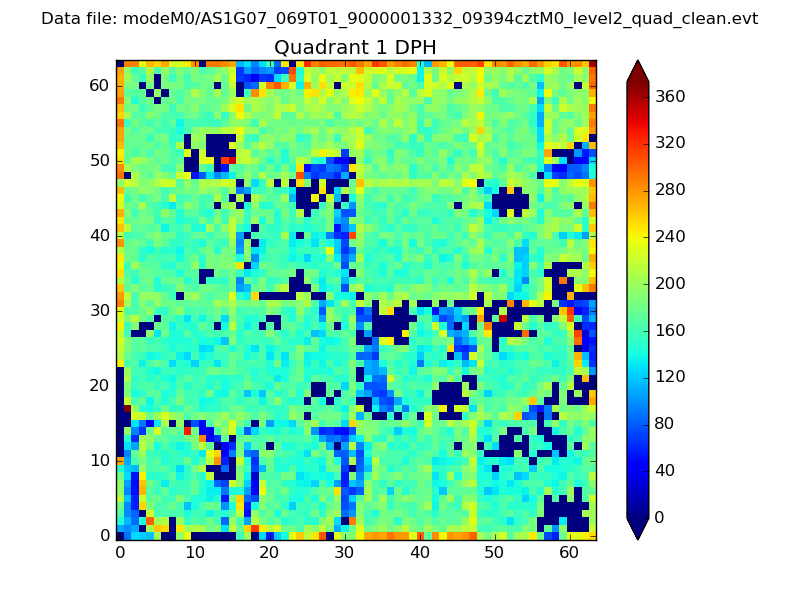
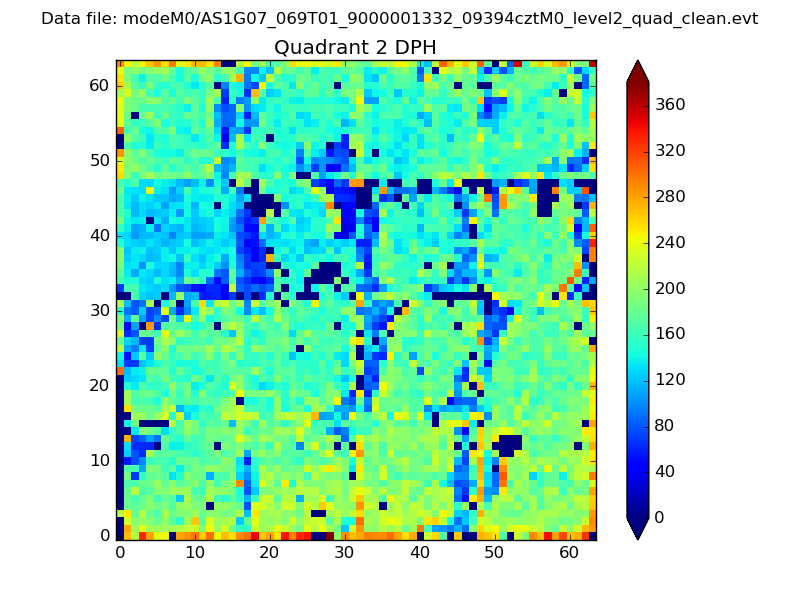
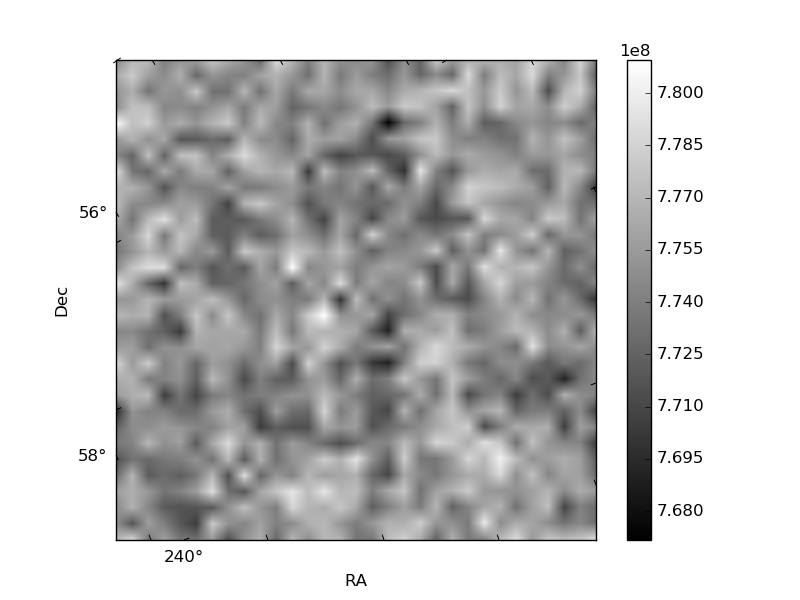
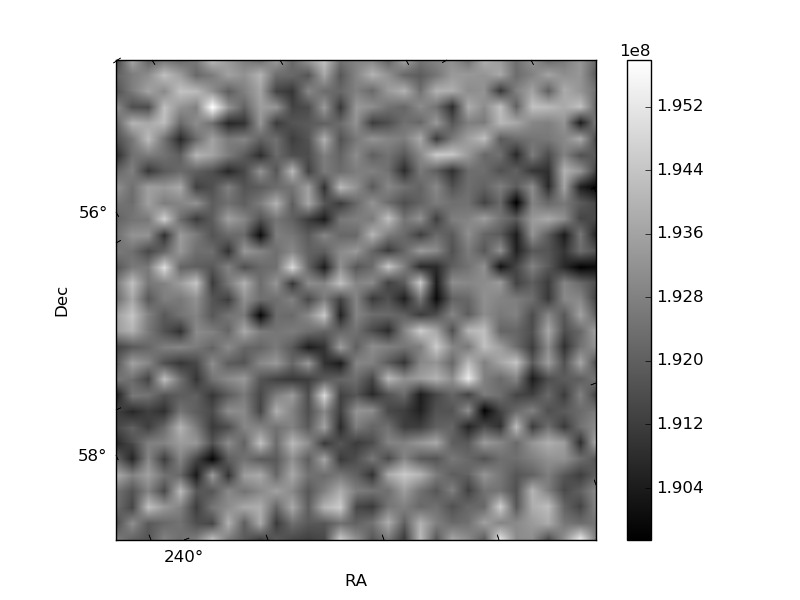
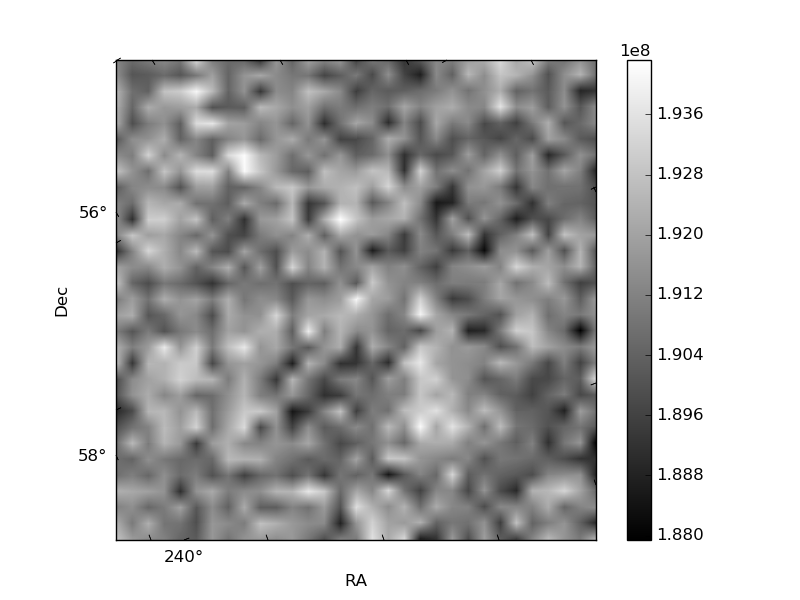
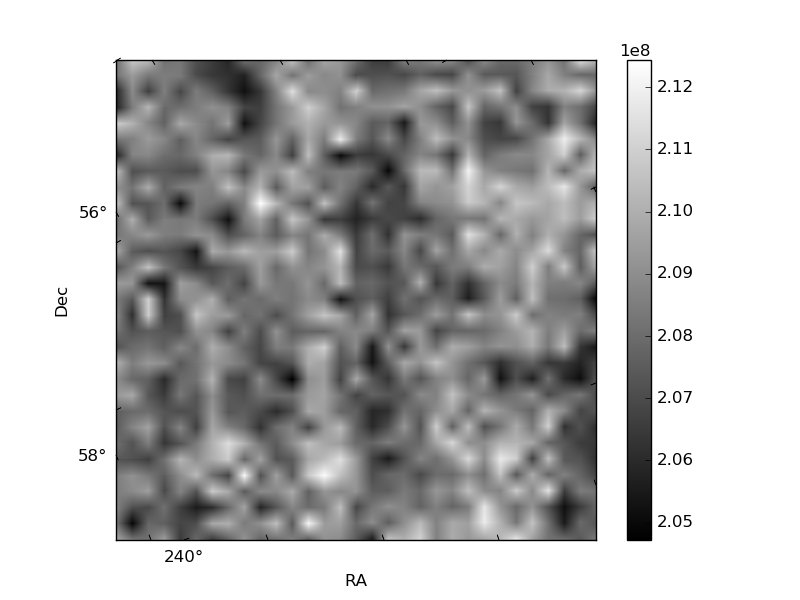
Histogram calculated using DETX and DETY for each event in the final _common_clean file
| Quadrant A | 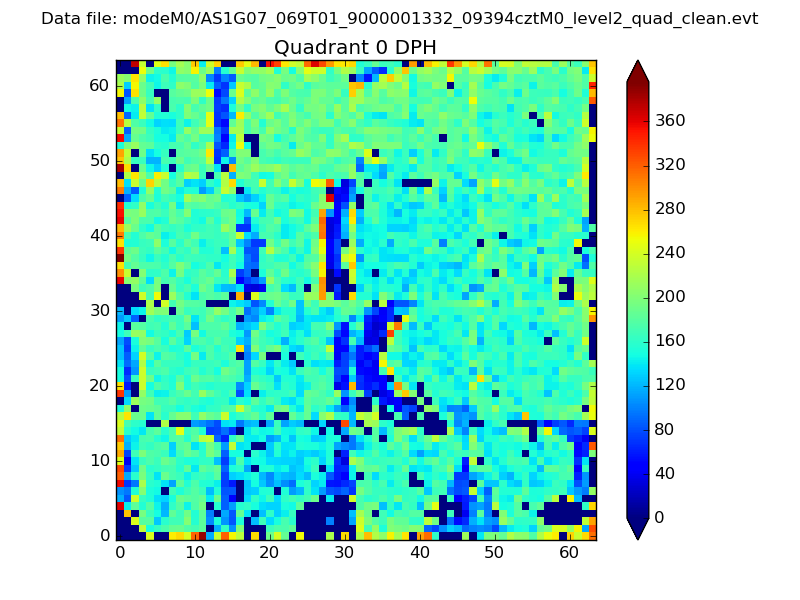 |
 |
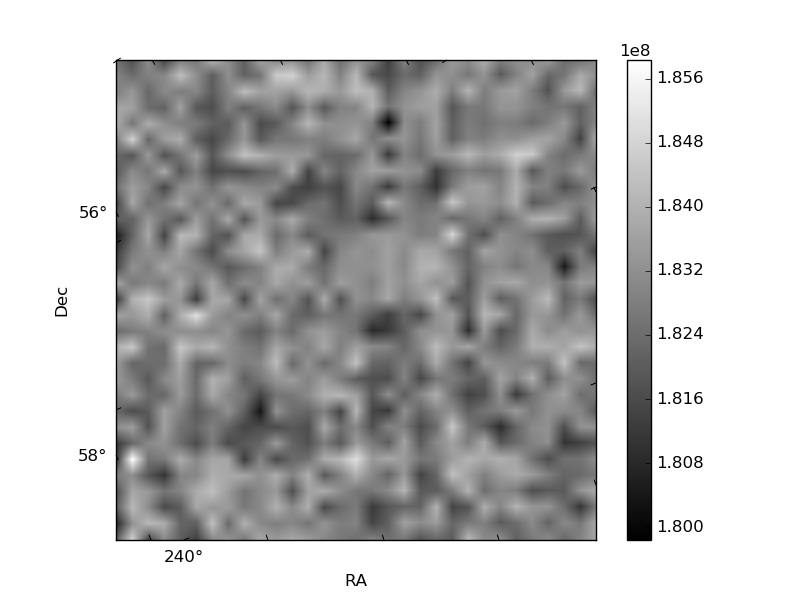
Quadrant B |
|---|---|---|---|
| Quadrant D | 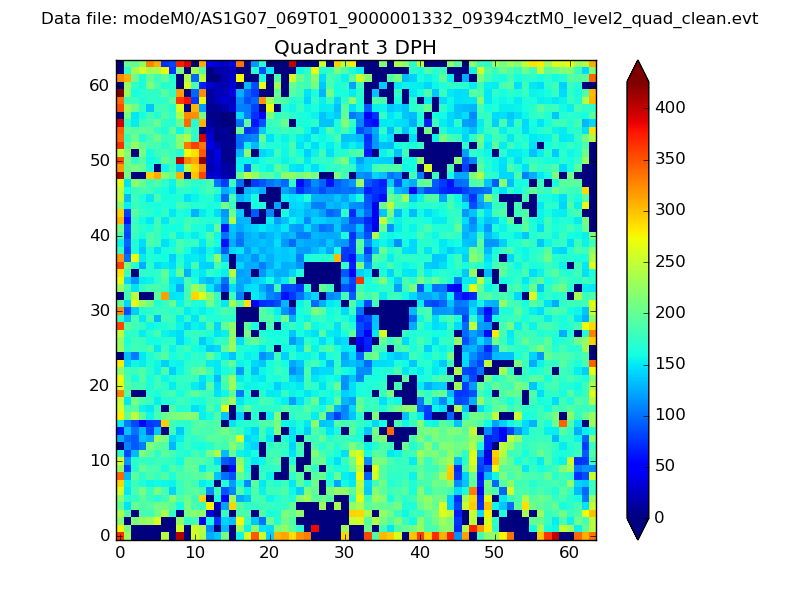 |
 |
Quadrant C |
| Plot type | Count rate plots | Images |
|---|---|---|
| Comparison with Poisson distribution Blue bars denote a histogram of data divided into 1 sec bins. Red curve is a Poisson curve with rate = median count rate of data. |
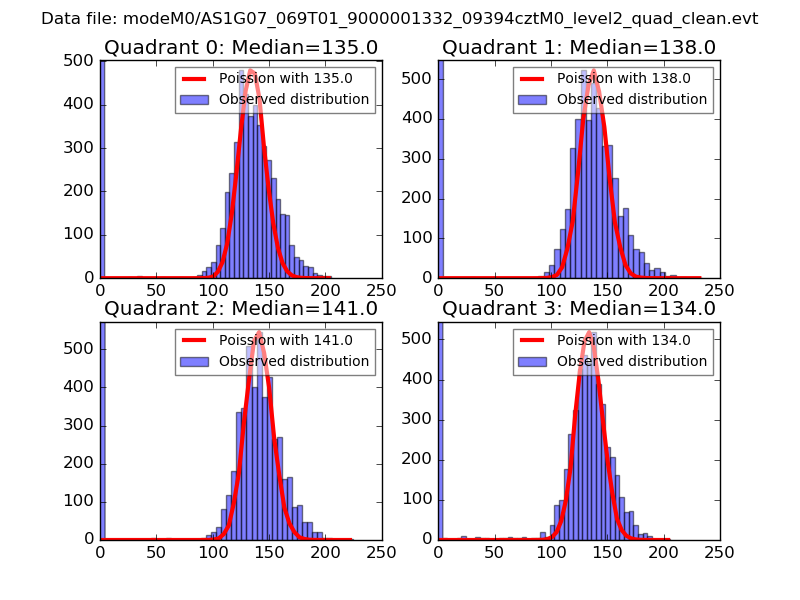 |
 |
| Quadrant-wise count rates Data is divided into 100 sec bins |
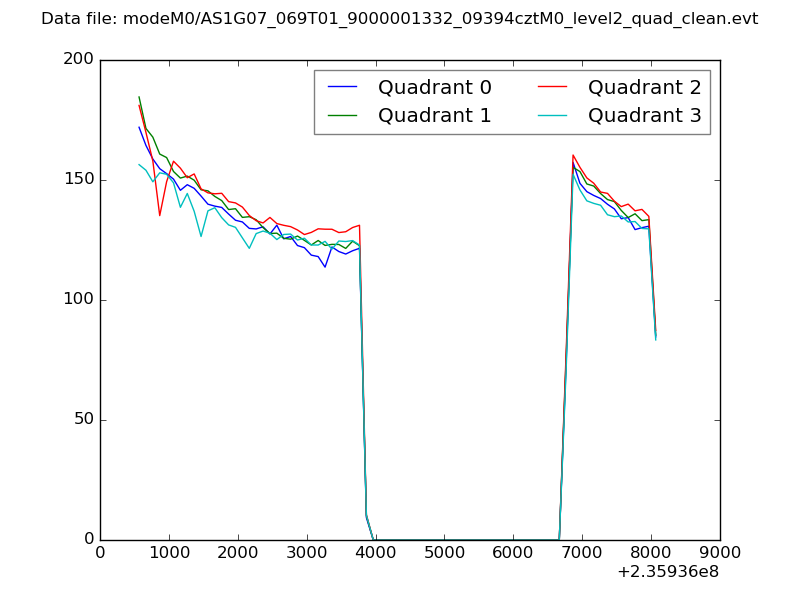 |
|
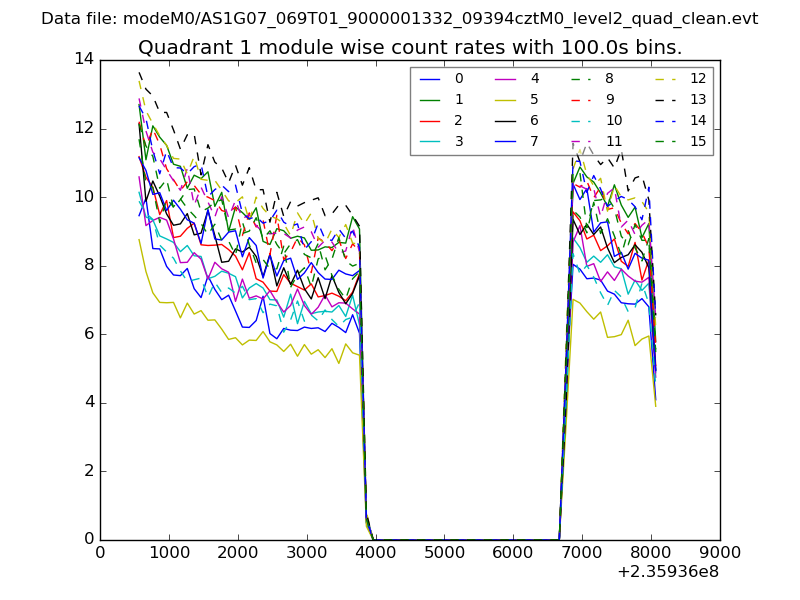
| Module-wise count rates for Quadrant A Data is divided into 100 sec bins |
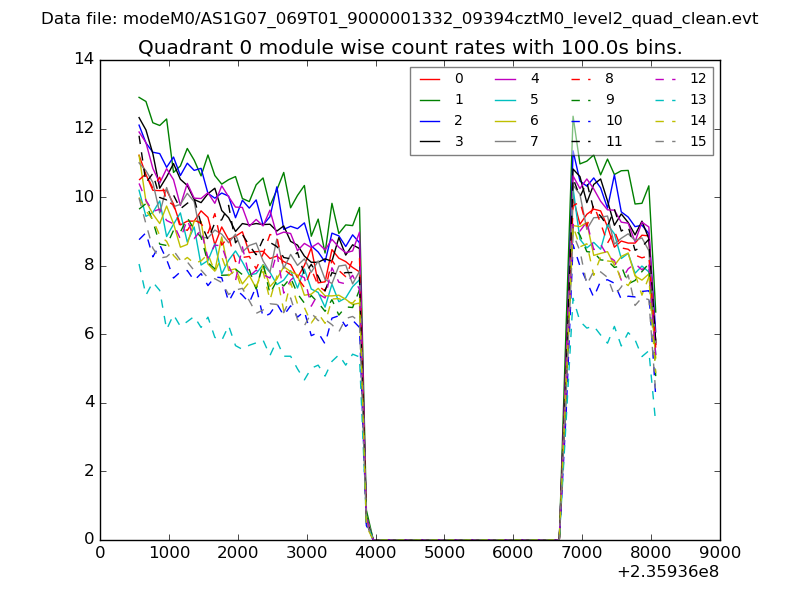 |
 |
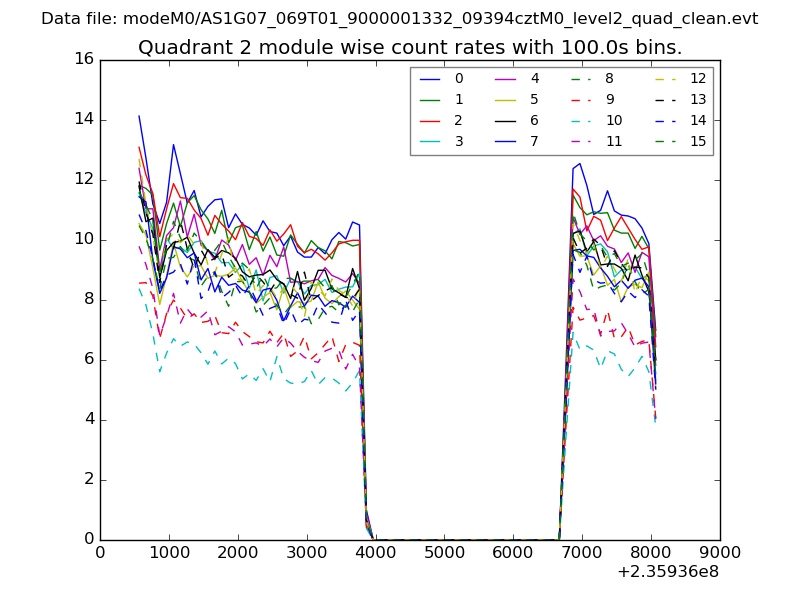
| Module-wise count rates for Quadrant B Data is divided into 100 sec bins |
 |
 |
| Module-wise count rates for Quadrant C Data is divided into 100 sec bins |
 |
 |
| Module-wise count rates for Quadrant D Data is divided into 100 sec bins |
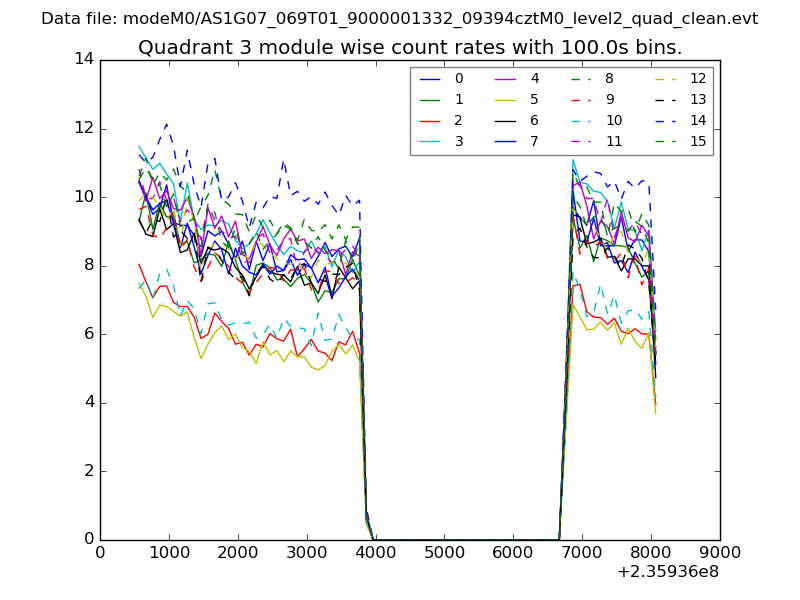 |
 |
| Parameter | Plot |
|---|---|
| CZT HV Monitor | 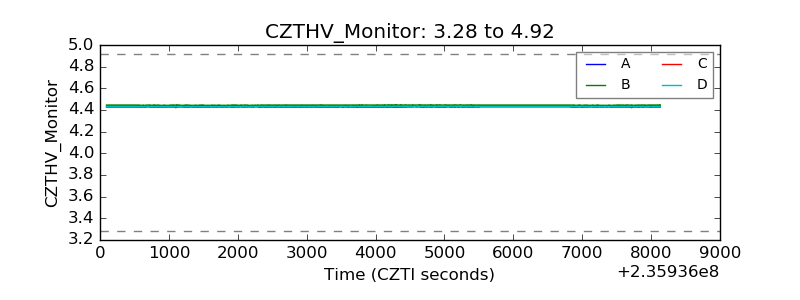 |
| D_VDD | 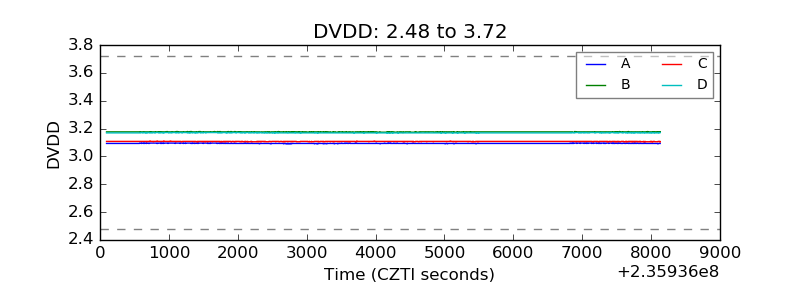 |
| Temperature 1 | 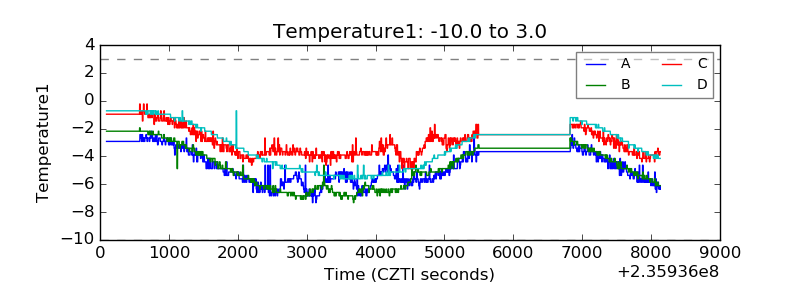 |
| Veto HV Monitor | 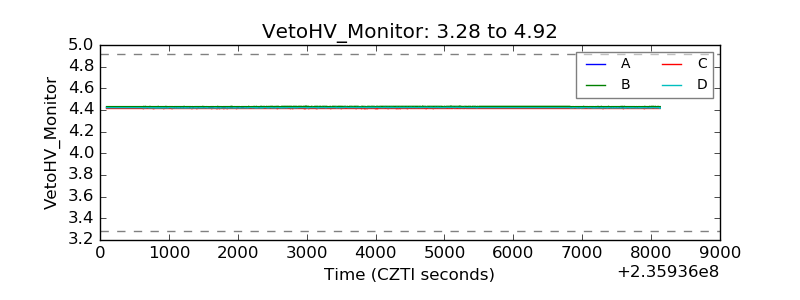 |
| Veto LLD | 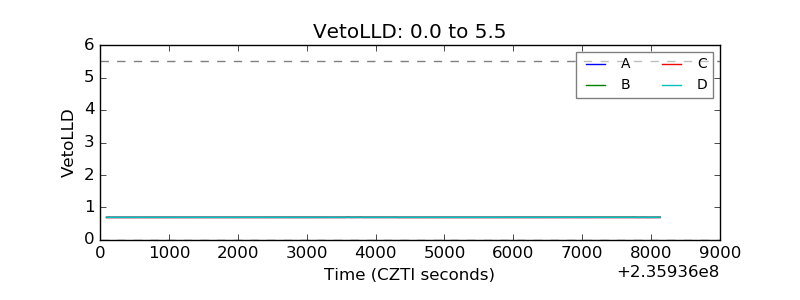 |
| Alpha Counter | 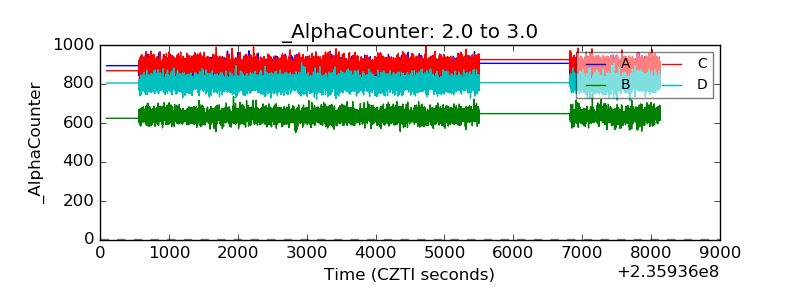 |
| _CPM_Rate | 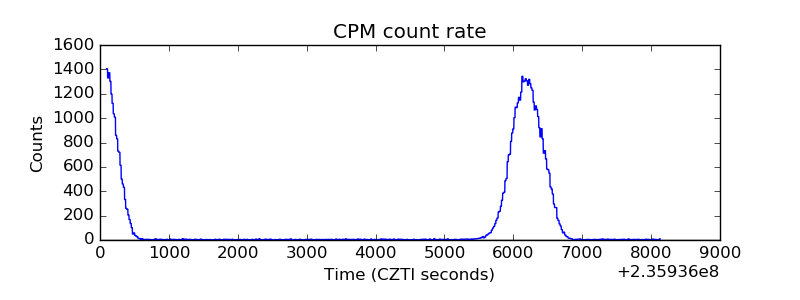 |
| CZT Counter | 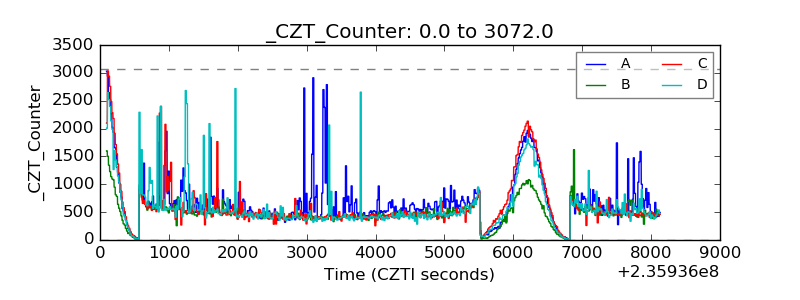 |
| +2.5 Volts monitor |  |
| +5 Volts monitor |  |
| _ROLL_ROT | 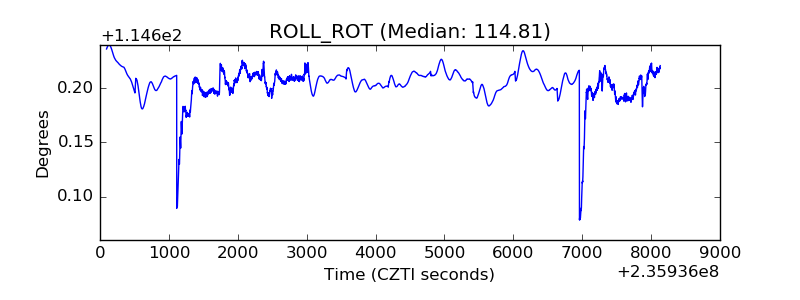 |
| _Roll_DEC | 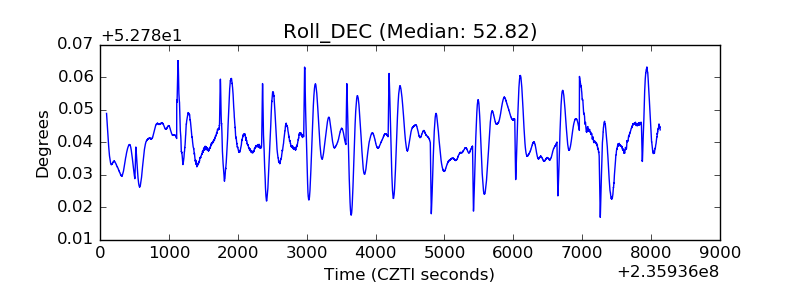 |
| _Roll_RA | 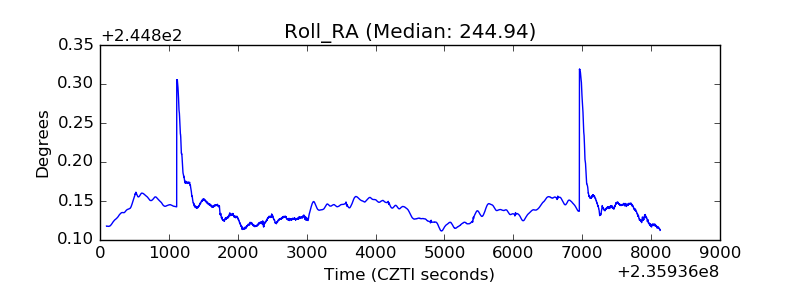 |
| Veto Counter | 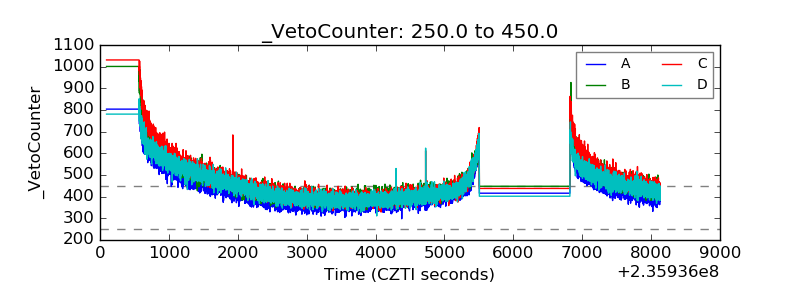 |