| Param | Original file | Final file |
|---|---|---|
| Filename | modeM0/AS1G07_069T01_9000001332_09395cztM0_level2.evt | modeM0/AS1G07_069T01_9000001332_09395cztM0_level2_quad_clean.evt |
| Size (bytes) | 454,481,280 | 92,021,760 |
| Size | 433.4 MB | 87.8 MB |
| Events in quadrant A | 3,717,413 | 578,086 |
| Events in quadrant B | 3,070,056 | 588,439 |
| Events in quadrant C | 2,942,445 | 600,286 |
| Events in quadrant D | 3,599,104 | 573,370 |
| Mode M0 | |||
|---|---|---|---|
| Quadrant | BADHDUFLAG | Total packets | Discarded packets |
| A | 0 | 15421 | 38 |
| B | 0 | 13558 | 29 |
| C | 0 | 13211 | 30 |
| D | 0 | 15216 | 38 |
| Mode SS | |||
|---|---|---|---|
| Quadrant | BADHDUFLAG | Total packets | Discarded packets |
| A | 0 | 130 | 0 |
| B | 0 | 130 | 0 |
| C | 0 | 130 | 0 |
| D | 0 | 130 | 2 |
| Mode M9 | |||
|---|---|---|---|
| Quadrant | BADHDUFLAG | Total packets | Discarded packets |
| A | 0 | 13 | 0 |
| B | 0 | 13 | 0 |
| C | 0 | 13 | 0 |
| D | 0 | 14 | 0 |
| Quadrant | Total seconds | Saturated seconds | Saturation percentage |
|---|---|---|---|
| A | 6405 | 36 | 0.562061% |
| B | 6406 | 48 | 0.749298% |
| C | 6405 | 13 | 0.202966% |
| D | 6404 | 113 | 1.764522% |
Noise dominated data is calculated using 1-second bins in cleaned event files. If a bin has >2000 counts, and if more than 50% of those come from <1% of pixels, then it is considered to be noise-dominated and hence unusable.
| Quadrant | # 1 sec bins | Bins with >0 counts | Bins with >2000 counts | High rate bins dominated by noise | Noise dominated (total time) | Noise dominated (detector-on time) | Marked lightcurve |
|---|---|---|---|---|---|---|---|
| A | 7584 | 6420 | 7 | 7 | 0.09% | 0.11% | 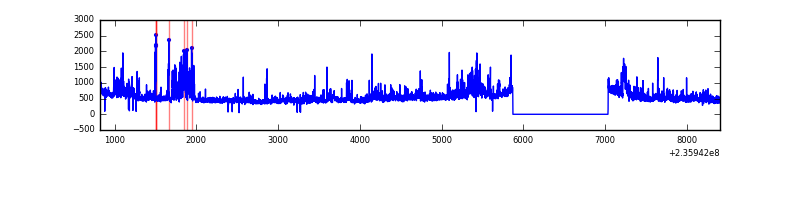 |
| B | 7584 | 6420 | 5 | 5 | 0.07% | 0.08% | 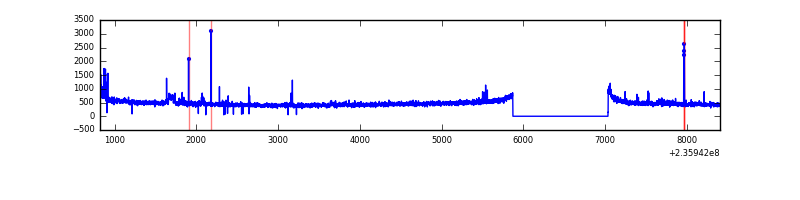 |
| C | 7584 | 6420 | 0 | 0 | 0.00% | 0.00% | 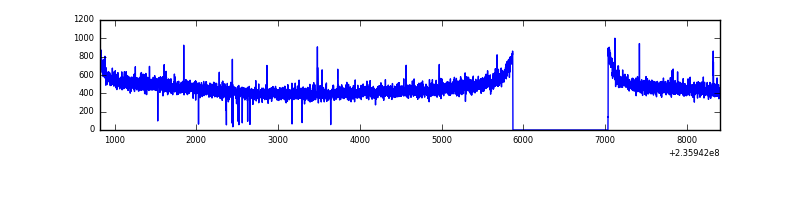 |
| D | 7584 | 6419 | 67 | 67 | 0.88% | 1.04% | 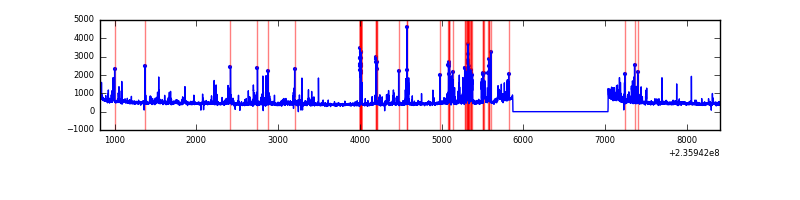 |
Top three noisy pixels from each quadrant. If the there are fewer than three noisy pixels in the level2.evt file, extra rows are filled as -1
| Pixel properties | Quadrant properties | ||||||
|---|---|---|---|---|---|---|---|
| Quadrant | DetID | PixID | Counts | Sigma | Mean | Median | Sigma |
| A | 8 | 5 | 605738 | 3969.34 | 748 | 732 | 152.4 |
| A | 5 | 16 | 150807 | 984.62 | 748 | 732 | 152.4 |
| A | 5 | 112 | 57911 | 375.14 | 748 | 732 | 152.4 |
| B | 5 | 174 | 77296 | 535.32 | 759 | 741 | 143.0 |
| B | 0 | 214 | 19769 | 133.06 | 759 | 741 | 143.0 |
| B | 12 | 111 | 15437 | 102.76 | 759 | 741 | 143.0 |
| C | 13 | 61 | 5533 | 27.65 | 751 | 754 | 172.8 |
| C | 1 | 3 | 3895 | 18.17 | 751 | 754 | 172.8 |
| C | 4 | 254 | 3813 | 17.7 | 751 | 754 | 172.8 |
| D | 12 | 233 | 522450 | 2827.36 | 734 | 717 | 184.5 |
| D | 1 | 52 | 98318 | 528.92 | 734 | 717 | 184.5 |
| D | 2 | 14 | 59631 | 319.26 | 734 | 717 | 184.5 |
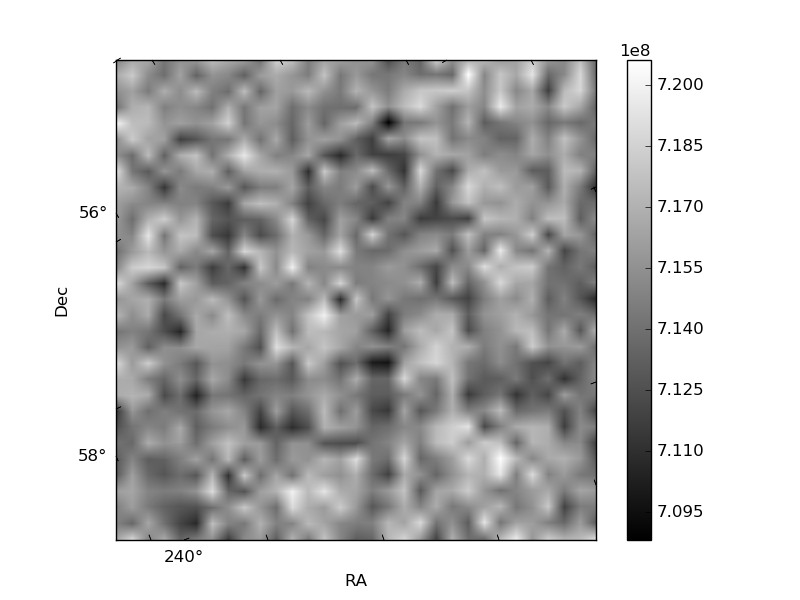
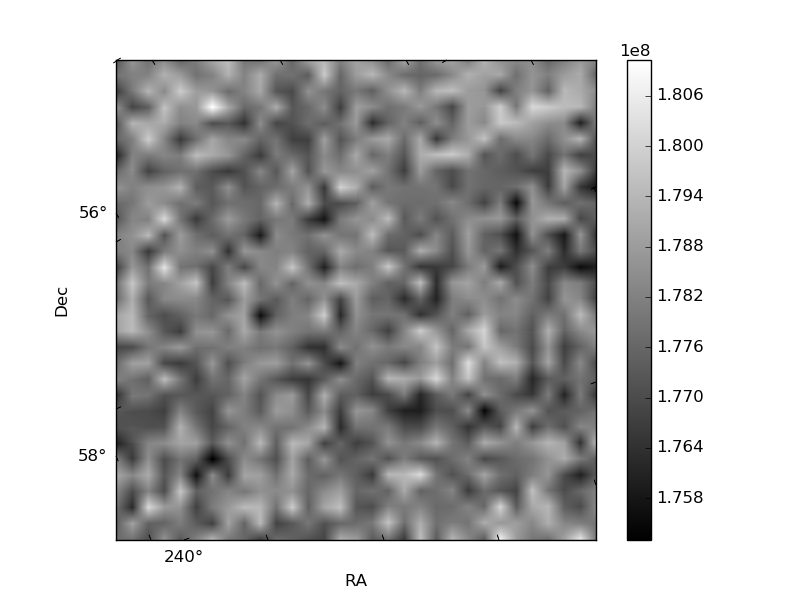
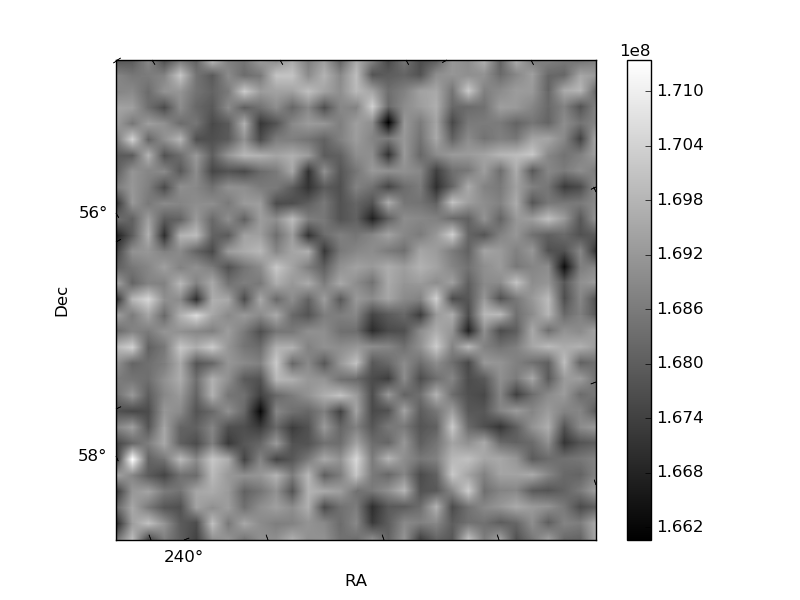
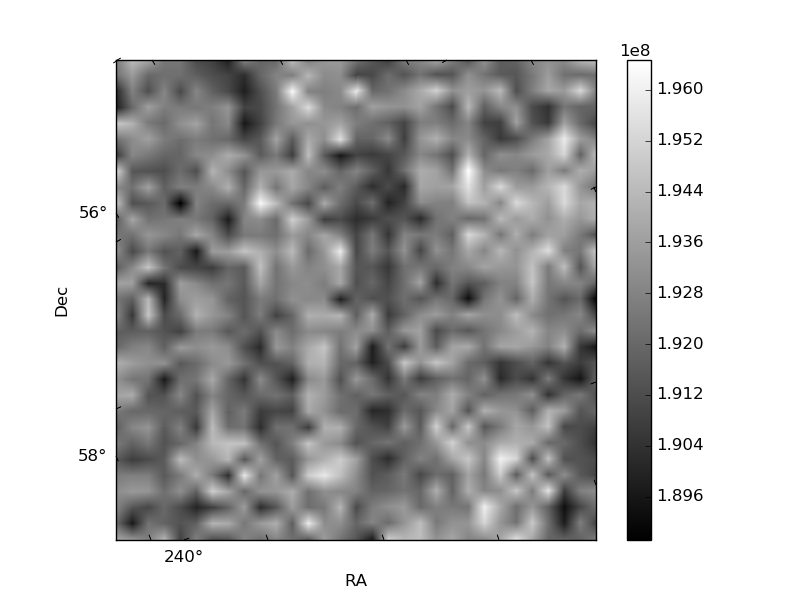
Histogram calculated using DETX and DETY for each event in the final _common_clean file
| Quadrant A | 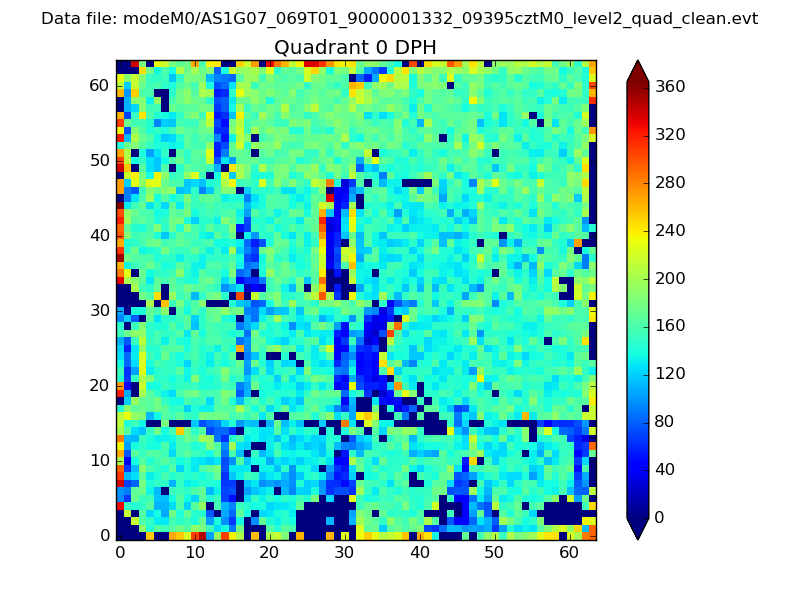 |
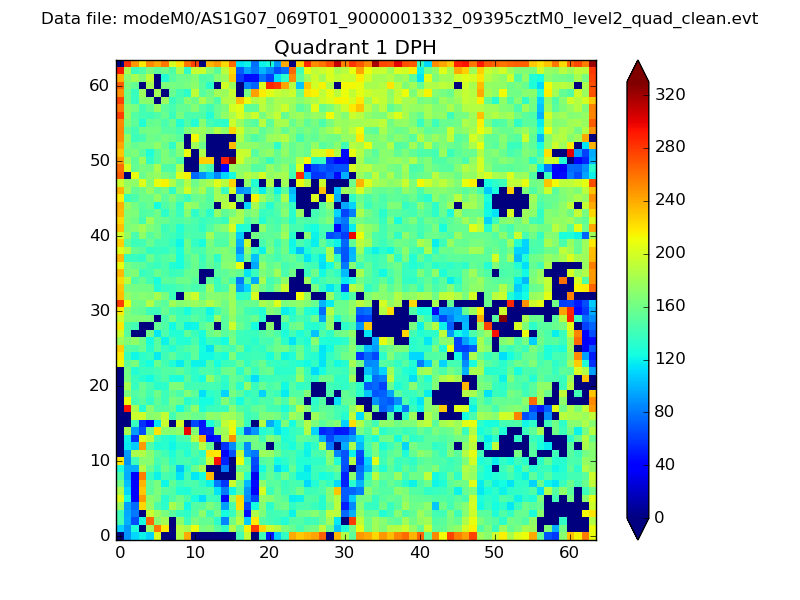 |
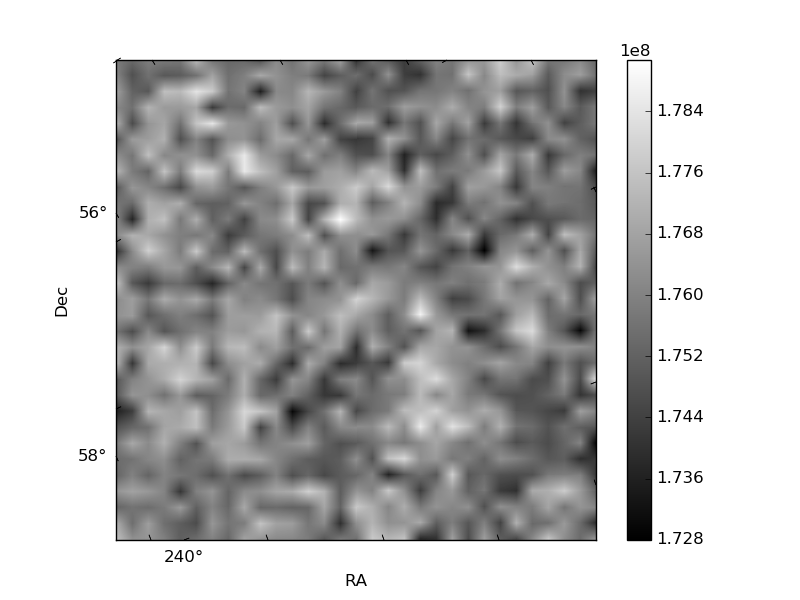
Quadrant B |
|---|---|---|---|
| Quadrant D | 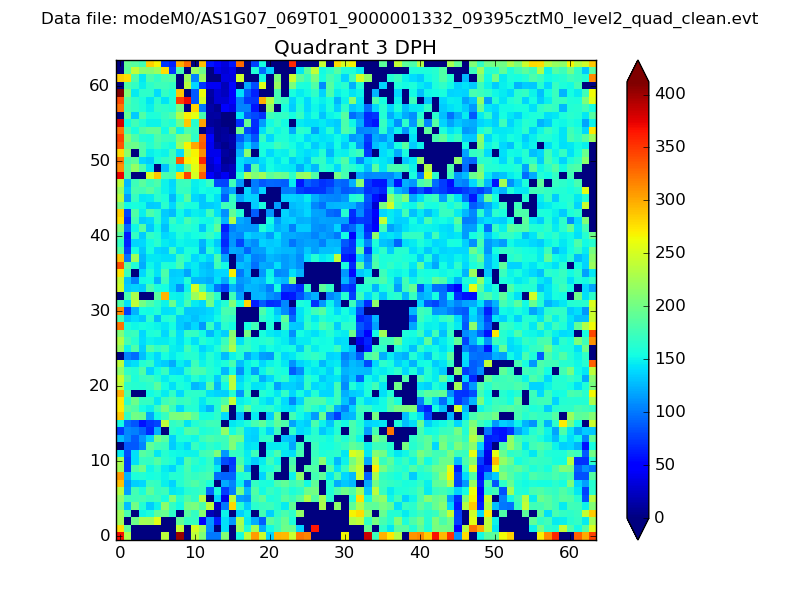 |
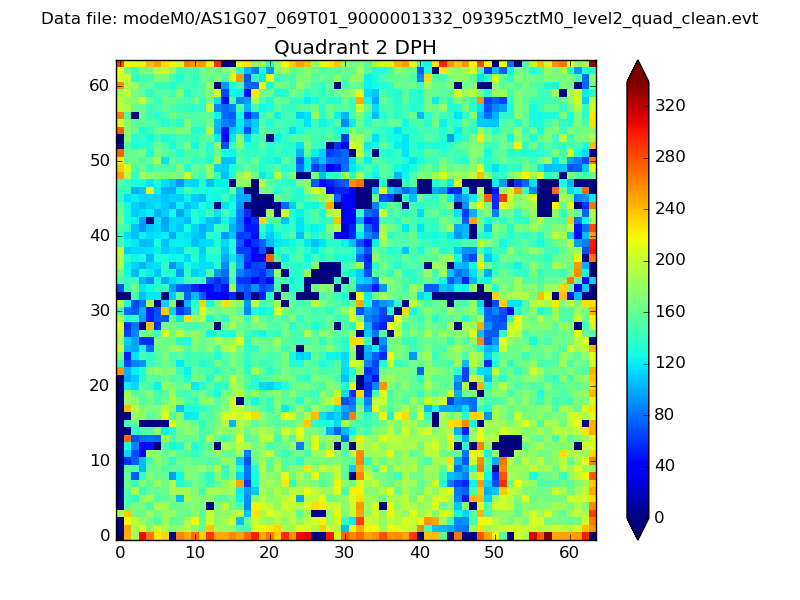 |
Quadrant C |
| Plot type | Count rate plots | Images |
|---|---|---|
| Comparison with Poisson distribution Blue bars denote a histogram of data divided into 1 sec bins. Red curve is a Poisson curve with rate = median count rate of data. |
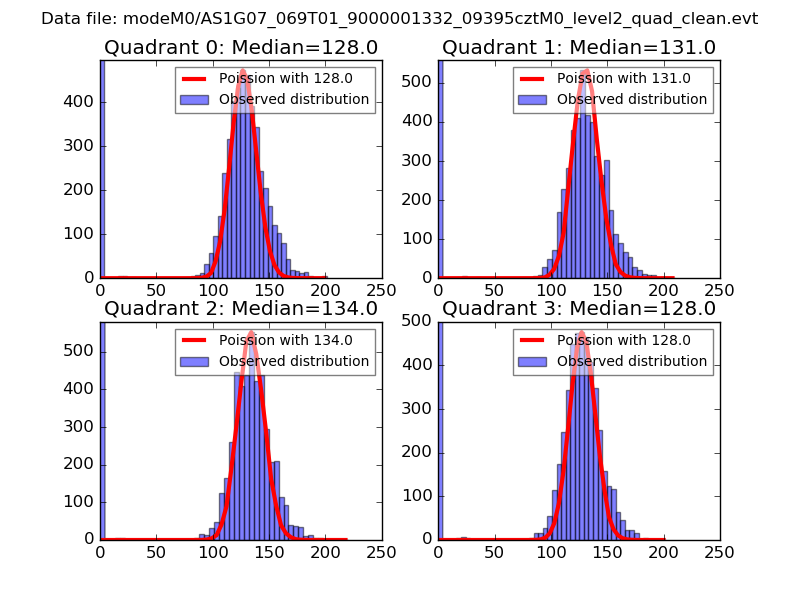 |
 |
| Quadrant-wise count rates Data is divided into 100 sec bins |
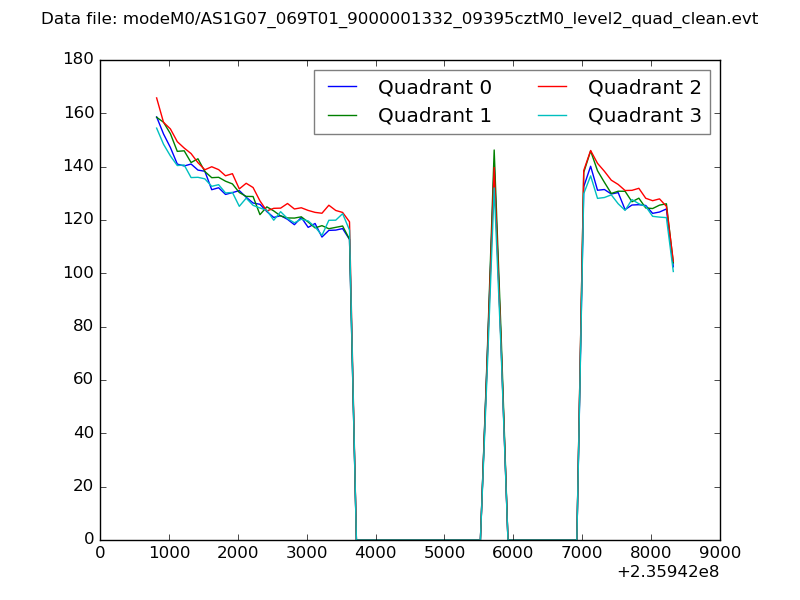 |
|
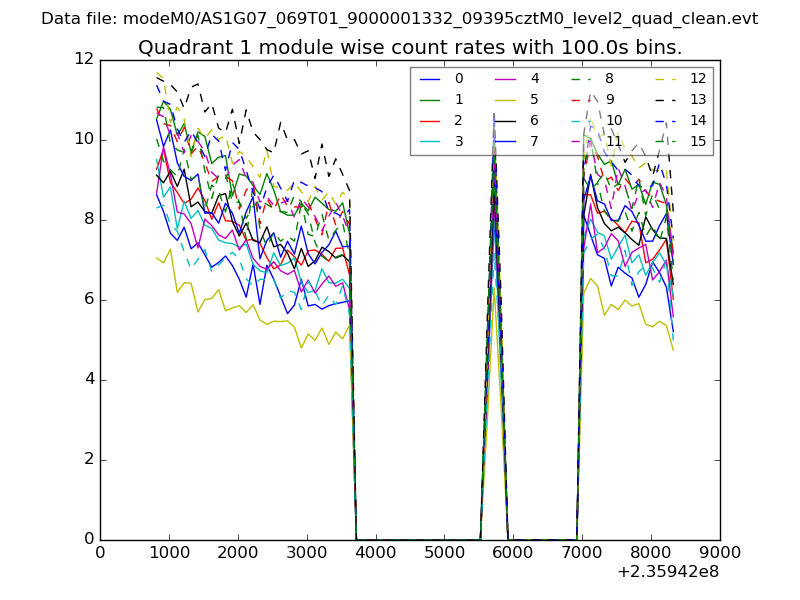
| Module-wise count rates for Quadrant A Data is divided into 100 sec bins |
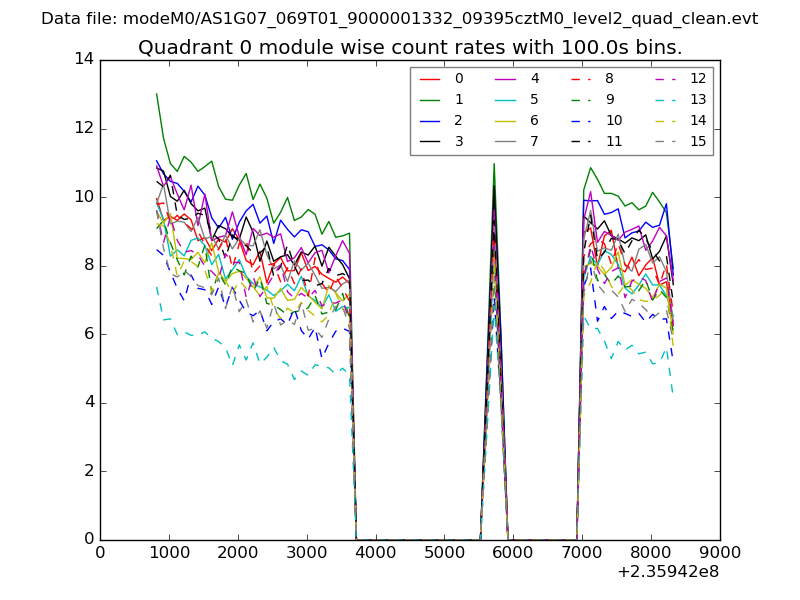 |
 |
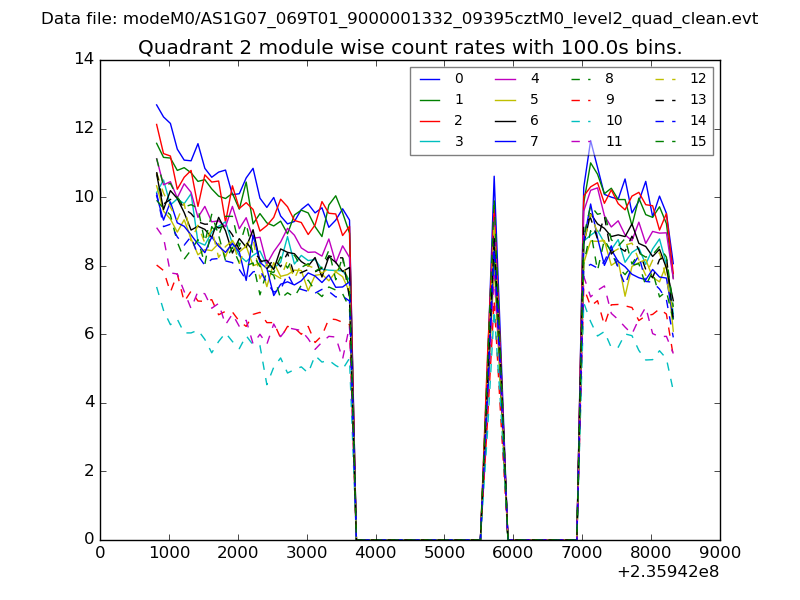
| Module-wise count rates for Quadrant B Data is divided into 100 sec bins |
 |
 |
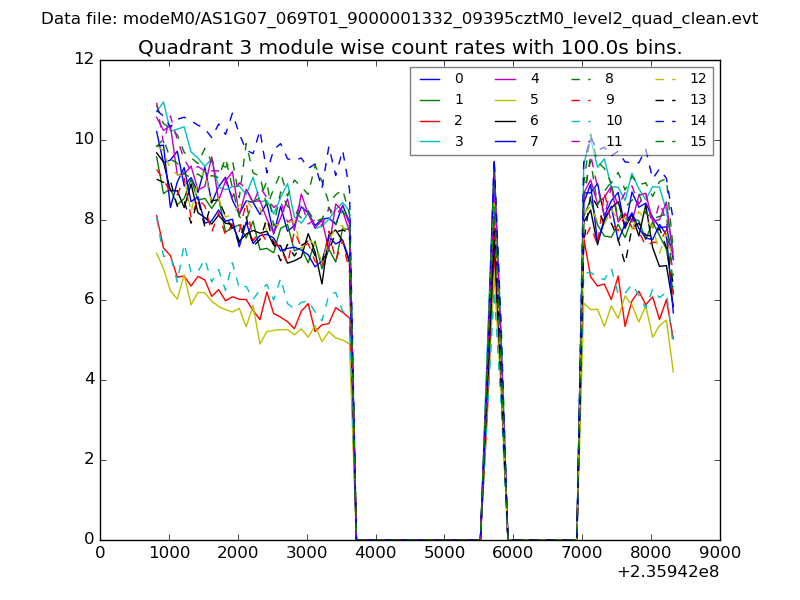
| Module-wise count rates for Quadrant C Data is divided into 100 sec bins |
 |
 |
| Module-wise count rates for Quadrant D Data is divided into 100 sec bins |
 |
 |
| Parameter | Plot |
|---|---|
| CZT HV Monitor | 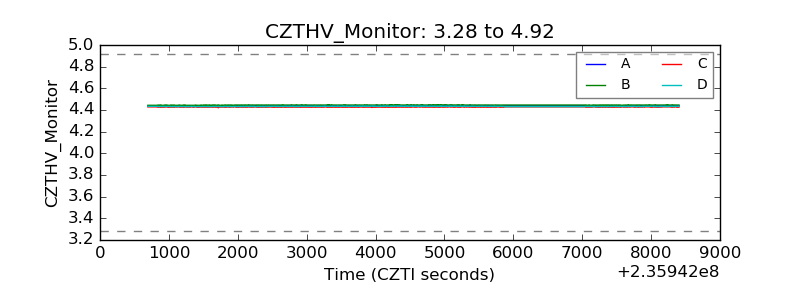 |
| D_VDD | 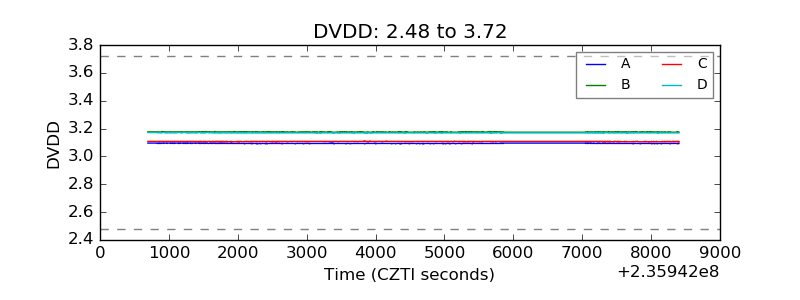 |
| Temperature 1 | 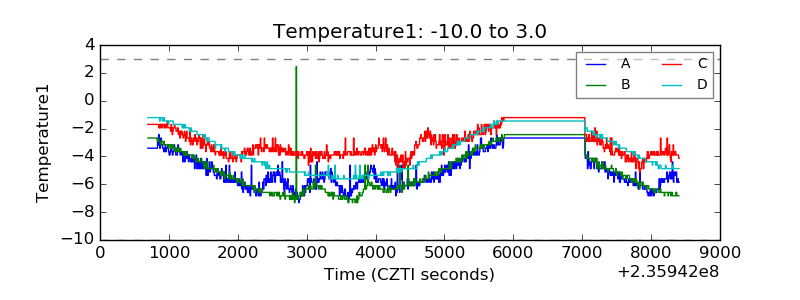 |
| Veto HV Monitor | 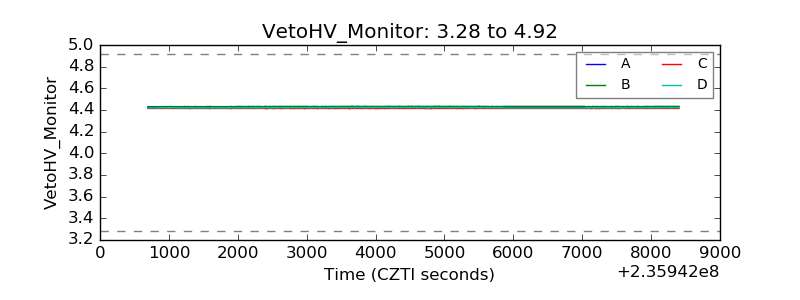 |
| Veto LLD | 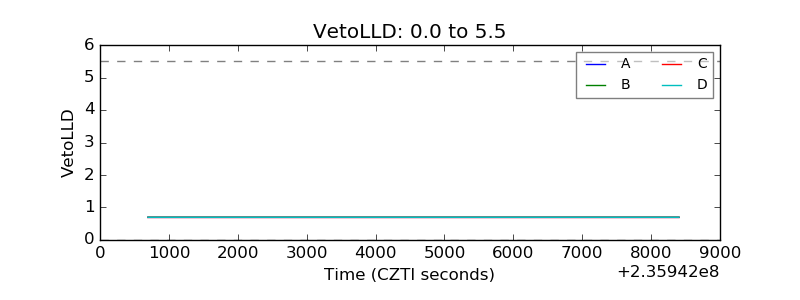 |
| Alpha Counter | 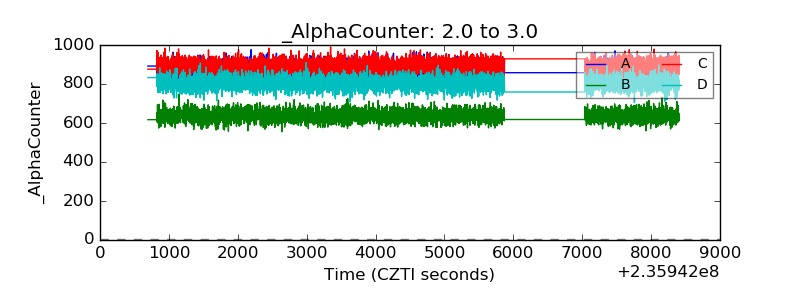 |
| _CPM_Rate | 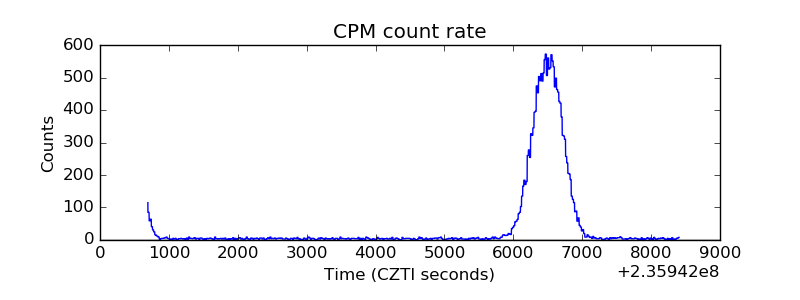 |
| CZT Counter | 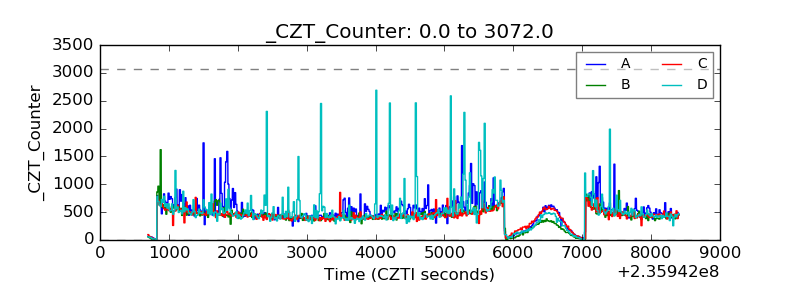 |
| +2.5 Volts monitor |  |
| +5 Volts monitor |  |
| _ROLL_ROT | 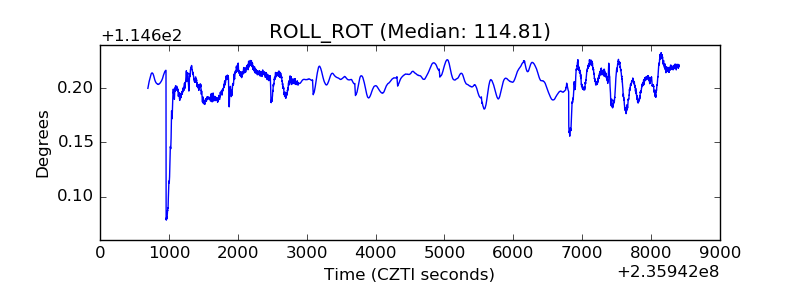 |
| _Roll_DEC | 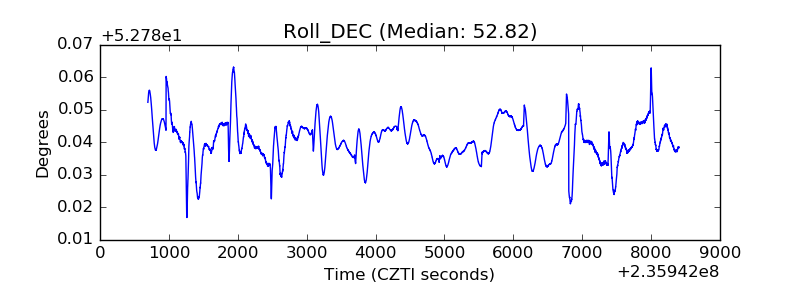 |
| _Roll_RA | 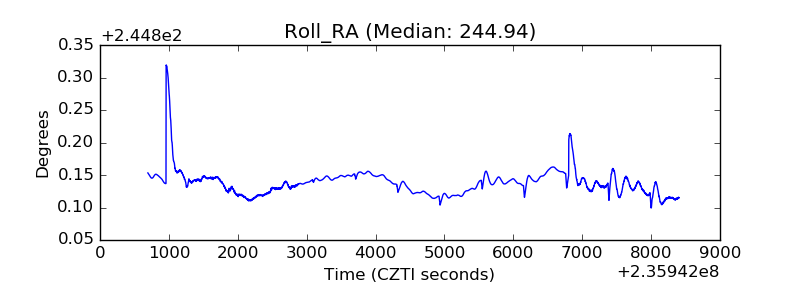 |
| Veto Counter | 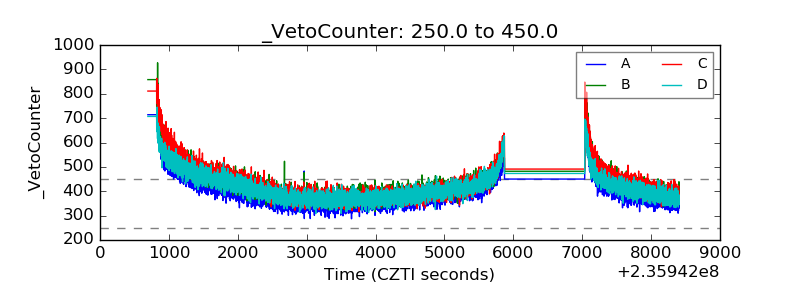 |