| Param | Original file | Final file |
|---|---|---|
| Filename | modeM0/AS1G07_069T01_9000001332_09396cztM0_level2.evt | modeM0/AS1G07_069T01_9000001332_09396cztM0_level2_quad_clean.evt |
| Size (bytes) | 444,643,200 | 93,965,760 |
| Size | 424.0 MB | 89.6 MB |
| Events in quadrant A | 3,652,428 | 590,607 |
| Events in quadrant B | 3,164,100 | 600,008 |
| Events in quadrant C | 2,981,775 | 605,720 |
| Events in quadrant D | 3,212,823 | 582,820 |
| Mode M0 | |||
|---|---|---|---|
| Quadrant | BADHDUFLAG | Total packets | Discarded packets |
| A | 0 | 15327 | 12 |
| B | 0 | 14160 | 14 |
| C | 0 | 13667 | 13 |
| D | 0 | 14501 | 18 |
| Mode SS | |||
|---|---|---|---|
| Quadrant | BADHDUFLAG | Total packets | Discarded packets |
| A | 0 | 136 | 0 |
| B | 0 | 136 | 0 |
| C | 0 | 136 | 0 |
| D | 0 | 136 | 0 |
| Mode M9 | |||
|---|---|---|---|
| Quadrant | BADHDUFLAG | Total packets | Discarded packets |
| A | 0 | 16 | 0 |
| B | 0 | 16 | 0 |
| C | 0 | 16 | 0 |
| D | 0 | 17 | 0 |
| Quadrant | Total seconds | Saturated seconds | Saturation percentage |
|---|---|---|---|
| A | 6693 | 53 | 0.791872% |
| B | 6690 | 37 | 0.553064% |
| C | 6691 | 12 | 0.179345% |
| D | 6689 | 48 | 0.717596% |
Noise dominated data is calculated using 1-second bins in cleaned event files. If a bin has >2000 counts, and if more than 50% of those come from <1% of pixels, then it is considered to be noise-dominated and hence unusable.
| Quadrant | # 1 sec bins | Bins with >0 counts | Bins with >2000 counts | High rate bins dominated by noise | Noise dominated (total time) | Noise dominated (detector-on time) | Marked lightcurve |
|---|---|---|---|---|---|---|---|
| A | 7576 | 6697 | 14 | 14 | 0.18% | 0.21% | 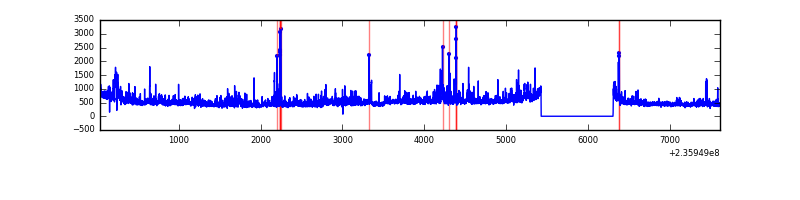 |
| B | 7576 | 6697 | 3 | 3 | 0.04% | 0.04% | 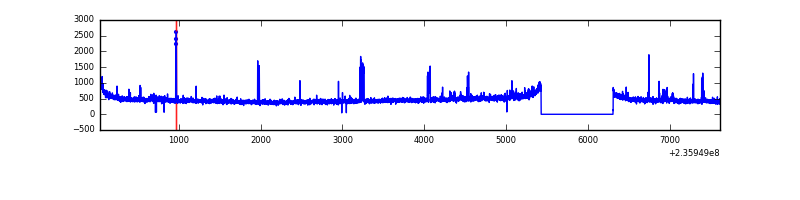 |
| C | 7576 | 6697 | 0 | 0 | 0.00% | 0.00% | 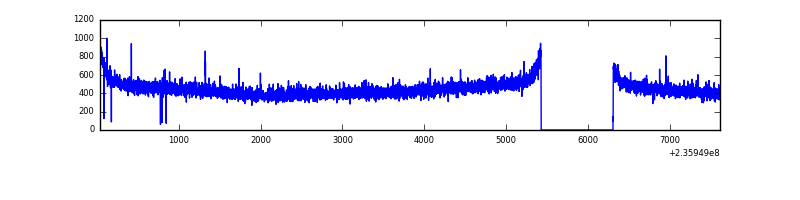 |
| D | 7576 | 6697 | 19 | 19 | 0.25% | 0.28% |  |
Top three noisy pixels from each quadrant. If the there are fewer than three noisy pixels in the level2.evt file, extra rows are filled as -1
| Pixel properties | Quadrant properties | ||||||
|---|---|---|---|---|---|---|---|
| Quadrant | DetID | PixID | Counts | Sigma | Mean | Median | Sigma |
| A | 8 | 5 | 521244 | 3322.49 | 764 | 747 | 156.7 |
| A | 5 | 112 | 57412 | 361.71 | 764 | 747 | 156.7 |
| A | 4 | 2 | 45511 | 285.74 | 764 | 747 | 156.7 |
| B | 5 | 174 | 85098 | 575.13 | 773 | 755 | 146.6 |
| B | 0 | 214 | 40316 | 269.77 | 773 | 755 | 146.6 |
| B | 8 | 234 | 17194 | 112.1 | 773 | 755 | 146.6 |
| C | 13 | 61 | 5723 | 28.2 | 762 | 765 | 175.8 |
| C | 10 | 22 | 5368 | 26.18 | 762 | 765 | 175.8 |
| C | 12 | 4 | 3215 | 13.93 | 762 | 765 | 175.8 |
| D | 1 | 52 | 89377 | 482.09 | 748 | 732 | 183.9 |
| D | 12 | 233 | 75166 | 404.81 | 748 | 732 | 183.9 |
| D | 13 | 104 | 62680 | 336.9 | 748 | 732 | 183.9 |
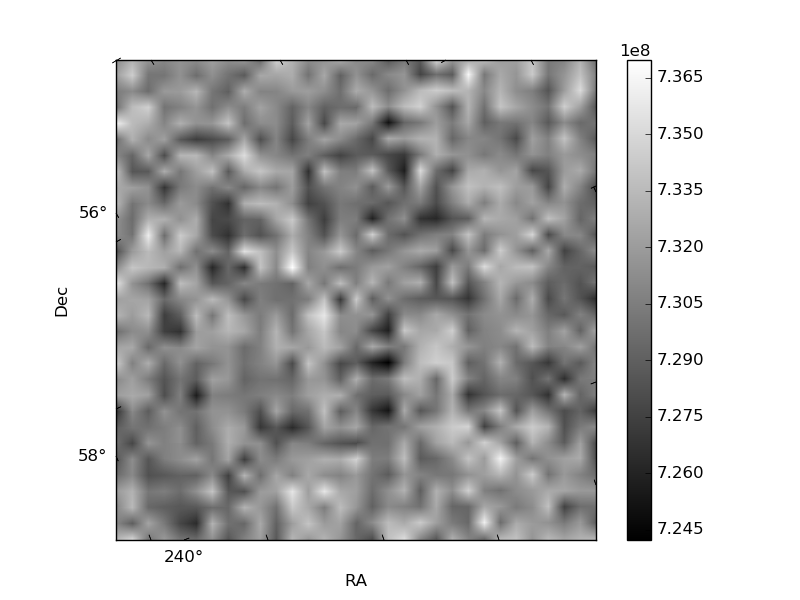
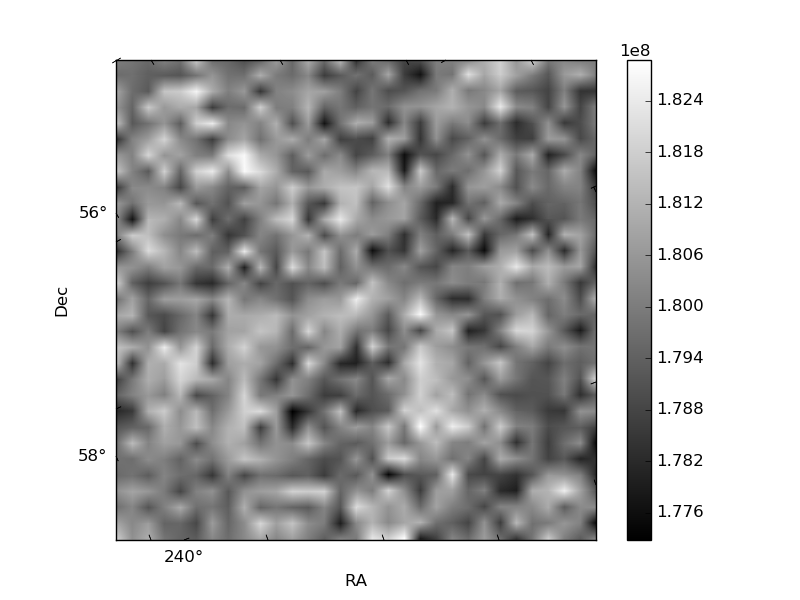
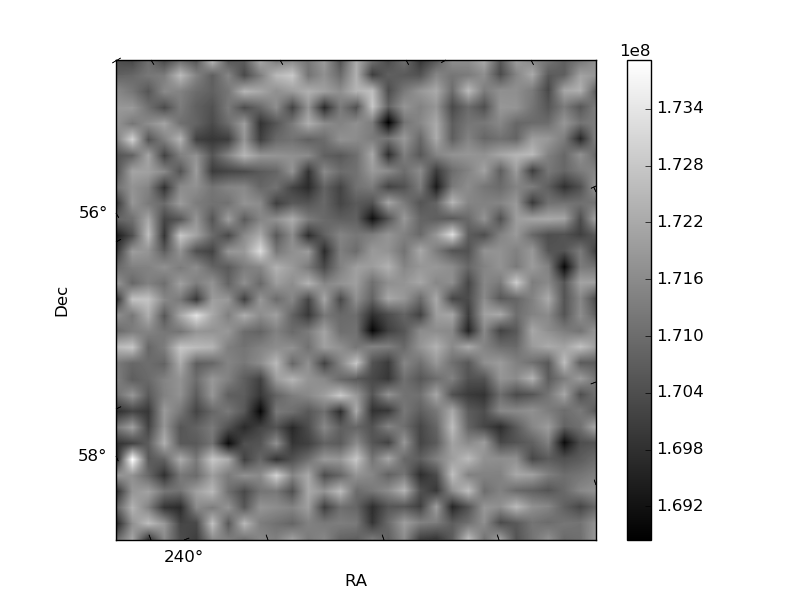
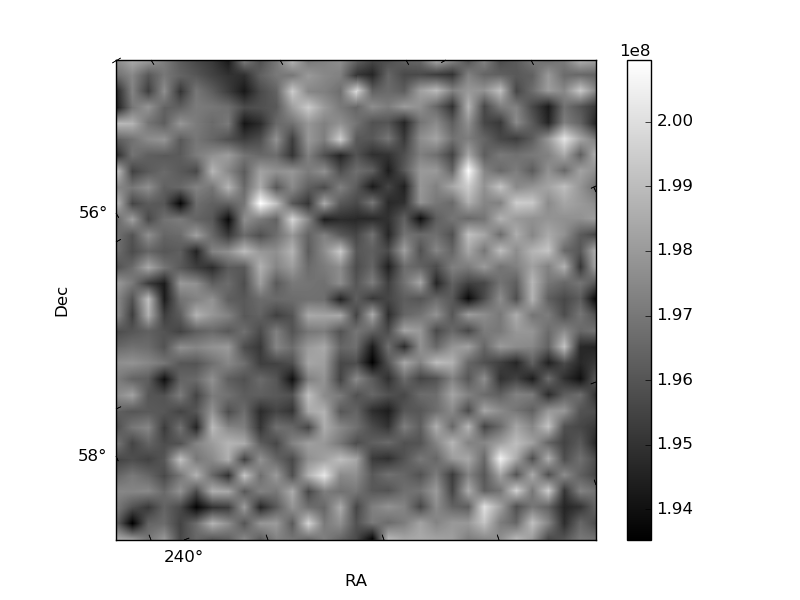
Histogram calculated using DETX and DETY for each event in the final _common_clean file
| Quadrant A | 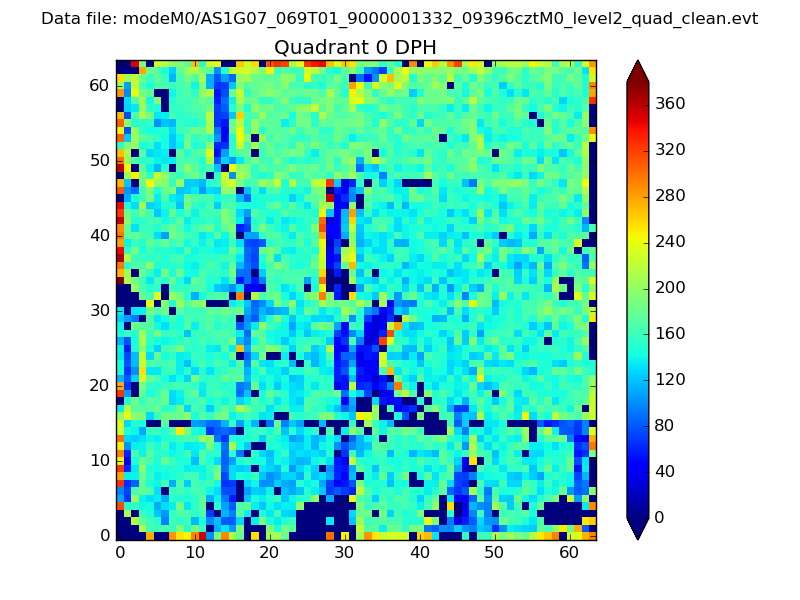 |
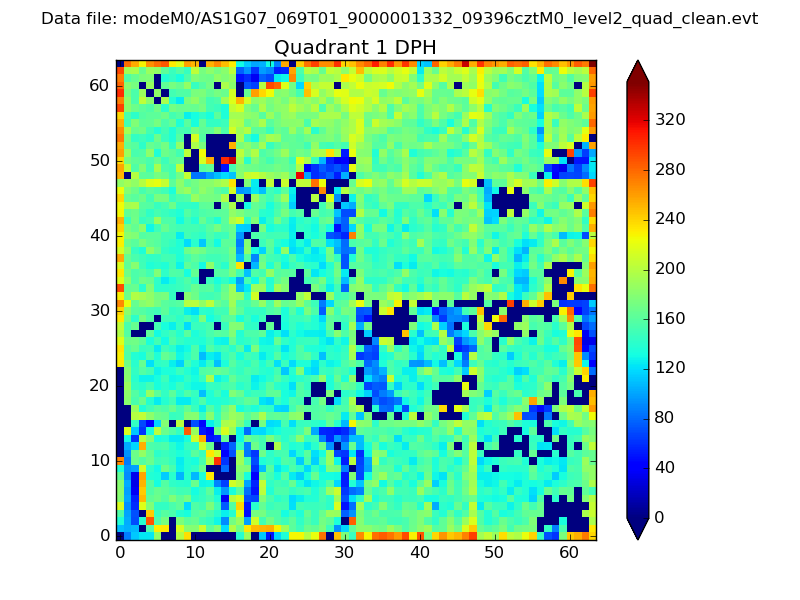 |
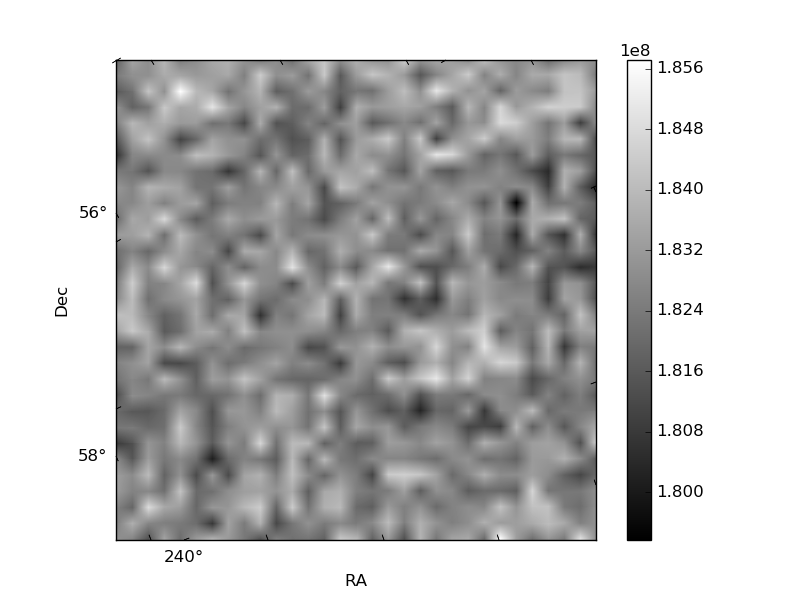
Quadrant B |
|---|---|---|---|
| Quadrant D | 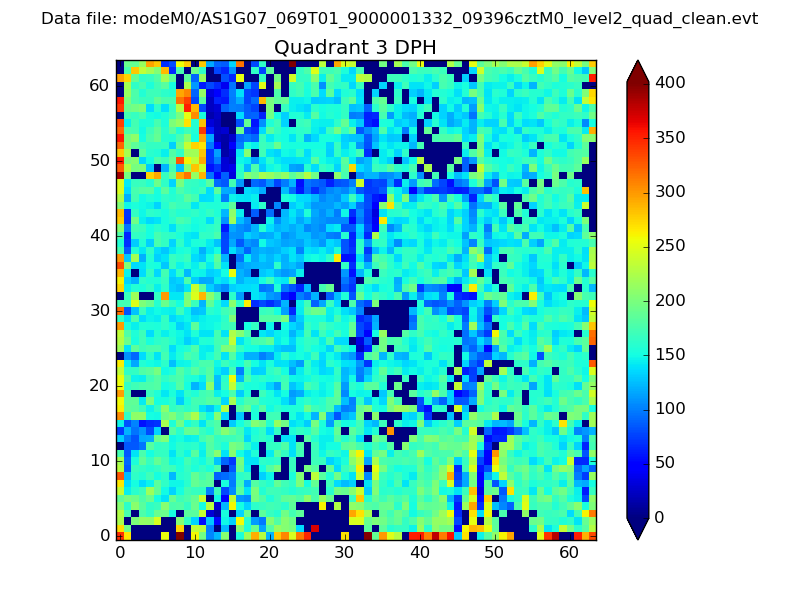 |
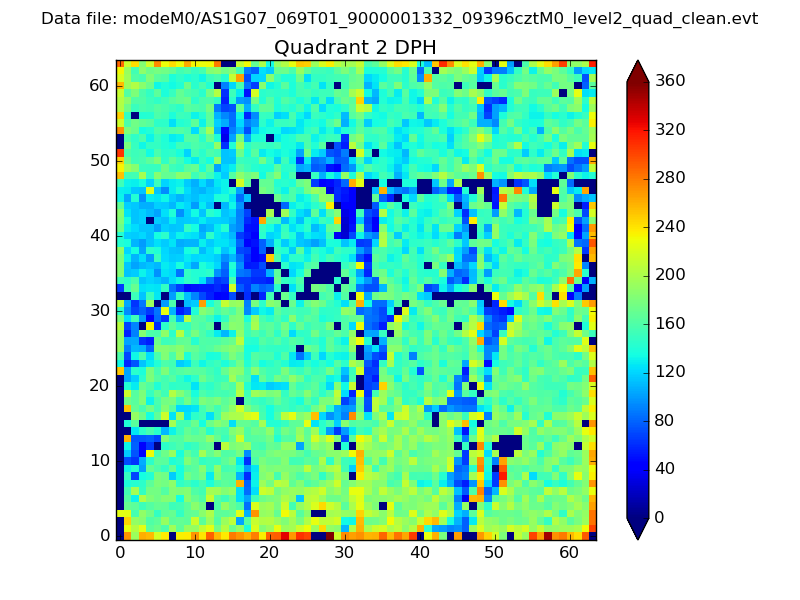 |
Quadrant C |
| Plot type | Count rate plots | Images |
|---|---|---|
| Comparison with Poisson distribution Blue bars denote a histogram of data divided into 1 sec bins. Red curve is a Poisson curve with rate = median count rate of data. |
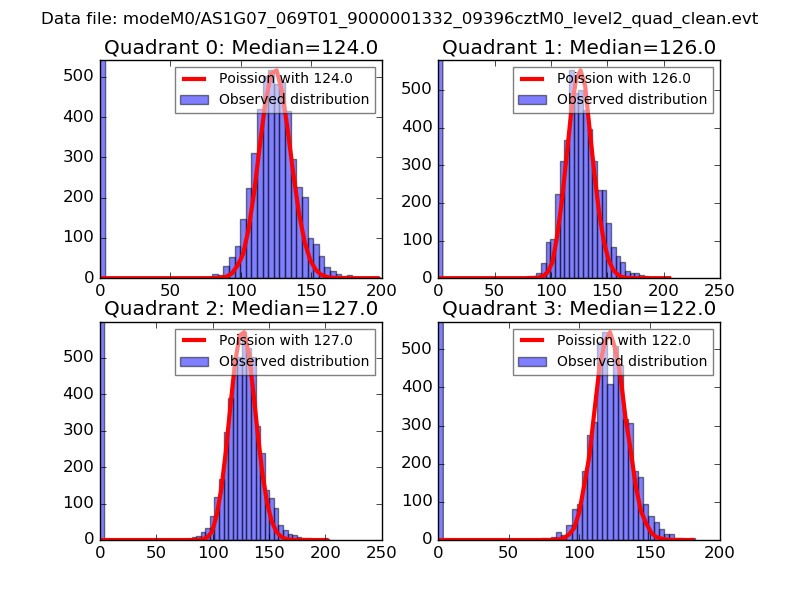 |
 |
| Quadrant-wise count rates Data is divided into 100 sec bins |
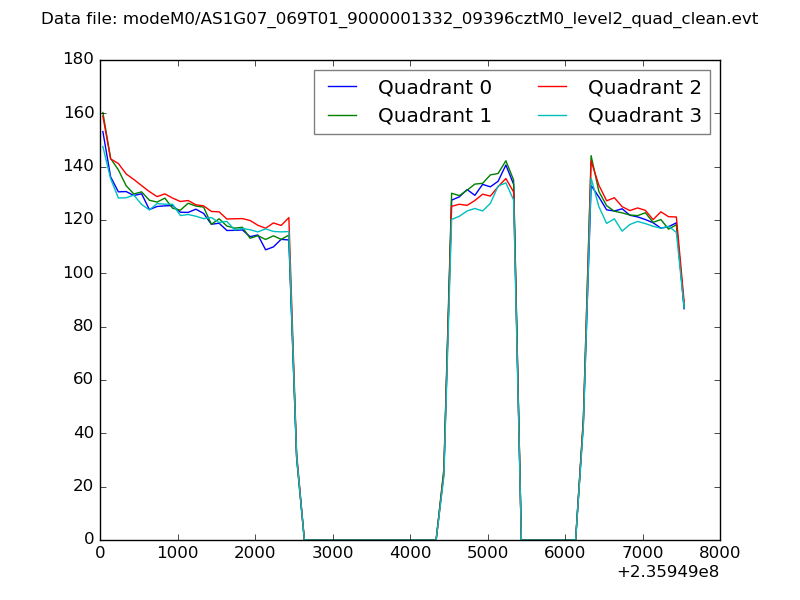 |
|
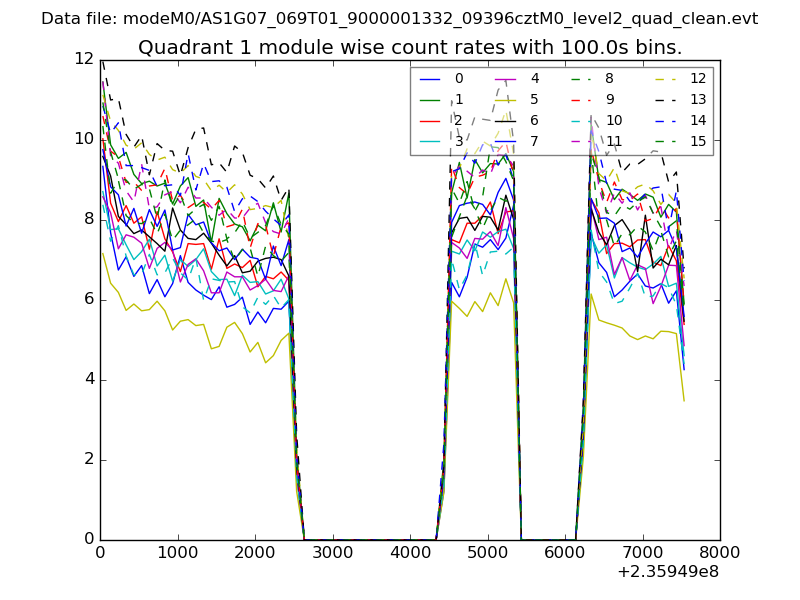
| Module-wise count rates for Quadrant A Data is divided into 100 sec bins |
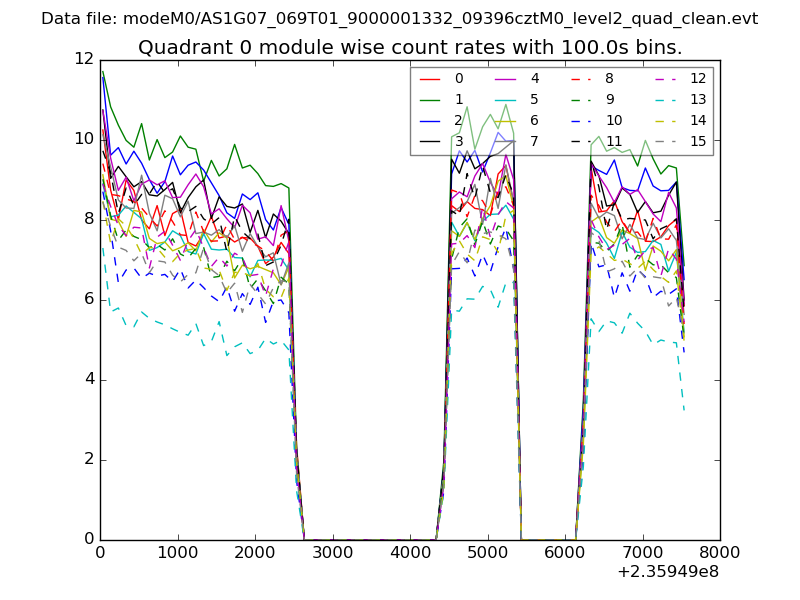 |
 |
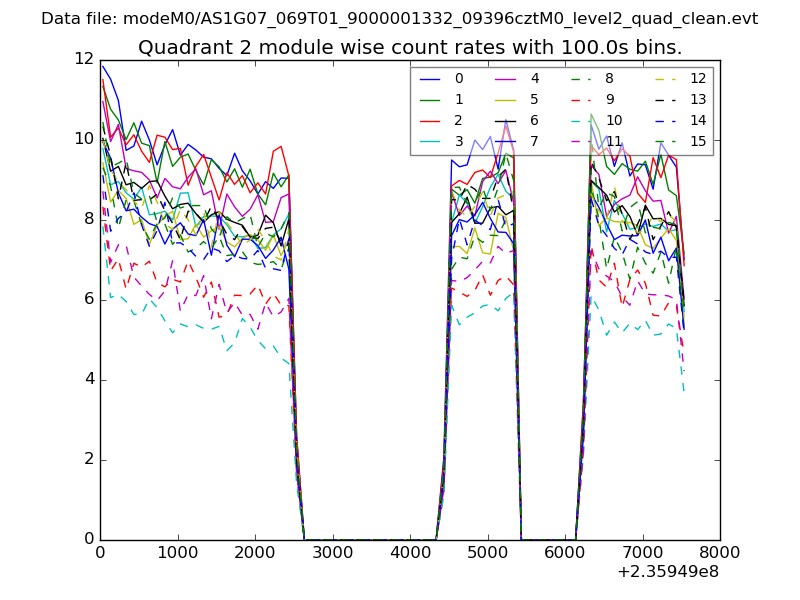
| Module-wise count rates for Quadrant B Data is divided into 100 sec bins |
 |
 |
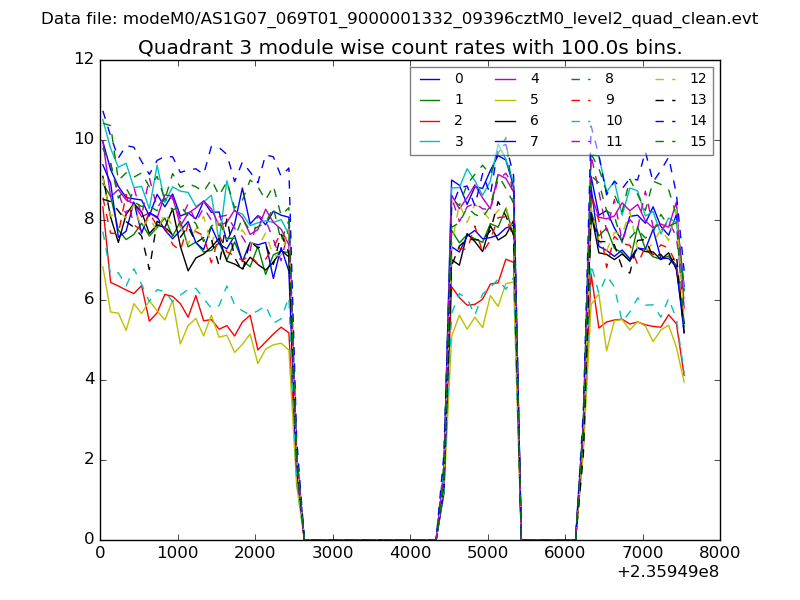
| Module-wise count rates for Quadrant C Data is divided into 100 sec bins |
 |
 |
| Module-wise count rates for Quadrant D Data is divided into 100 sec bins |
 |
 |
| Parameter | Plot |
|---|---|
| CZT HV Monitor | 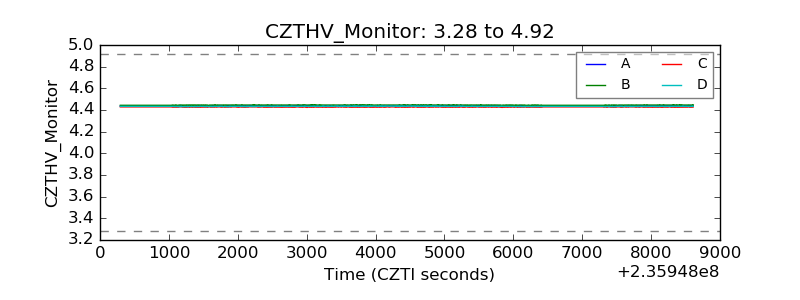 |
| D_VDD |  |
| Temperature 1 | 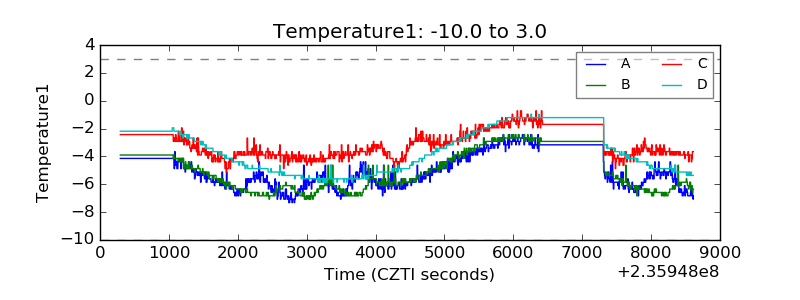 |
| Veto HV Monitor |  |
| Veto LLD | 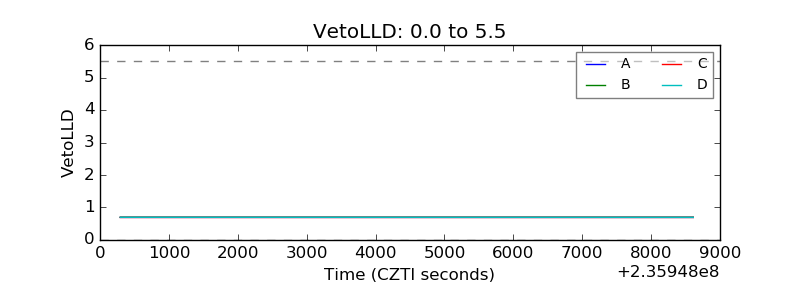 |
| Alpha Counter | 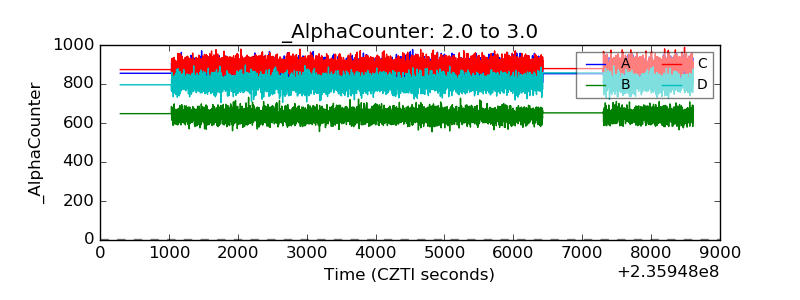 |
| _CPM_Rate | 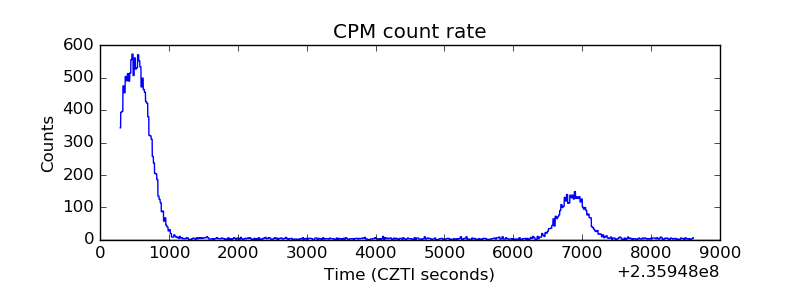 |
| CZT Counter | 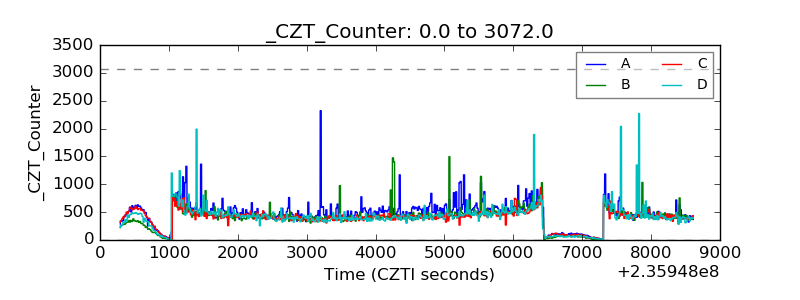 |
| +2.5 Volts monitor |  |
| +5 Volts monitor |  |
| _ROLL_ROT | 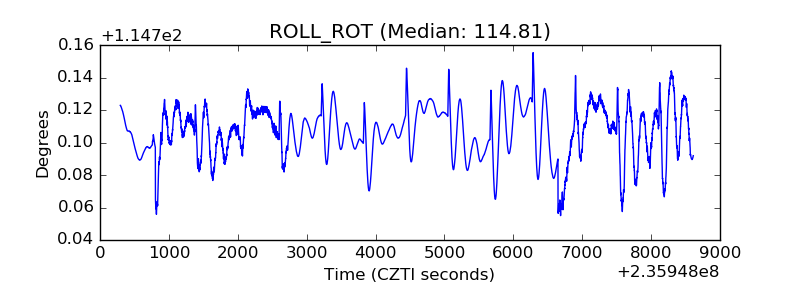 |
| _Roll_DEC | 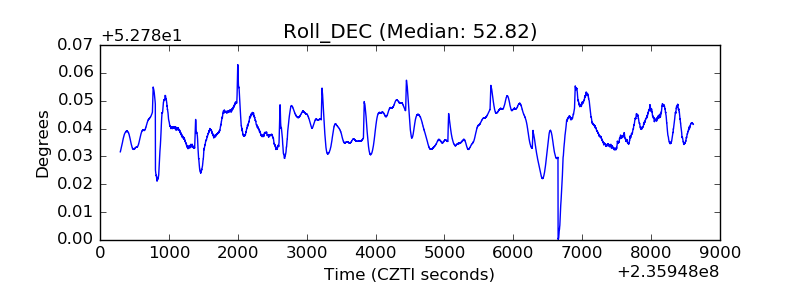 |
| _Roll_RA | 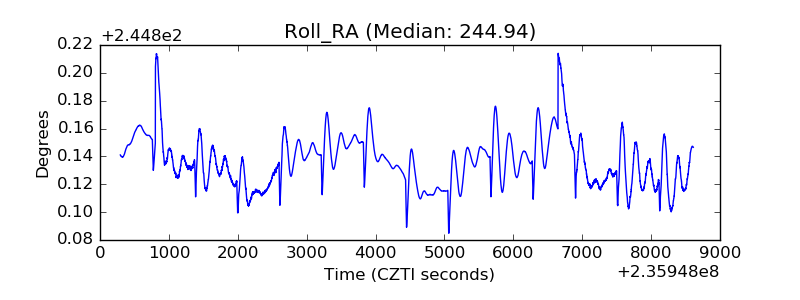 |
| Veto Counter | 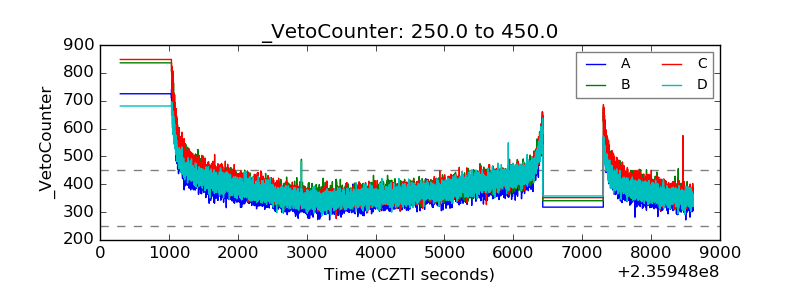 |