| Param | Original file | Final file |
|---|---|---|
| Filename | modeM0/AS1G07_069T01_9000001332_09397cztM0_level2.evt | modeM0/AS1G07_069T01_9000001332_09397cztM0_level2_quad_clean.evt |
| Size (bytes) | 471,021,120 | 93,951,360 |
| Size | 449.2 MB | 89.6 MB |
| Events in quadrant A | 3,887,345 | 592,839 |
| Events in quadrant B | 3,224,304 | 604,016 |
| Events in quadrant C | 3,003,950 | 606,009 |
| Events in quadrant D | 3,696,481 | 578,223 |
| Mode M0 | |||
|---|---|---|---|
| Quadrant | BADHDUFLAG | Total packets | Discarded packets |
| A | 0 | 16954 | 863 |
| B | 0 | 14901 | 688 |
| C | 0 | 14292 | 641 |
| D | 0 | 16603 | 767 |
| Mode SS | |||
|---|---|---|---|
| Quadrant | BADHDUFLAG | Total packets | Discarded packets |
| A | 0 | 142 | 2 |
| B | 0 | 141 | 9 |
| C | 0 | 142 | 4 |
| D | 0 | 142 | 6 |
| Mode M9 | |||
|---|---|---|---|
| Quadrant | BADHDUFLAG | Total packets | Discarded packets |
| A | 0 | 14 | 0 |
| B | 0 | 14 | 0 |
| C | 0 | 14 | 1 |
| D | 0 | 14 | 0 |
| Quadrant | Total seconds | Saturated seconds | Saturation percentage |
|---|---|---|---|
| A | 6636 | 139 | 2.094635% |
| B | 6661 | 39 | 0.585498% |
| C | 6665 | 18 | 0.270068% |
| D | 6644 | 147 | 2.212523% |
Noise dominated data is calculated using 1-second bins in cleaned event files. If a bin has >2000 counts, and if more than 50% of those come from <1% of pixels, then it is considered to be noise-dominated and hence unusable.
| Quadrant | # 1 sec bins | Bins with >0 counts | Bins with >2000 counts | High rate bins dominated by noise | Noise dominated (total time) | Noise dominated (detector-on time) | Marked lightcurve |
|---|---|---|---|---|---|---|---|
| A | 8333 | 6932 | 35 | 35 | 0.42% | 0.50% |  |
| B | 8333 | 6945 | 6 | 6 | 0.07% | 0.09% | 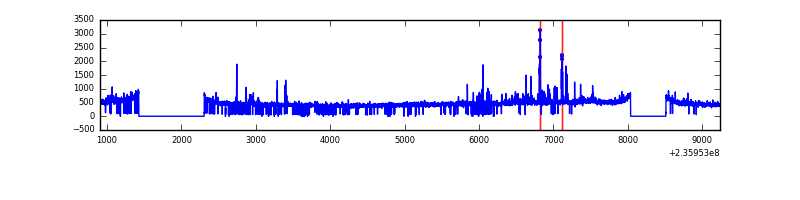 |
| C | 8333 | 6941 | 0 | 0 | 0.00% | 0.00% | 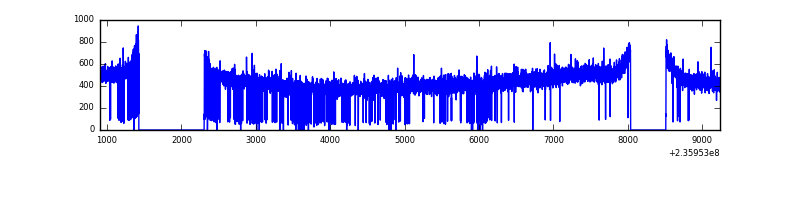 |
| D | 8333 | 6942 | 118 | 118 | 1.42% | 1.70% | 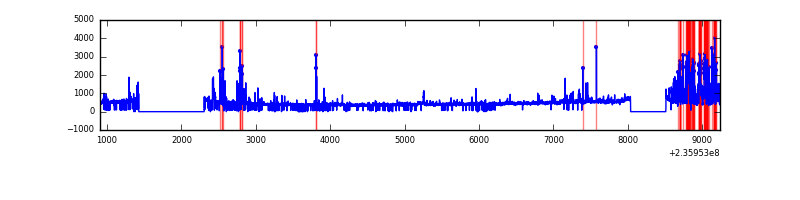 |
Top three noisy pixels from each quadrant. If the there are fewer than three noisy pixels in the level2.evt file, extra rows are filled as -1
| Pixel properties | Quadrant properties | ||||||
|---|---|---|---|---|---|---|---|
| Quadrant | DetID | PixID | Counts | Sigma | Mean | Median | Sigma |
| A | 14 | 111 | 472690 | 2971.51 | 768 | 751 | 158.8 |
| A | 8 | 5 | 418108 | 2627.84 | 768 | 751 | 158.8 |
| A | 4 | 2 | 16980 | 102.18 | 768 | 751 | 158.8 |
| B | 8 | 234 | 106924 | 711.82 | 780 | 758 | 149.1 |
| B | 0 | 214 | 49617 | 327.59 | 780 | 758 | 149.1 |
| B | 12 | 111 | 16538 | 105.8 | 780 | 758 | 149.1 |
| C | 13 | 61 | 5678 | 27.48 | 769 | 773 | 178.5 |
| C | 14 | 67 | 2763 | 11.15 | 769 | 773 | 178.5 |
| C | 1 | 3 | 2274 | 8.41 | 769 | 773 | 178.5 |
| D | 1 | 52 | 569953 | 3077.99 | 752 | 731 | 184.9 |
| D | 13 | 104 | 80704 | 432.44 | 752 | 731 | 184.9 |
| D | 7 | 71 | 59633 | 318.5 | 752 | 731 | 184.9 |
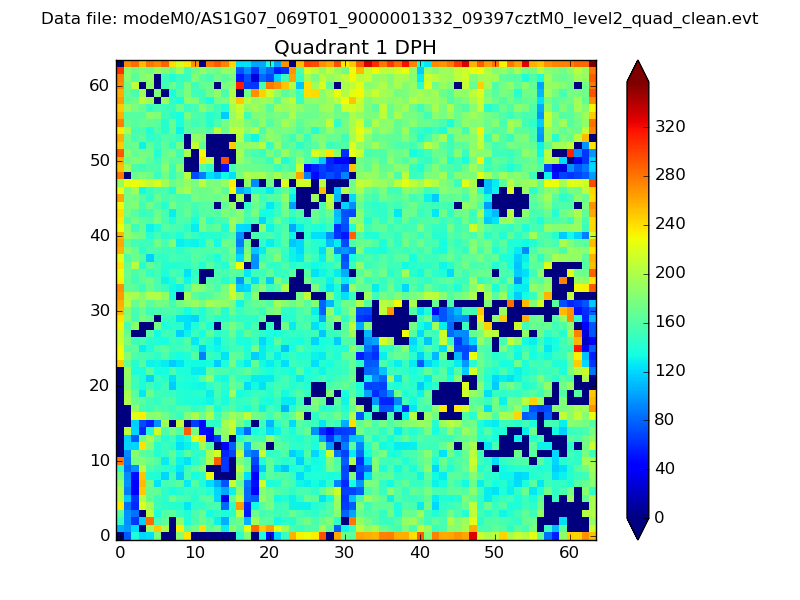
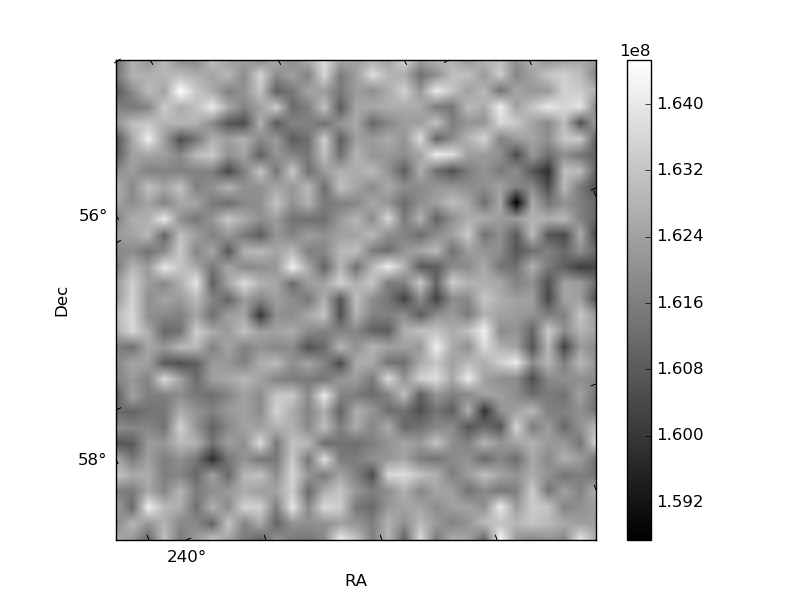
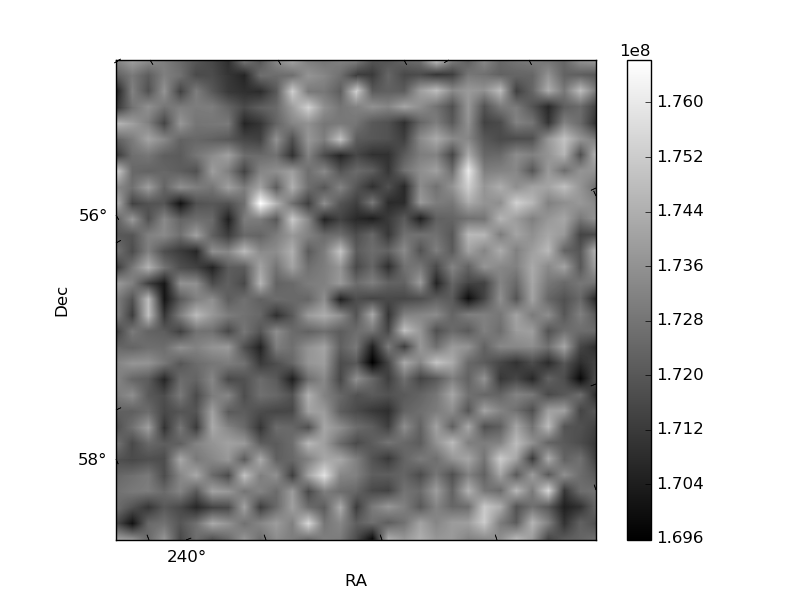
Histogram calculated using DETX and DETY for each event in the final _common_clean file
| Quadrant A | 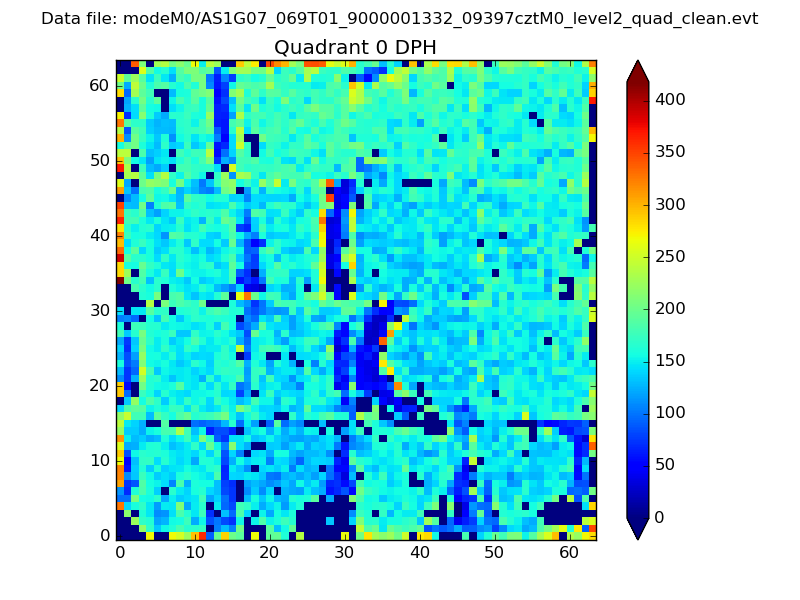 |
 |
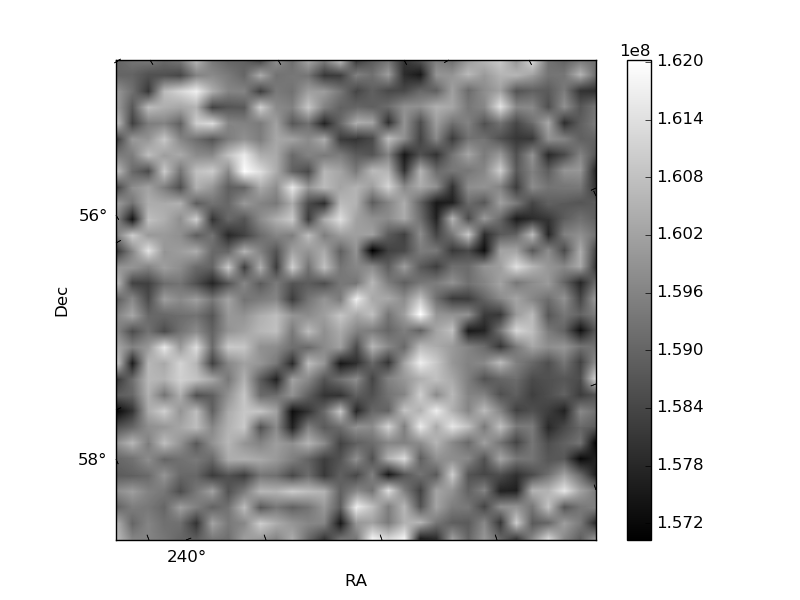
Quadrant B |
|---|---|---|---|
| Quadrant D | 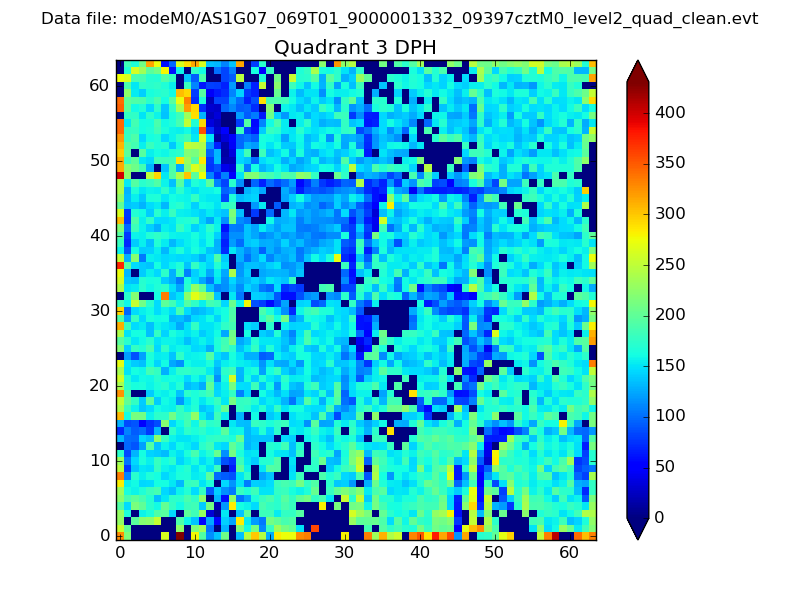 |
 |
Quadrant C |
| Plot type | Count rate plots | Images |
|---|---|---|
| Comparison with Poisson distribution Blue bars denote a histogram of data divided into 1 sec bins. Red curve is a Poisson curve with rate = median count rate of data. |
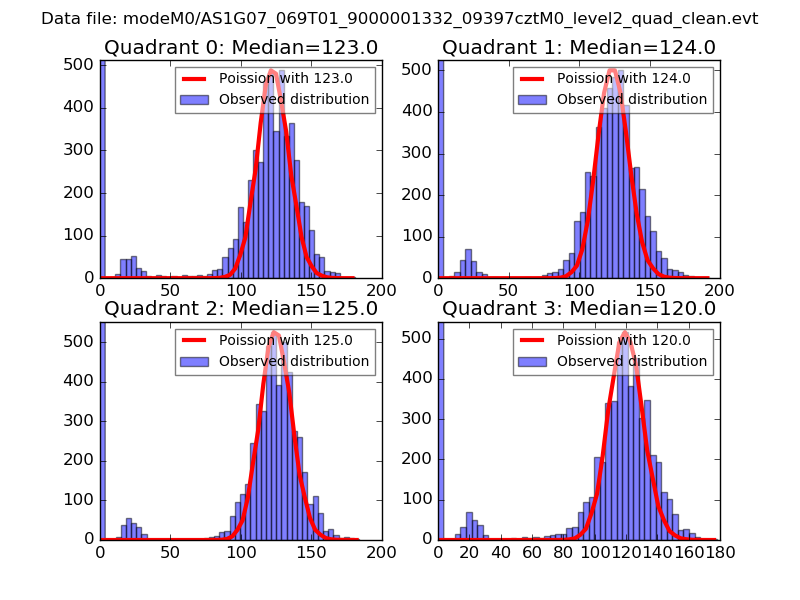 |
 |
| Quadrant-wise count rates Data is divided into 100 sec bins |
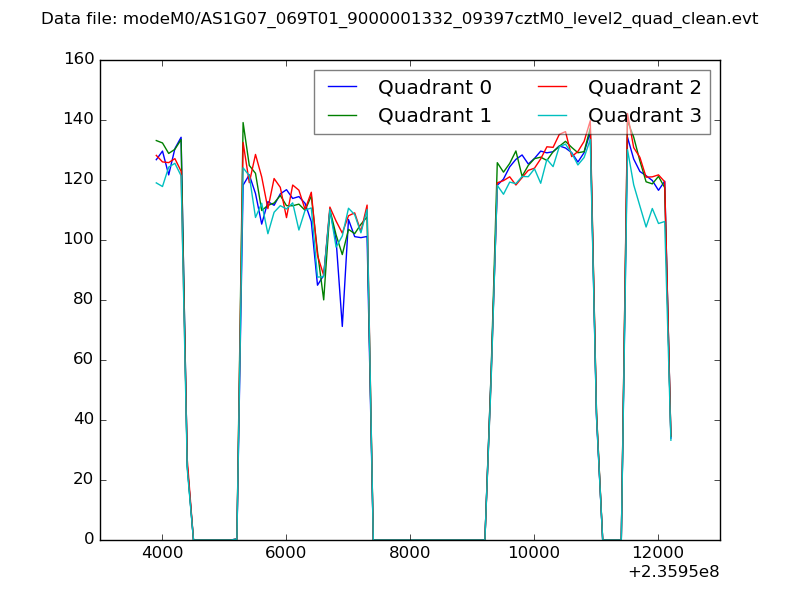 |
|
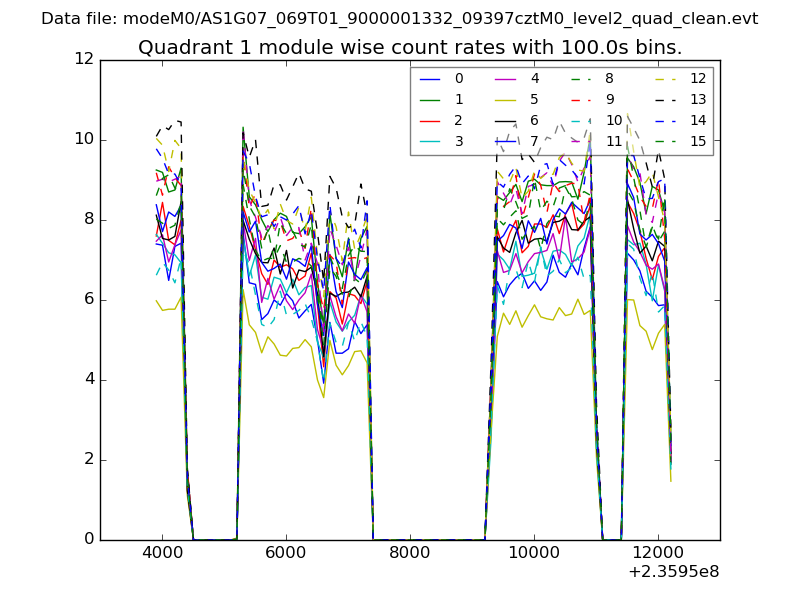
| Module-wise count rates for Quadrant A Data is divided into 100 sec bins |
 |
 |
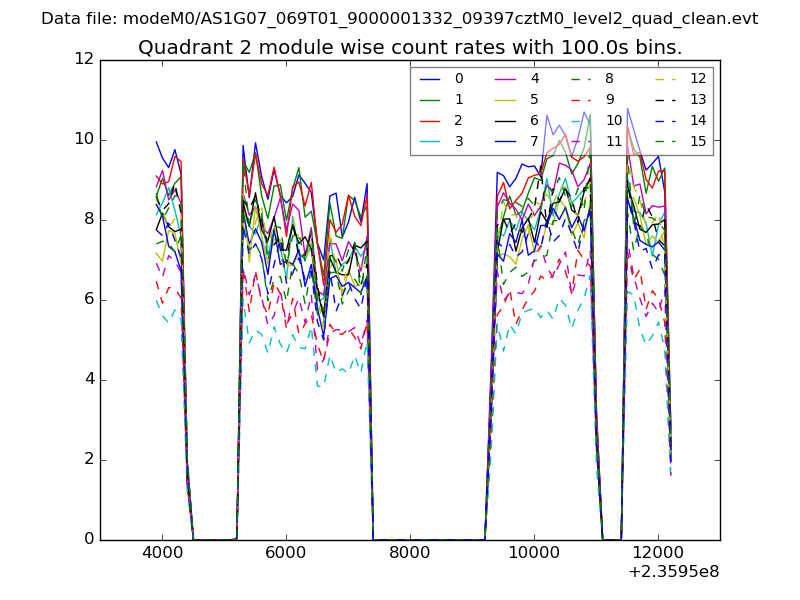
| Module-wise count rates for Quadrant B Data is divided into 100 sec bins |
 |
 |
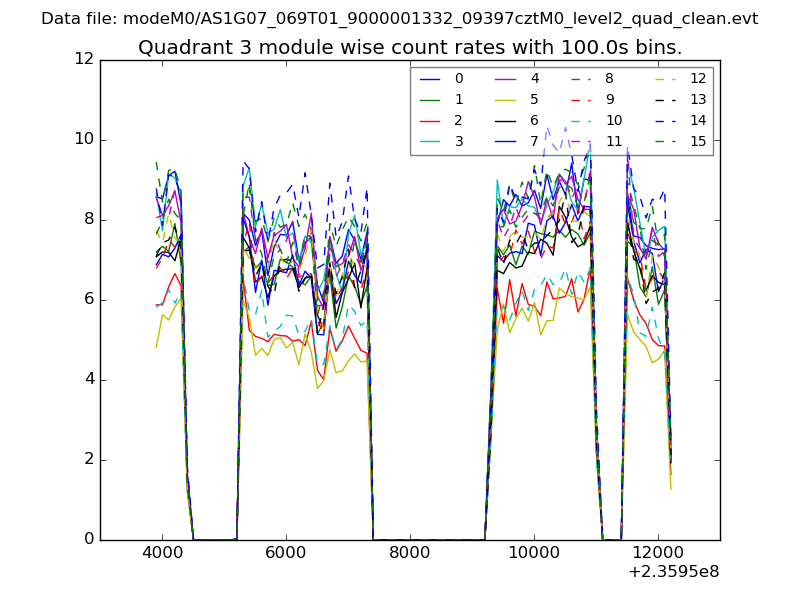
| Module-wise count rates for Quadrant C Data is divided into 100 sec bins |
 |
 |
| Module-wise count rates for Quadrant D Data is divided into 100 sec bins |
 |
 |
| Parameter | Plot |
|---|---|
| CZT HV Monitor | 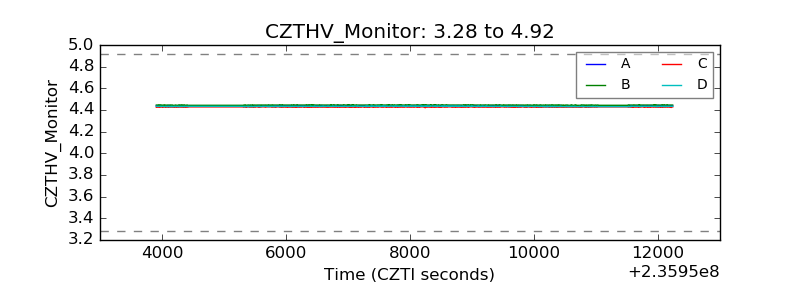 |
| D_VDD | 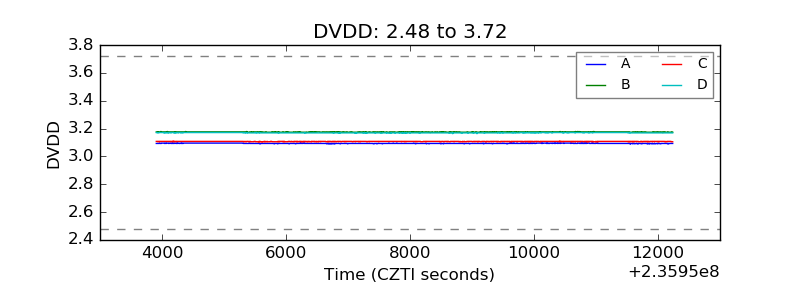 |
| Temperature 1 | 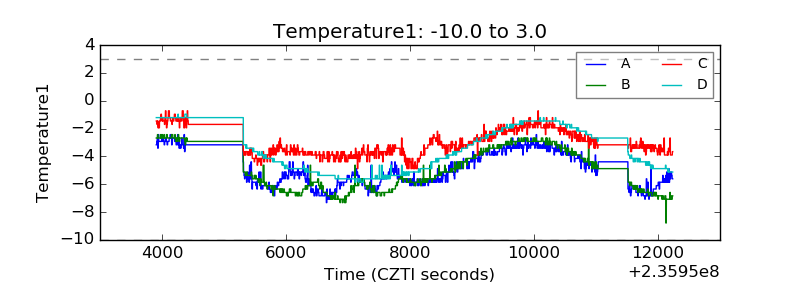 |
| Veto HV Monitor | 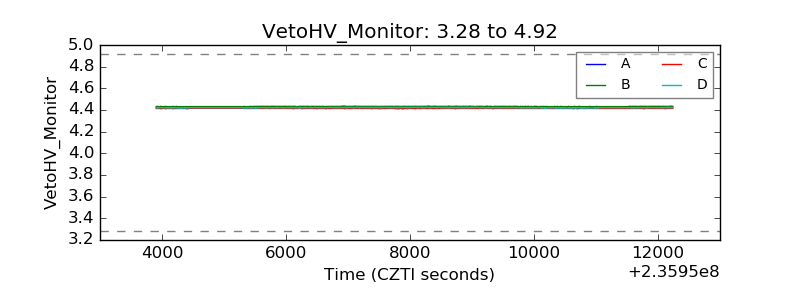 |
| Veto LLD | 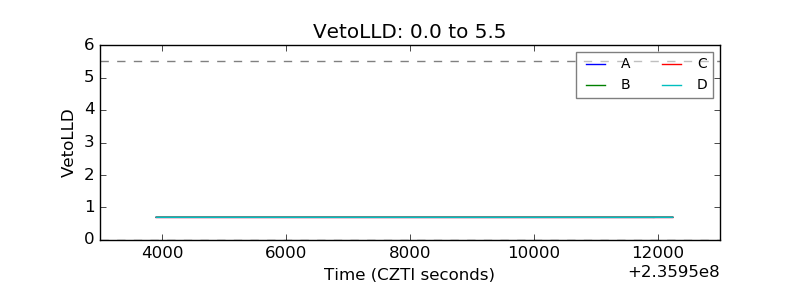 |
| Alpha Counter | 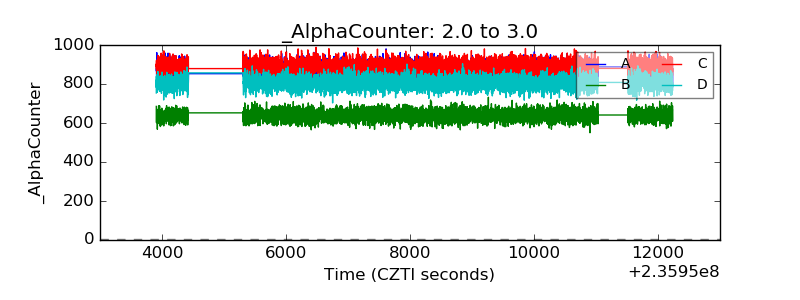 |
| _CPM_Rate | 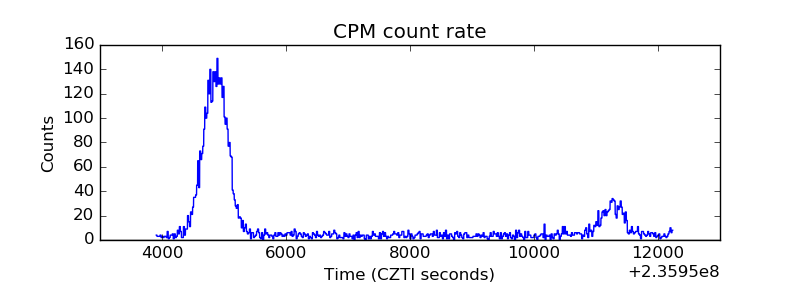 |
| CZT Counter | 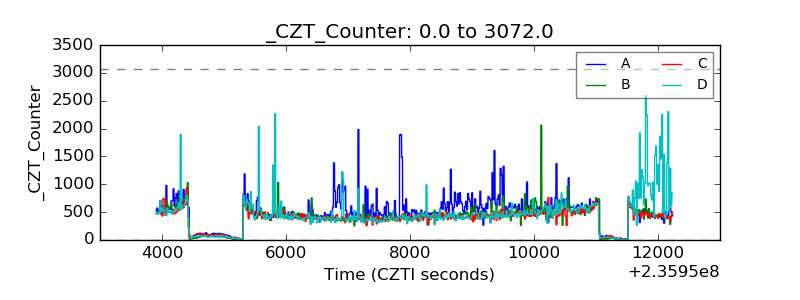 |
| +2.5 Volts monitor |  |
| +5 Volts monitor |  |
| _ROLL_ROT | 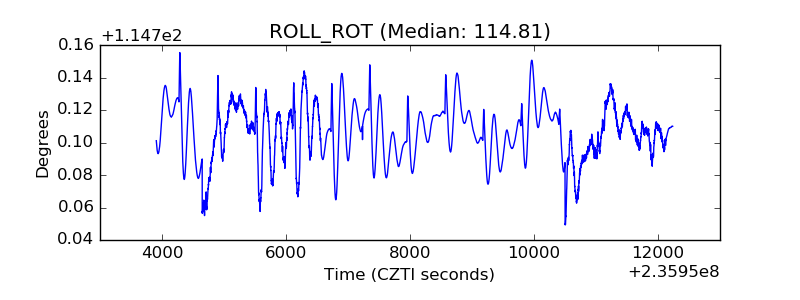 |
| _Roll_DEC | 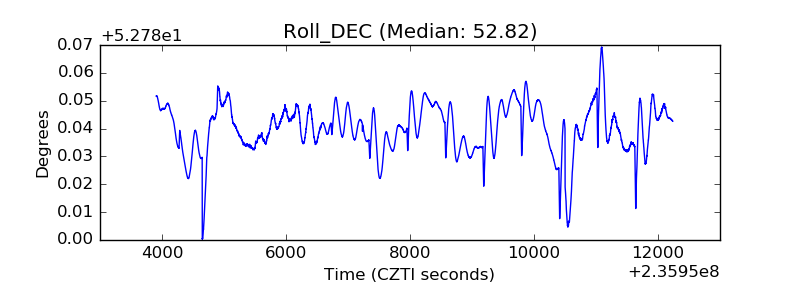 |
| _Roll_RA |  |
| Veto Counter | 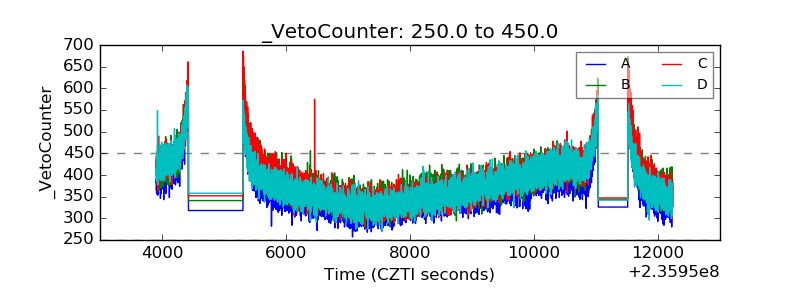 |