| Param | Original file | Final file |
|---|---|---|
| Filename | modeM0/AS1G07_069T01_9000001332_09398cztM0_level2.evt | modeM0/AS1G07_069T01_9000001332_09398cztM0_level2_quad_clean.evt |
| Size (bytes) | 117,938,880 | 26,928,000 |
| Size | 112.5 MB | 25.7 MB |
| Events in quadrant A | 811,162 | 178,523 |
| Events in quadrant B | 720,611 | 180,318 |
| Events in quadrant C | 702,118 | 183,181 |
| Events in quadrant D | 1,240,083 | 168,798 |
| Mode M0 | |||
|---|---|---|---|
| Quadrant | BADHDUFLAG | Total packets | Discarded packets |
| A | 0 | 3400 | 15 |
| B | 0 | 3053 | 26 |
| C | 0 | 2987 | 19 |
| D | 0 | 4687 | 51 |
| Mode SS | |||
|---|---|---|---|
| Quadrant | BADHDUFLAG | Total packets | Discarded packets |
| A | 0 | 30 | 0 |
| B | 0 | 30 | 0 |
| C | 0 | 30 | 0 |
| D | 0 | 30 | 0 |
| Mode M9 | |||
|---|---|---|---|
| Quadrant | BADHDUFLAG | Total packets | Discarded packets |
| A | 0 | 5 | 0 |
| B | 0 | 5 | 0 |
| C | 0 | 5 | 0 |
| D | 0 | 5 | 0 |
| Quadrant | Total seconds | Saturated seconds | Saturation percentage |
|---|---|---|---|
| A | 1400 | 15 | 1.071429% |
| B | 1395 | 13 | 0.931900% |
| C | 1399 | 10 | 0.714796% |
| D | 1392 | 117 | 8.405172% |
Noise dominated data is calculated using 1-second bins in cleaned event files. If a bin has >2000 counts, and if more than 50% of those come from <1% of pixels, then it is considered to be noise-dominated and hence unusable.
| Quadrant | # 1 sec bins | Bins with >0 counts | Bins with >2000 counts | High rate bins dominated by noise | Noise dominated (total time) | Noise dominated (detector-on time) | Marked lightcurve |
|---|---|---|---|---|---|---|---|
| A | 1881 | 1407 | 4 | 4 | 0.21% | 0.28% | 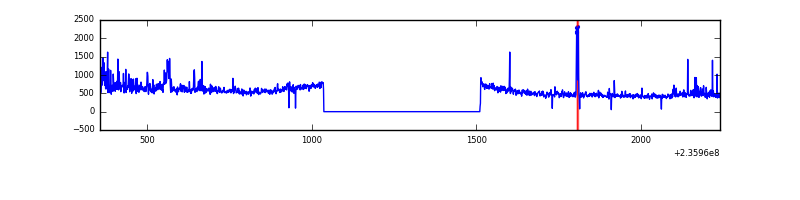 |
| B | 1881 | 1407 | 0 | 0 | 0.00% | 0.00% | 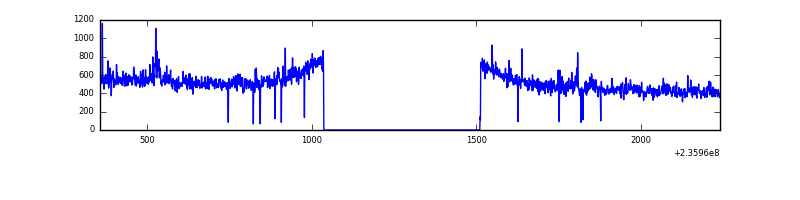 |
| C | 1881 | 1406 | 0 | 0 | 0.00% | 0.00% |  |
| D | 1881 | 1407 | 105 | 105 | 5.58% | 7.46% | 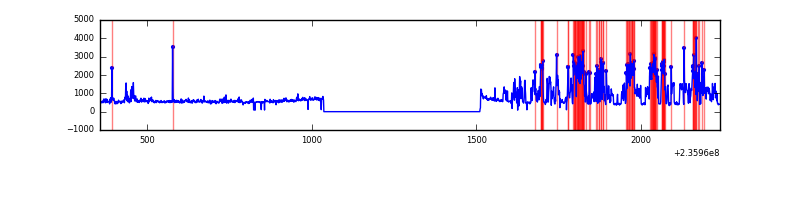 |
Top three noisy pixels from each quadrant. If the there are fewer than three noisy pixels in the level2.evt file, extra rows are filled as -1
| Pixel properties | Quadrant properties | ||||||
|---|---|---|---|---|---|---|---|
| Quadrant | DetID | PixID | Counts | Sigma | Mean | Median | Sigma |
| A | 8 | 5 | 105871 | 2720.09 | 177 | 172 | 38.9 |
| A | 14 | 111 | 15352 | 390.65 | 177 | 172 | 38.9 |
| A | 1 | 162 | 3973 | 97.82 | 177 | 172 | 38.9 |
| B | 0 | 214 | 12504 | 338.17 | 179 | 174 | 36.5 |
| B | 4 | 173 | 4753 | 125.59 | 179 | 174 | 36.5 |
| B | 8 | 234 | 4051 | 106.33 | 179 | 174 | 36.5 |
| C | 13 | 61 | 1302 | 25.44 | 179 | 180 | 44.1 |
| C | 7 | 159 | 610 | 9.75 | 179 | 180 | 44.1 |
| C | 3 | 202 | 458 | 6.3 | 179 | 180 | 44.1 |
| D | 1 | 52 | 505004 | 10650.69 | 171 | 167 | 47.4 |
| D | 7 | 71 | 22491 | 470.98 | 171 | 167 | 47.4 |
| D | 13 | 104 | 20261 | 423.93 | 171 | 167 | 47.4 |
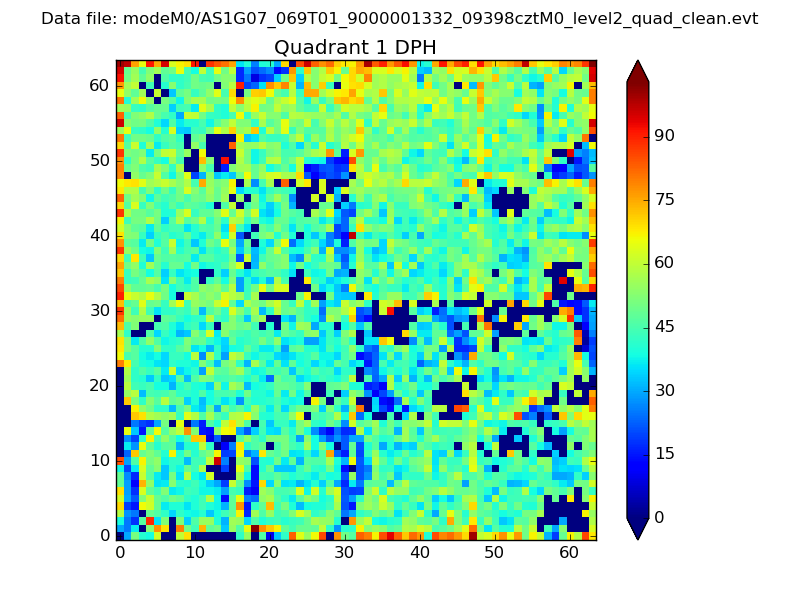
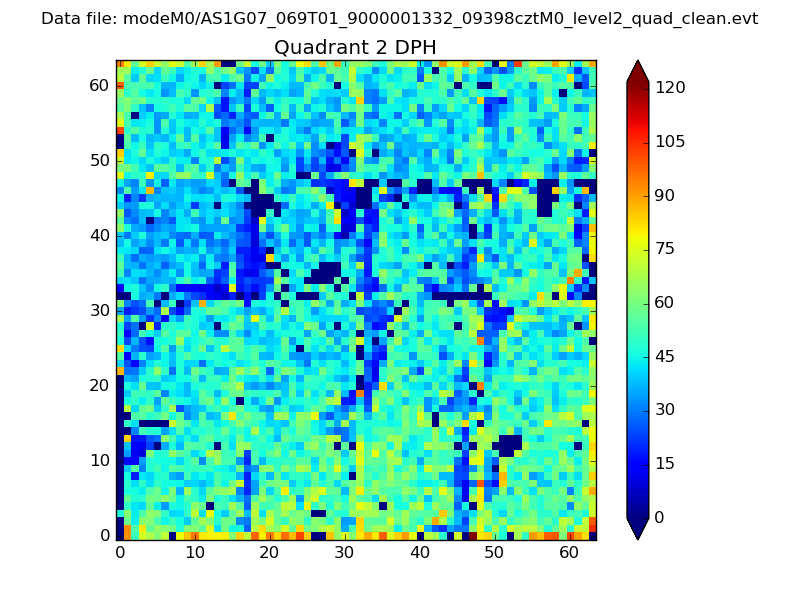
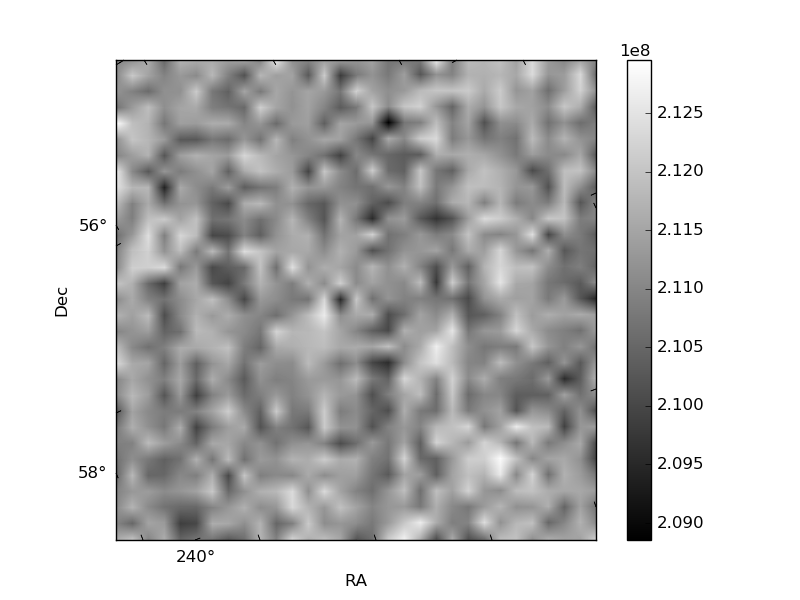
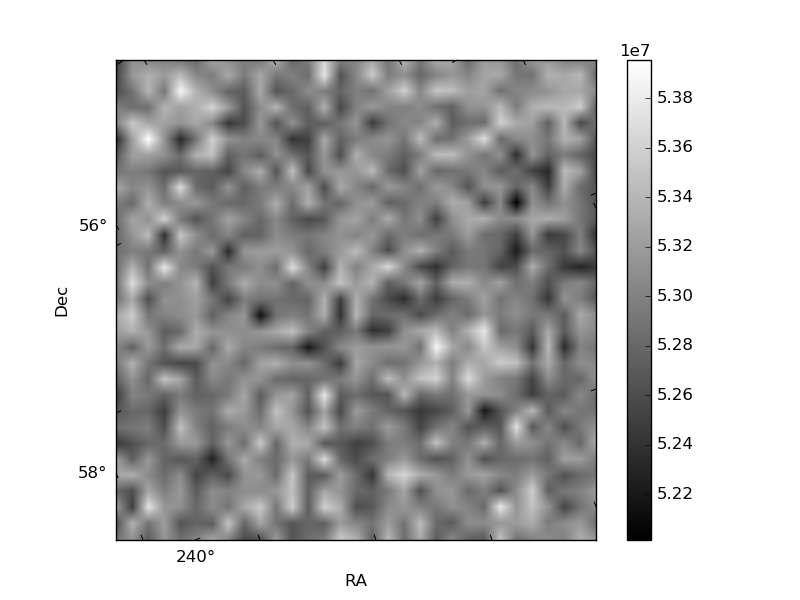
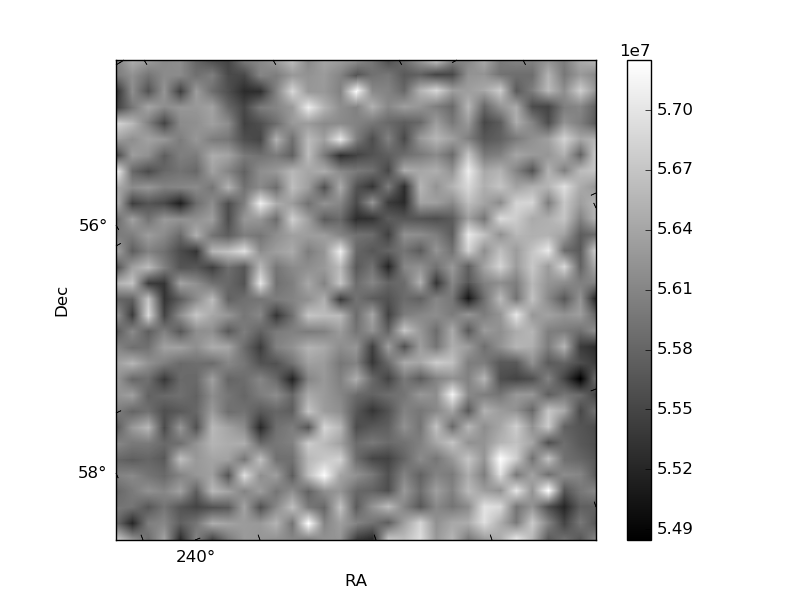
Histogram calculated using DETX and DETY for each event in the final _common_clean file
| Quadrant A | 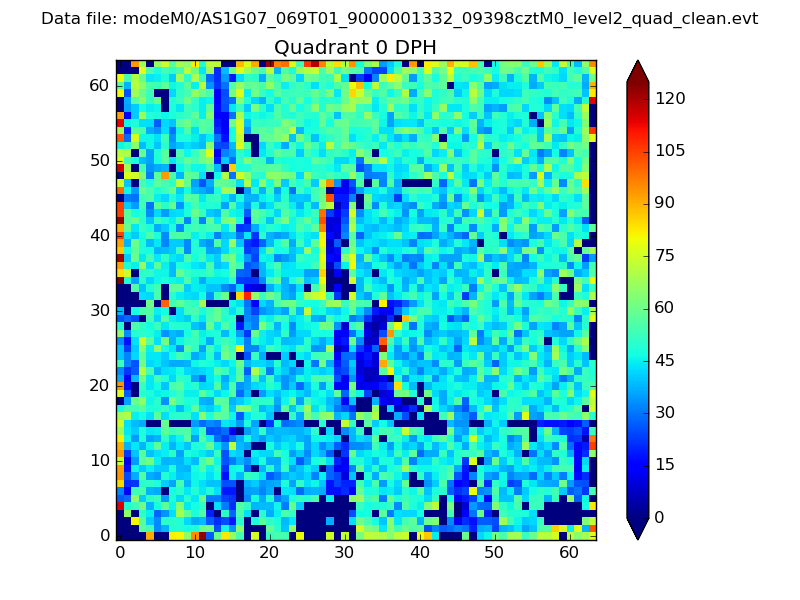 |
 |
Quadrant B |
|---|---|---|---|
| Quadrant D | 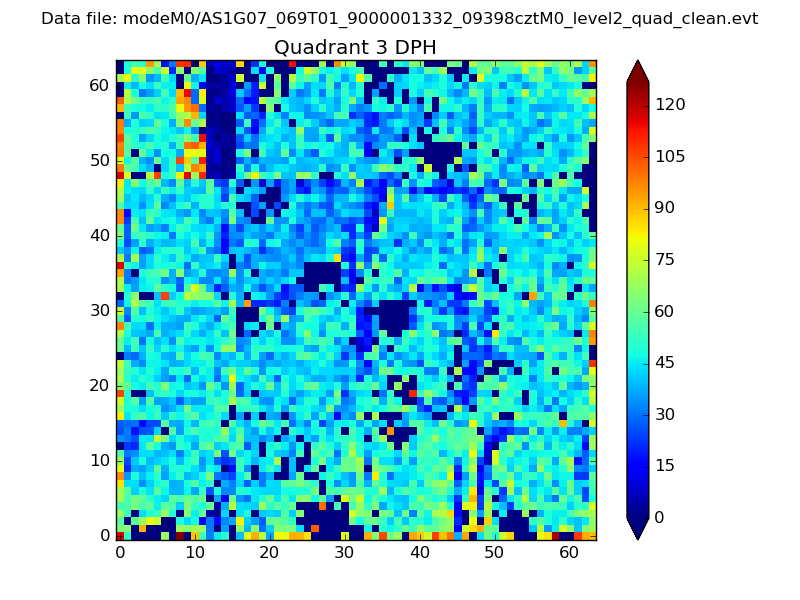 |
 |
Quadrant C |
| Plot type | Count rate plots | Images |
|---|---|---|
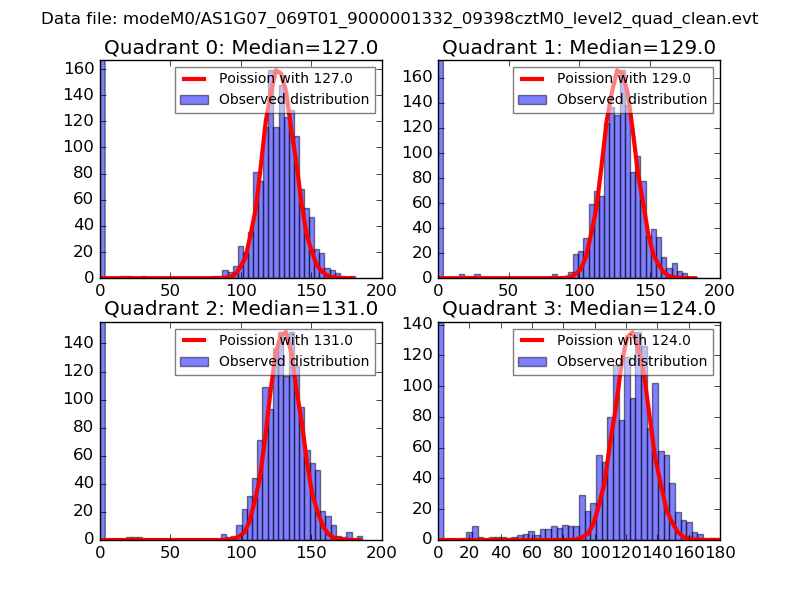
| Comparison with Poisson distribution Blue bars denote a histogram of data divided into 1 sec bins. Red curve is a Poisson curve with rate = median count rate of data. |
 |
 |
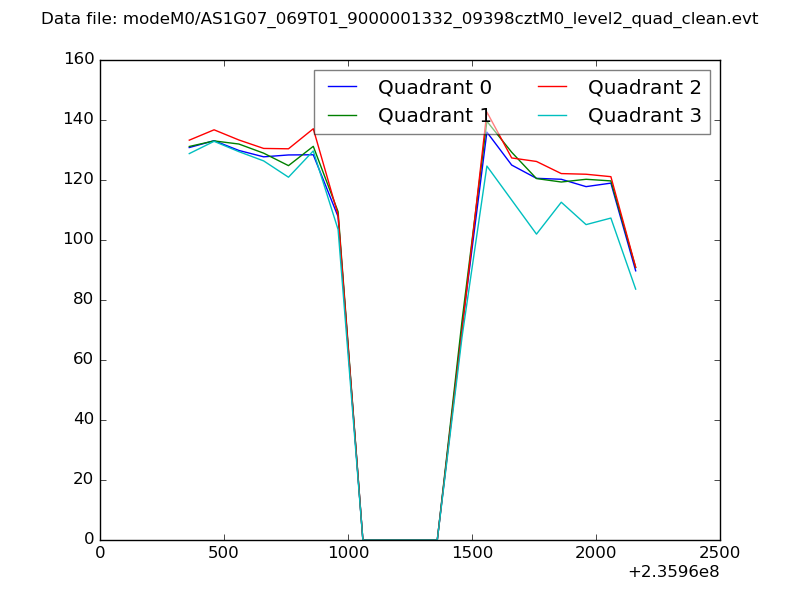
| Quadrant-wise count rates Data is divided into 100 sec bins |
 |
|
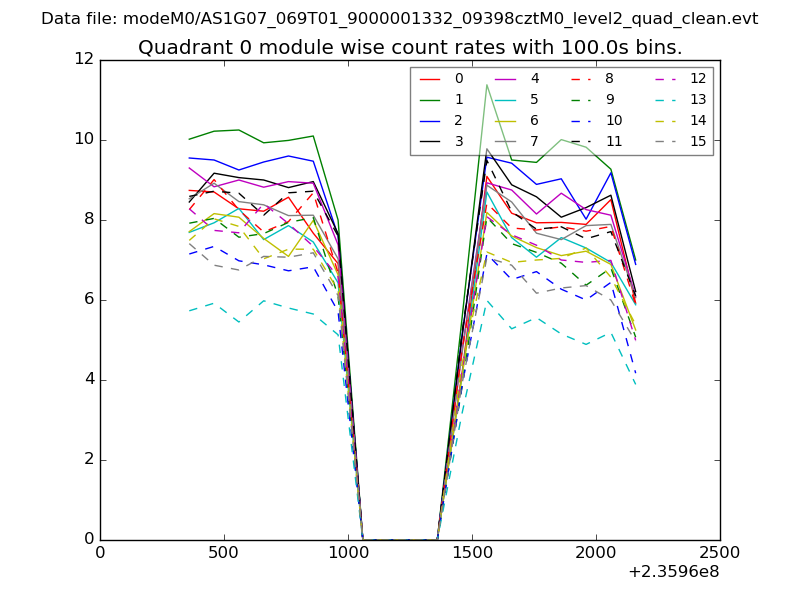
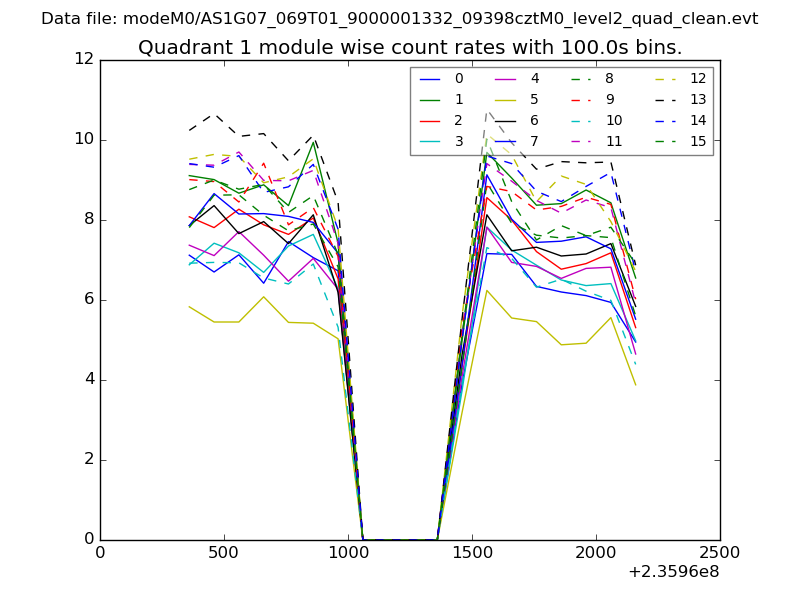
| Module-wise count rates for Quadrant A Data is divided into 100 sec bins |
 |
 |
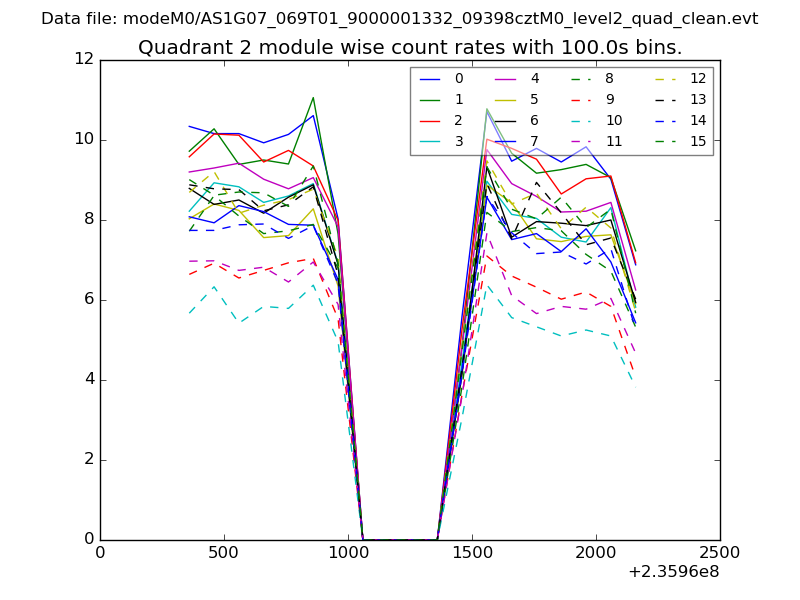
| Module-wise count rates for Quadrant B Data is divided into 100 sec bins |
 |
 |
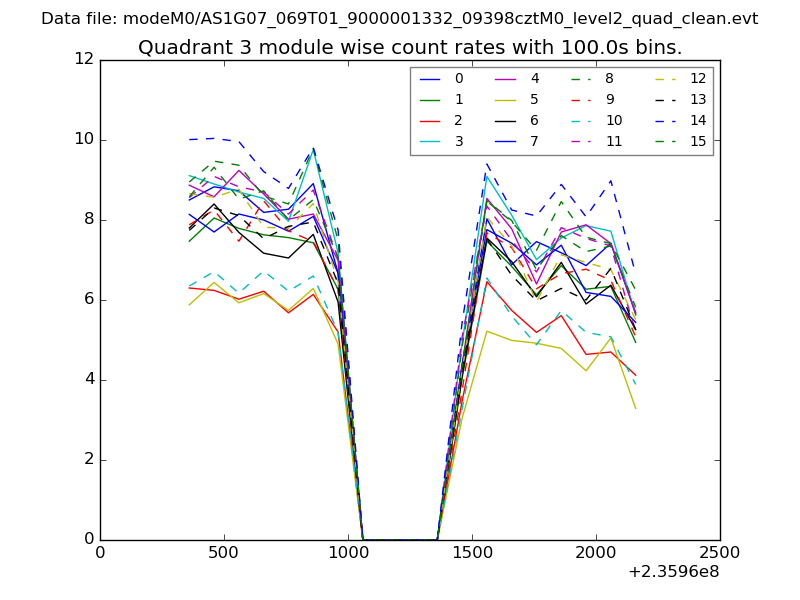
| Module-wise count rates for Quadrant C Data is divided into 100 sec bins |
 |
 |
| Module-wise count rates for Quadrant D Data is divided into 100 sec bins |
 |
 |
| Parameter | Plot |
|---|---|
| CZT HV Monitor | 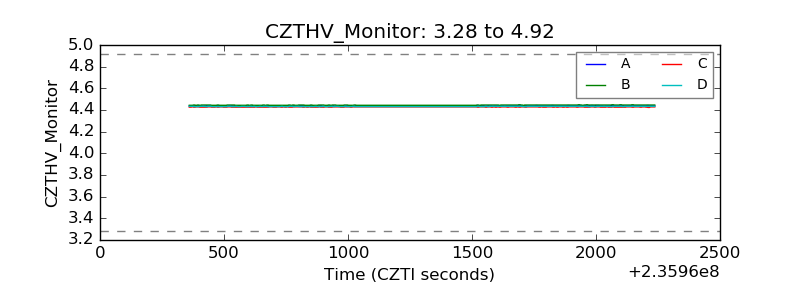 |
| D_VDD |  |
| Temperature 1 | 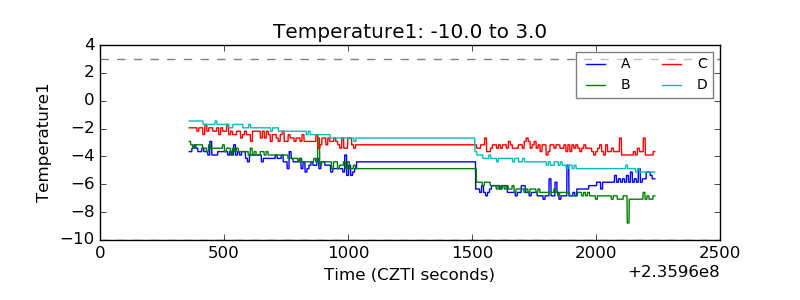 |
| Veto HV Monitor |  |
| Veto LLD | 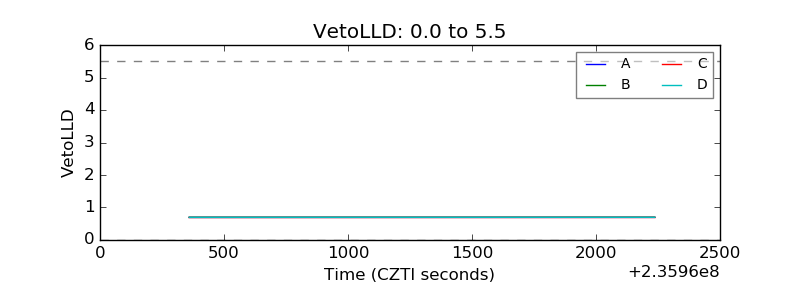 |
| Alpha Counter |  |
| _CPM_Rate | 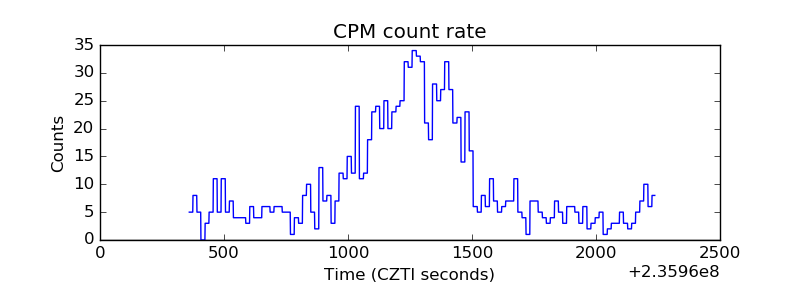 |
| CZT Counter | 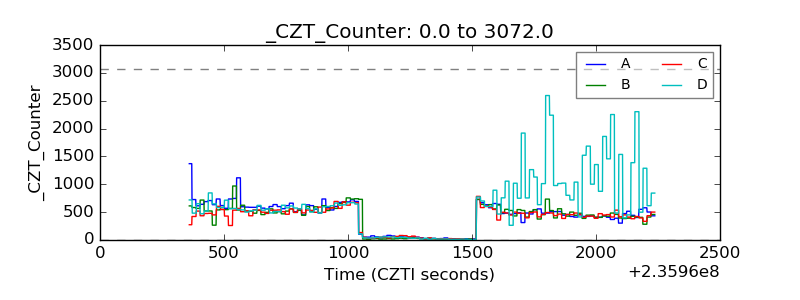 |
| +2.5 Volts monitor |  |
| +5 Volts monitor |  |
| _ROLL_ROT | 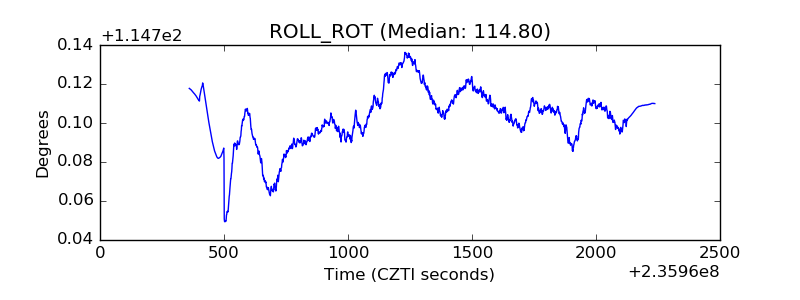 |
| _Roll_DEC | 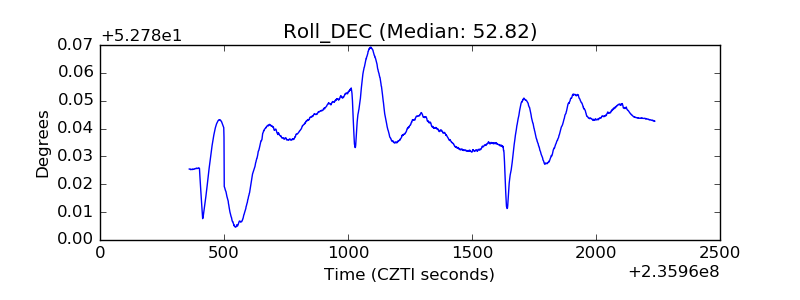 |
| _Roll_RA | 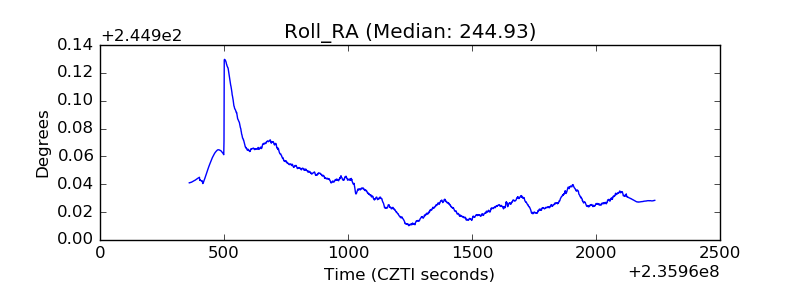 |
| Veto Counter |  |